Diffractive Orbits in an Open Microwave Billiard
Abstract
We demonstrate the existence and significance of diffractive orbits in an open microwave billiard, both experimentally and theoretically. Orbits that diffract off of a sharp edge strongly influence the conduction spectrum of this resonator, especially in the regime where there are no stable classical orbits. On resonance, the wavefunctions are influenced by both classical and diffractive orbits. Off resonance, the wavefunctions are determined by the constructive interference of multiple transient, nonperiodic orbits. Experimental, numerical, and semiclassical results are presented.
Recently, Katine et al. studied the transmission behavior of an open quantum billiard in the context of a two dimensional electron gas (2DEG) in a GaAs/AlGaAs heterostructure [1]. Their resonator was formed by a wall with a small aperture, called a quantum point contact (QPC), and an arc-shaped reflector. A schematic of this resonator is shown in Fig. 1. The voltage on the reflector could be varied, effectively moving the reflector towards or away from the wall. Their measurements showed a series of conductance peaks, analogous to those seen in a Fabry-Perot, as the reflector position was varied.
As we discuss below, the resonator considered here represents a new class of billiards, to our knowledge not previously studied in the literature. That is, the billiard is geometrically open, but in the stable regime, it is classically closed. In the unstable regime, the resonance properties of the billiard are determined in large part by diffraction.
The resonator shown in Fig. 1 has two distinct modes of operation. When the center of curvature of the reflector is to the left of the wall (the regime studied in [1]), then all classical paths starting from the QPC that hit the reflector remain forever in the region between wall and the reflector: the dynamics is stable and the periodic orbits can be semiclassically quantized. Each quantized mode of the resonator can be characterized by two quantum numbers , which represent the number of radial and angular nodes respectively. As the reflector-wall separation is varied, the conductance exhibits a peak each time one of these quantized modes is allowed. Once an electron is in the resonator, the only way for it to leave is by tunneling back through the QPC or by diffracting around the reflector; since both processes are slow, the resonances have narrow widths. Because the QPC is on the symmetry axis, only modes with even can be excited.
When the center of curvature is to the right of the wall, however, the dynamics becomes unstable: all classical trajectories beginning at the QPC rapidly bounce out of the resonator, except for a single unstable periodic orbit along the axis of symmetry, which we will call the “horizontal” orbit [see Fig 1(b)]. Although the horizontal orbit returns to the QPC, it has a low probability of escaping the resonator there because the QPC is much smaller than the de Broglie wavelength of the electron. Because the horizontal orbit is the only periodic orbit in the unstable regime, one might expect resonant buildup only along the symmetry axis. Such a spectrum would be quasi-one-dimensional, with only the half-wavelength periodicity of a Fabry-Perot cavity. However, in numerical simulations it was found that there were other transmission resonances in the unstable regime which did not correspond to any classical periodic orbits [2]. It was proposed that these anomalous peaks are supported by diffraction off the tips of the reflector. Unfortunately, in the mesoscopic experiments, decoherence of the electron wave by impurities in the GaAs/AlGaAs heterostructure shortens the lifetime of the resonances, leaving insufficient energy resolution to resolve the diffractive peaks [3].
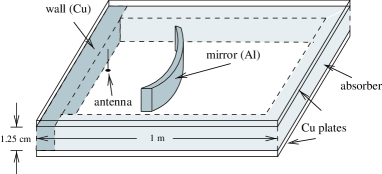
For this reason, we decided to investigate a parallel plate microwave resonator with a similar geometry. In microwave experiments, decoherence and dissipation are not a problem, the geometry of the resonator can be specified much more accurately, and the dynamical range of available wavelengths is much larger. The experimental setup is shown in Fig. 2.
For the transverse electromagnetic (TEM) mode, it can be shown that the equation governing the component of the electric field normal to the plates is identical to the two-dimensional time-independent Schrödinger equation [4, 5, 6]. Therefore, by studying the modes of parallel-plate resonators we can gain insight into the behavior of two-dimensional solutions to the Schrödinger equation.
The resonator consisted of two parallel copper plates, 1 meter square, separated by a distance of 1.25 cm. One side of the resonator consisted of a copper wall. The other three sides were lined with a 11.5 cm thick layer of microwave absorber (C-RAM LF-79, Cuming Microwave Corp.) designed to provide 20 dB of attenuation in the reflected wave intensity in the range 0.6-40 GHz. The absorber prevented outgoing waves from returning to the resonator, thereby simulating an open system in the directions away from the wall. An antenna was inserted normal to the plates, 2 mm from the wall, to simulate the QPC. The curved reflector was formed from a rectangular aluminum rod bent into an arc with radius of curvature . Various opening angles were used: , , , and .
Instead of measuring the transmission of the resonator, we measured the reflection back to the antenna; for this we used an HP8720D network analyzer in ‘reflection’ mode (the complex parameter of the resonator was measured). We inferred the transmission probability via , where is the measured reflection coefficient. Because of the proximity of the antenna to the wall, it was only weakly coupled to the resonator; therefore, in the absence of the reflector, the transmission coefficient was close to zero. However, when the reflector was present, the transmission experienced pronounced maxima at certain frequencies. In Fig. 3 we show a transmission spectrum at fixed frequency, as the distance between the wall and reflector is varied. In the unstable regime, there are two types of resonance. The first type, labeled in Fig. 3, is related to the horizontal orbit along the axis of symmetry, and bears some resemblance to a Fabry-Perot type resonance between two half-silvered mirrors. The second type, labeled , is supported by diffraction off the tips of the reflector.
The wavefunctions corresponding to peaks and were measured using the technique of Maier and Slater [7]. They showed that the frequency shift of a given resonance due to a small sphere of radius at a position is given by
| (1) |
where and are the unperturbed electric and magnetic fields. Thus, the frequency shift is proportional to the local intensity of the microwave field, and by measuring the shift as a function of the position of the sphere, the field intensity of a particular mode can be mapped out. Note that the frequency shift will be positive in regions where the magnetic field is large, and negative where the electric field is large. Also, the factor of multiplying the magnetic field in Eq. (1) indicates that the sphere is a stronger perturbation to the electric field that magnetic field. In our measurements, we found this to be the case: the shifts were predominantly negative. Appreciable positive shifts were only found at the nodes of the electric field, corresponding to maxima of the magnetic field.
Figure 4 shows theoretical quantum wavefunctions compared with experimentally measured frequency shifts for the resonances labeled by and in Fig. 3. The measured frequency shift is plotted as a function of sphere position. It is important to note that the frequency shift is not proportional to , but rather to . Therefore we show only negative contour lines below 20% of the maximum negative shift, and thereby emphasize regions of strong electric field. The similarity between theory and experiment is striking.
The wavefunction labeled in Fig. 4 is clearly associated with the horizontal orbit along the axis of symmetry. Rays emanating from a point source located on the axis of symmetry next to the wall bounce off the reflector and come to an approximate focus about 10 cm from the source. The focus is approximate because of spherical (or in this case cylindrical) aberration.
Now we turn our attention to the state labeled in Fig. 4. As noted above, the only periodic orbit in the unstable regime is the horizontal orbit, along the axis of symmetry. The pictured wavefunction, however, clearly has very little amplitude along this periodic orbit. Instead the wavefunction has a band of higher amplitude running from the region of the tip of the mirror to the QPC, but in the unstable regime there is no classical periodic orbit that does this. Theoretical studies have suggested that states such as are supported by orbits that undergo diffraction off the tips of the reflector [2]. One such orbit is shown in Fig. 1(b). Rays that hit the smooth surfaces of the reflector or wall undergo specular reflection, whereas the rays that hit near the reflector tips can be diffracted. A fraction of the wave amplitude can then return to the QPC from this region, thus setting up a non-classical closed orbit. All peaks labeled with a in Fig. 3 are supported by such diffractive orbits.
Numerical calculations have shown that for energies off resonance, the quantum wavefunction is often intermediate between those shown for and , in the sense that amplitude seems to be running from the QPC to some point between the center of the mirror and the tip [2]. This can be understood in terms of the interference of paths with each other as they “walk off” the horizontal orbit and escape the resonator. Thus diffraction does not play a major role in determining the off-resonance wavefunctions. However, diffraction is instrumental in determining the on-resonance wavefunctions underlying the conductance peaks and in Fig. 3.
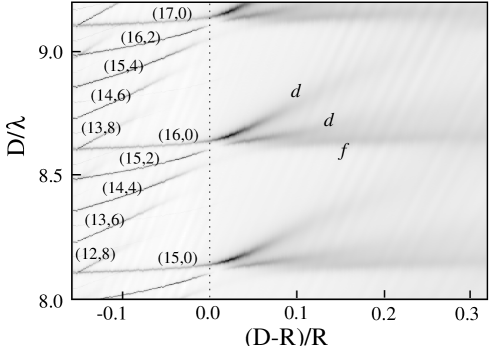
Figure 5 shows a more global picture of the transmission properties of the resonator. Here we plot the transmission of the resonator as both the wavelength and the reflector-wall separation are varied. Each vertical slice through this figure is a frequency spectrum with fixed reflector position; the dotted line marks the classical transition from stable to unstable motion that occurs when the reflector’s center of curvature moves to the right of the QPC. The vertical axis indicates how many wavelengths fit along the horizontal orbit between the QPC and the reflector. The repetition of the resonance pattern every half-wavelength in the vertical direction is analogous to the half-wavelength periodicity of a Fabry-Perot cavity.
In the stable regime we have labeled the peaks with their quantum numbers, . The vertical axis is chosen to make the resonance peaks approximately horizontal in this figure. As the stable/unstable transition is approached, the peaks with high disappear one by one because their large angular sizes allow them to escape around the reflector.
At the stable/unstable transition, all of the resonances in a family would be approximately degenerate, but instead there is an avoided crossing. The level repulsion is caused by a coupling that is partly mediated by diffraction; this subject will be explored more thoroughly in a future publication.
In the unstable regime, the only remaining classical periodic orbit is the horizontal orbit, which itself becomes unstable. The Fabry-Perot peak (labeled ) is essentially quantized along the horizontal orbit, so its position shows a simple dependence on reflector position. It becomes broad in the unstable regime, with a lifetime given by the classical Lyapunov stability exponent of the horizontal orbit. Two diffractive resonances (labeled by ), are also visible; they separate from the Fabry-Perot type peak as the reflector is moved away from the wall. If the angle subtended by the mirror is changed, the position of the Fabry-Perot peak remains unaffected whereas the diffractive peaks shift.
The diffractive peaks labeled by in Fig. 5 cannot be explained by semiclassical theory unless diffraction off the tips of the reflector is included. The semiclassical calculation involves launching a manifold of rays from the QPC, tracking their phases as they reflect off the reflector and cross caustics or foci, and then adding coherently the amplitudes of any orbits that return to the QPC. To include diffraction, we also allow for the fact that every ray that hits the tip of the reflector is scattered in all directions, with an angle-dependent amplitude [8]. Any of those scattered rays that return to the QPC gives an additional contribution to the conductance. The details of the semiclassical theory including diffraction will be presented in a future paper.
Further evidence of the importance of diffractive orbits is contained in the return spectrum (Fig. 6), which is the Fourier transform of the complex reflection scattering matrix element . That is, if a short pulse were emitted from the antenna at time , echos would return to the antenna at certain later times. These echos are indicated by peaks in the return spectrum. Many of the return peaks are split due to the coexistence of the horizontal orbit and diffractive orbits with slightly shorter return times. The horizontal orbit and its repetitions, which have lengths indicated in Fig. 6 by long vertical bars, cause the primary peaks in each group. In addition, near each primary peak there is a family of diffractive orbits (with lengths indicated in Fig. 6 by short vertical bars) which combine to form a secondary peak. The presence of this splitting in the return spectrum is strong evidence in support of the claim that diffraction off the edges of the reflector supports other closed orbits, which lead to resonances in the transmission spectra. Note that for the long orbits, the diffractive peaks are even stronger than the peaks from the geometric orbit. This is because the number of diffractive orbits increases linearly with the length of the orbit, whereas there is alwayse only one geometric orbit, regardless of length.
In summary, we have demonstrated the existence of diffractive orbits in an open microwave billiard, which give rise to wavefunctions that would not be predicted by a simple semiclassical theory. Such orbits are of importance in open, unstable systems where the number of unstable classical periodic orbits is small. In such systems, diffraction can play a major role in determining the spectrum of the system.
We thank the Hewlett Packard Corporation for the loan of a network analyzer that was used in these experiments. We thank J. D. Edwards for the computer program that was used for the quantum computations. This work was supported through funding from Harvard University, ITAMP, and also Grant No. NSF-CHE9610501.
REFERENCES
- [1] J. A. Katine et al., Phys. Rev. Lett. 79, 4806 (1997).
- [2] J. D. Edwards, Ph.D. thesis, Harvard University (1998).
- [3] R. M. Westervelt, private communication.
- [4] H. J. Stöckmann and J. Stein, Phys. Rev. Lett. 64, 2215 (1990); J. Stein and H. J. Stöckmann, Phys. Rev. Lett. 68, 2867 (1992).
- [5] A. Gokirmak et al., Rev. Sci. Inst. 69, 3410 (1998).
- [6] S. Sridhar, D. O. Hogenboom, and B. A. Willemsen, J. Stat. Phys. 68, 239 (1992).
- [7] L. C. Maier and J. C. Slater, J. Appl. Phys. 23, 68 (1954).
- [8] G. L. James, Geometrical Theory of Diffraction for Electromagnetic Waves (Peregrinus, Stevenage, 1976).