“Interaction-Free” Imaging
Abstract
Using the complementary wave- and particle-like natures of photons, it
is possible to make “interaction-free” measurements where the
presence of an object can be determined with no photons being
absorbed. We investigated several “interaction-free” imaging systems, i.e. systems that allow optical imaging of
photosensitive objects with less than the classically expected amount
of light being absorbed or scattered by the object. With the most
promising system, we obtained high-resolution (10 m),
one-dimensional profiles of a variety of objects (human hair, glass
and metal wires, cloth fibers), by raster scanning each object through
the system. We discuss possible applications and the present and
future limits for interaction-free imaging.
PACS number(s): 03.65.-w, 03.65.Bz, 42.50.-p, 42.25.Hz
I Introduction
For most of us, our intuition of how the world works is grounded in everyday experience, and so is necessarily classical. Since its earliest days, the field of quantum mechanics has been characterized by predictions and apparent paradoxes that run counter to our natural intuition. However in remarkably short order, the practitioners of quantum mechanics developed new intuitions [1]. One of the widely accepted tenets of this new intuition is that in quantum mechanics every measurement of a system disturbs the state of that system (unless the system is already in an eigenstate of the measurement observable).
Yet over the years a number of works have tested this new intuition. In 1960 Renninger showed that the state of a quantum system could be determined via the nonobservance of a particular result, i.e., the absence of a measurement or observation can lead to definite knowledge of the state of the system [2]. In 1981 Dicke considered “interaction-free quantum measurements” where energy and/or momentum is transferred from a photon to a quantum particle by the nonscattering of the photon by the particle [3]. And in 1993 Elitzur & Vaidman [4] showed that an arbitrary object (classical or quantum) can affect the interference of a single quantum particle with itself - the noninterference of the particle allows the presence of the object to be inferred without the particle and object ever directly “interacting” [5]. In the Elitzur-Vaidman (EV) interaction-free measurement (IFM) scheme, the measurement is interaction-free at most half of the time. Such experiments were first performed in 1994 by Kwiat et al. [6], and later repeated as part of a public demonstration in the Netherlands [7]. Refs. [6, 8] also proposed several schemes for high-efficiency IFM’s: the fraction of IFM’s exceeds one half, and in principle can be made arbitrarily close to unity, i.e. the probability of absorption can be made arbitrarily close to zero. In the first experiment using a high-efficiency system, Kwiat et al. demonstrated the feasibility of performing IFM’s up to 85% of the time [9]. The possibility of detecting the presence of an object without ever interacting with it led to the suggestion of interaction-free imaging (IFI) [10], e.g., optical imaging of photosensitive objects with much less than the classically expected amount of light being absorbed or scattered by the object. As one of the current limitations to imaging biological systems is power-induced optical damage the possibility of evading this limitation via interaction-free imaging bears further investigation.
While we realize that the best advantage of IFM techniques is realized in high-efficiency schemes, for the sake of conceptual and experimental simplicity, we consider in this paper only devices based on the EV scheme, that is, intrinsically low-efficiency devices. Specifically, we describe investigations of several possible interaction-free imaging devices, present experimental results from the most promising of these, and explore present and future limits to practicable IFI devices. With these preliminary devices we obtained one-dimensional profile images - the objects were raster scanned through the beam of an interaction-free measurement system. To obtain high spatial resolution, the beam at the imaging point is focused to a small size.
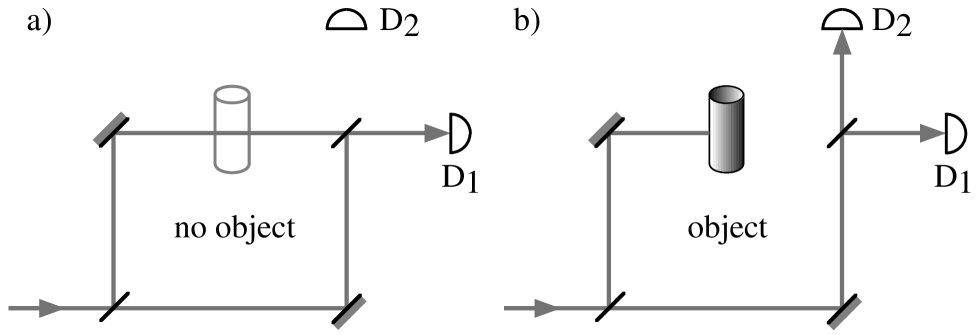
Figure 1 shows the canonical EV scheme: a single photon sent through a Mach-Zehnder interferometer. The interferometer is set so that, if no object is present, all of the light is output to port 1, none to port 2. (Complete destructive interference is always possible if the transmittance (reflectance) of the recombining beamsplitter equals the reflectance (transmittance) of the first beam splitter.) The probability of photon counts at detector 1 is thus unity, whilst that at detector 2 is zero, i.e. & . If an opaque object is placed in one arm of the interferometer the interference is destroyed. The probability of the photon being reflected by the first beamsplitter and thus directed onto and being absorbed by the object is . The probability of detection at detector 1, i.e., the photon being transmitted by the first beamsplitter and reflected by the second beamsplitter, is . Note that in this no-result case we gain no information on the presence of the object - this detector can fire whether the object is there or not. (The high-efficiency schemes do not suffer this ambiguity [6, 9]). The probability of detection at detector 2, i.e., the photon being transmitted through both beamsplitters, is (we label detector 2 the IFM detector: ). On the occasions that detector 2 fires we know that there is an object in the interferometer arm, and we know that no photon was absorbed since we only sent a single photon into the interferometer. The presence of the object has been determined without direct interaction between the detected photon and the object.
The “efficiency” of an IFM device, that is, how often the device is likely to make an interaction-free as opposed to an interaction-full measurement, is defined as [6]:
| (1) |
Assuming lossless beamsplitters, in the EV system considered here this becomes
| (2) |
If we add the condition that the transmittance of the second beamsplitter is then
| (3) |
and we see that as . Note that no-result measurements (from detector 1) are not considered, as we do not mind if a photon propagates through the system and is neither absorbed by the object nor detected at detector 2. For a balanced interferometer, where and the intensities in both arms are equal, the probability of an interaction-free measurement is at a maximum, ; however, the efficiency is only – as the efficiency increases there are more no-result measurements and the probability of an IFM measurement actually decreases. We stress that regardless of the efficiency, when a single photon is detected at detector 2, that particular measurement is completely interaction-free, as the object has been detected yet the photon was not absorbed by the object. The efficiency only relays the ratio of interaction-free to interaction-full and interaction-free measurements: each individual single photon measurement is either no-result, interaction-free, or interaction-full.
Single-photon experiments are more demanding than typical continuous wave (cw) experiments in that they require special detectors, very low background light levels, and so on. Fortunately, it is not necessary to use single photons to analyze and compare various interaction-free imaging schemes. The probability, , of a detection event in the single photon regime is related to the relative intensity of that event in the cw regime:
| (4) |
where is the cw power incident to the interferometer and is the cw power detected at the event port (i.e. ports 1 or 2, or absorbed by the object). All the experiments presented in this work were done in the cw regime. Obviously in this regime no measurement is interaction-free: with many photons simultaneously incident on the interferometer some can be absorbed by the object whilst others can exit via port 2. However, according to the standard rules of quantum mechanics, by measuring the relative intensity of light at a given port (as described in Eqn. 4) we can calculate the probability of an event at that port in the single-photon regime. In other words our evaluations in the cw regime would be identical if performed with a single photon source and detectors.
II Experiments
A Imaging systems
Interaction-free imaging requires an instrument with high contrast interference, in order to give low-noise interaction-free measurements, and an accessible and small beam waist, to allow fine resolution raster scanning of an object. In all, four imaging systems were investigated experimentally. The first three systems were variations on a Michelson interferometer (Fig. 2), the last, a Mach-Zehnder interferometer (Fig. 3). For all systems the imaging beam was the output of a diode laser (1 mW @ 670 nm, Thor Labs, Model 0220-999-0, circular output beam) that was expanded and collimated by a telescope and then apertured with an iris. The detector was a calibrated photodetector (Newport 818-UV, used with 1835-C power meter).
The first imaging system was a Michelson with two lenses (5x microscope objectives), Fig. 2a. This design had an accessible beam waist between the two lenses.
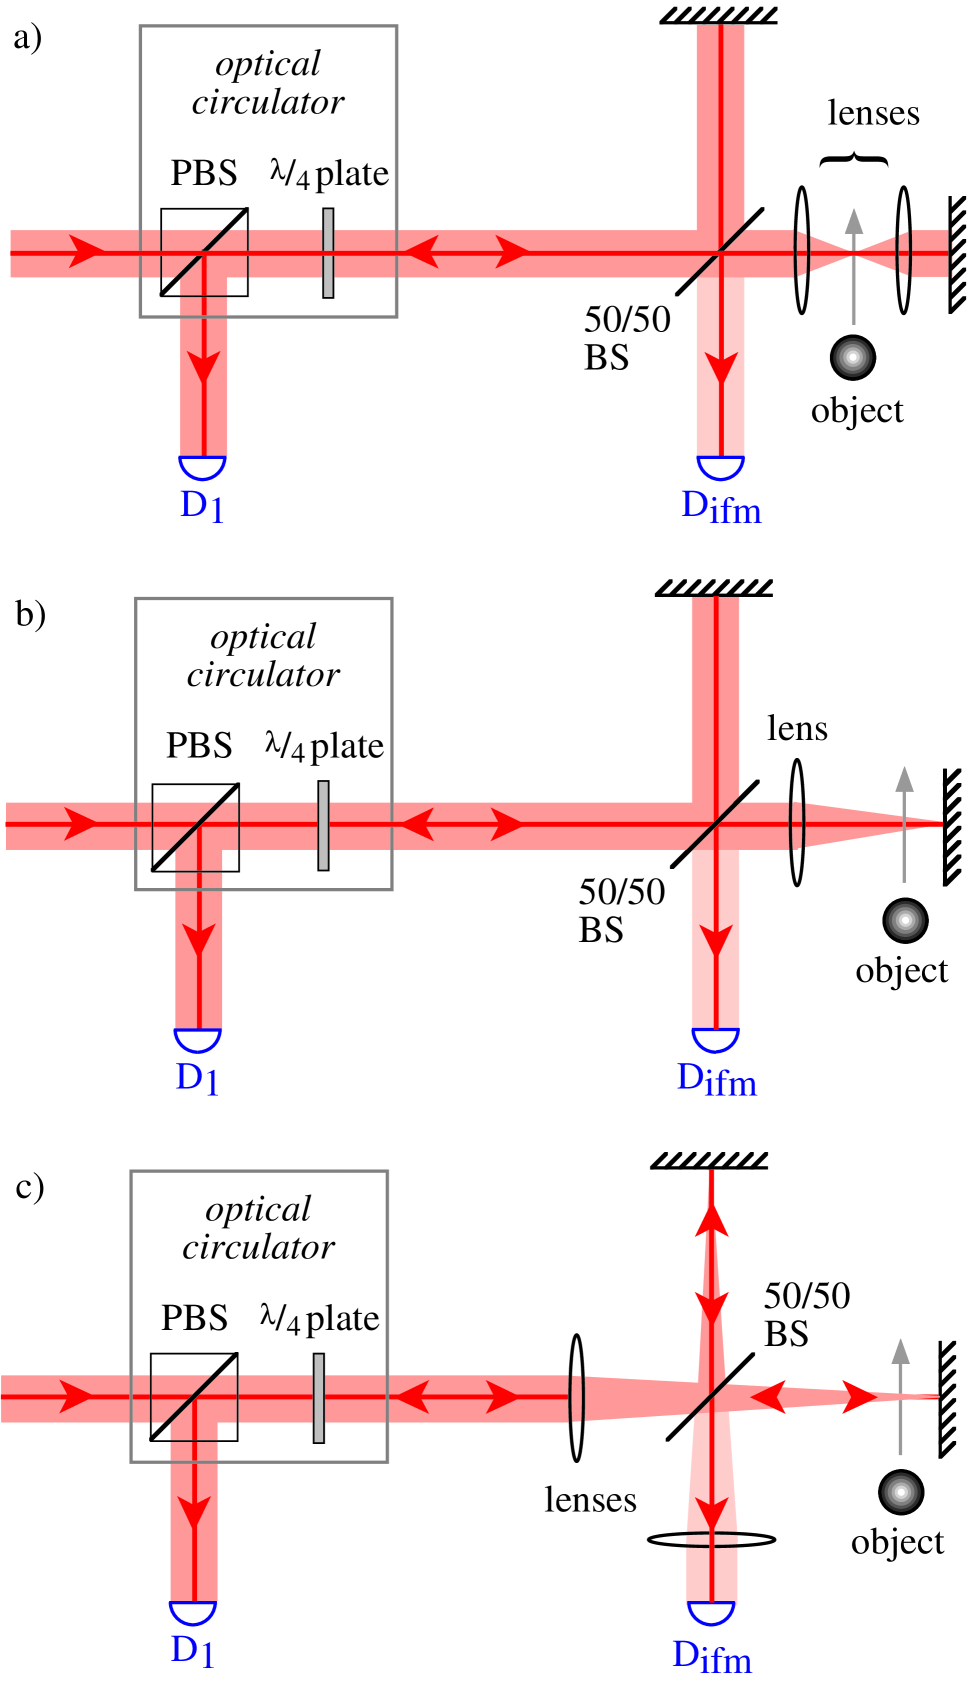
Unfortunately, in practice it had very poor fringe visibility, as the system was very sensitive to alignment mismatch between the lenses (due to coma, astigmatism, etc.). Given the poor performance, no data was taken with this system.
The second system was a Michelson with a single lens in the imaging arm, focused so that the waist was at the end mirror, Fig. 2b. As the beam was spatially inverted in the imaging arm, but not the other, it was still difficult to get high fringe visibility since we did not have the necessary, highly spatially symmetric, wavefront. Further, the waist was no longer easily accessible: due to mechanical constraints, in practice it was only possible to get an object to within m of the waist. Again, no data was taken with this system.
In the third system the lens was removed from within the interferometer and placed before the first beamsplitter, Fig. 2c. This was the best of the three Michelson systems that we considered, in that it had good fringe visibility (in excess of 90%) because both beams undergo the same spatial inversion at their respective mirrors. However, as for system 2, it is not possible to image exactly at the waist.
The Michelson systems were investigated chiefly because of the perceived advantages of their relative ease of alignment. However, regardless of the exact configuration, they all have one feature that complicates interpretation of imaging data: the beam passes through the object twice. If the object is semi-transparent, then twice the actual loss is experienced, and still further analysis of an image is required. Furthermore, a subtle effect means that any data from systems 2 or 3 must be very carefully interpreted. Consider the following argument. In system 3 (Fig. 2c) let half the beam be blocked in the imaging arm at a point just after the beamsplitter. The remaining half of the beam is focused onto the end mirror and returns on the other side of the beam, where it too is absorbed by the initial block. Thus by blocking only half the beam in the imaging arm, all the light in that arm is absorbed (neglecting diffraction), and the interference is totally destroyed. This effect does not occur if the beam is blocked at the waist. However, as mentioned above, we could not image precisely at the waist. In system 3 we typically imaged at around one Rayleigh range, i.e., in a region somewhere between the farfield and the waist, meaning that this half-beam effect is occurring to some degree. The interpretation of the data is then nontrivial: a full calculation accounting for the double Fresnel edge-diffraction would be necessary.
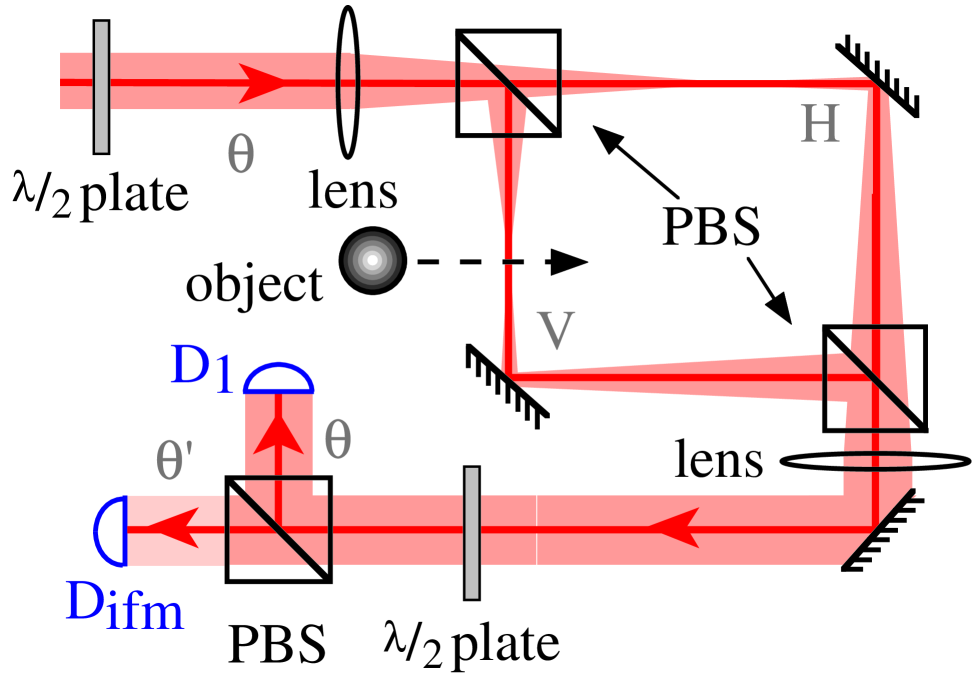
The fourth imaging system was a Mach-Zehnder configuration, used to obtain all the data presented here. With this system it is easy to arrange for an accessible beam waist in free space, and the beam only passes through the object once. Further, it was experimentally necessary to lock the interferometers so that one port, the IFM port, was at a null. This was done with an additional laser (a HeNe at 632 nm) and a simple fringe slope locking system. Incorporation of the locking laser into a Michelson configuration was difficult due to the intrinsic space constraints of that design; incorporation into a Mach-Zehnder configuration was trivial - the empty ports of the interferometer were utilized.
Fig. 3 shows the Mach-Zehnder configuration: a polarizing interferometer, which allows effective tuning of the beamsplitter reflectances. This configuration operates as follows: the first half-wave plate () is set so that the light input to the interferometer is linearly polarized at from the vertical axis. The first polarizing beamsplitter (PBS) splits the light into its horizontal () and vertical () components (for example, gives ). If no object is present, the second PBS recombines the beams to the original polarization, which is then is rotated back to the vertical by the second plate, so that the light is always detected at . If an object is present, however, the interference is modified or destroyed. In the latter case, only the horizontal component is transmitted by the interferometer, the vertical component being absorbed by the object. (In quantum terms, only the probability amplitude of the horizontal polarization path contributes to the final probabilities). The horizontally polarized output is rotated towards the vertical axis by the second plate, so that some counts occur at () - these counts are the interaction-free measurements. As with the most successful Michelson system, the focusing lens (mm) was outside the interference region.
B Imaging results
We performed one-dimensional scans of a variety of different objects, including a simple knife-edge, human hair, metal wire, cloth and optical fibers, and a narrow slit (the absence of an object). Typical results are shown in Fig. 4, these being obtained for , i.e., input light polarized at and analyzing at .
The objects were scanned stepwise through the beam using a motorized translation stage incorporating a high-resolution (m) encoder. At each step two measurements were recorded: the first was an interaction-free measurement — monitoring the dark port of the interferometer (analyzing at ) for an inhibition of the interference; the second measurement was a normalized transmission scan obtained by blocking the interferometer arm that did not contain the object and measuring at the no-result port (detector ). These are respectively the lefthand () and righthand () ordinates of Fig. 4. Note that is the probability of a photon being transmitted through the object outside of the imaging system, i.e., just the normal transmittance curve for the object. The probability that a photon is absorbed by the object when it is in the imaging system is given by , where
| (5) |
The knife-edge profile, Fig. 4a, is used to measure the resolution of the system. Since the knife edge certainly has a step-function profile on the micron scale, the rounding of the edges on the scans is necessarily due to the spot size of the beam. Taking the derivative to obtain a Gaussian-like function, we infer a FWHM spot size of m. The Rayleigh resolution of the system is thus given by m [11]. The difference between this and the theoretical value of m (see Appendix 1) is probably due to the non-ideal beam-quality — despite aperturing down, the beam was still not entirely spatially uniform.
The path of the knife edge through the beam is shown by the transmission scan: the beam was initially unblocked (m) and the knife edge was scanned through until the beam was totally blocked (m). In principle in the absence of the knife edge; however, in practice it is not, as shown by the value in Fig. 4a. This background noise is from light leaking through the “dark” port due to the imperfect fringe visibility ( for this scan), and can be thought of as the “dark noise”, , of the interaction-free detector (for this scan %). For the remainder of the scans, the visibility was improved to reduce the noise, which varied between %.
In the simple Mach-Zehnder EV scheme described in the introduction, the IFM probability is set by the transmittance of the two beamsplitters in the interferometer; in the polarizing Mach-Zehnder this is instead the transmittance of the first polarizing beamsplitter and the transmittance of the analyzing beamsplitter after the second half-wave plate. The exact values of these transmittances for a given experiment can be inferred from the ratios of measurements at & for both the transmission and the IFM scans when the object is fully blocking the beam. Recall that when an object is fully blocking the beam the expected IFM probability is the product of these transmittances. For the knife edge scans , and so , in good agreement with the observed value of on the right hand side of the IFM scan in Fig. 4a (the error on each data point in the IFM scans is typically % of the value of that point).
Fig. 4b is a profile of a metal wire. The diameter (FWHM) of the wire was estimated from both the transmission (m) and IFM (m) scans and was in good agreement with the width measured via a microscope (m) and diffraction of a laser beam (m). A larger wire was also scanned (not shown) and again agreement between the transmission (m), IFM (m) scans and microscope (m) and diffraction measurements (m) was very good. This gives us confidence that the system can be used to accurately profile opaque objects at this scale.
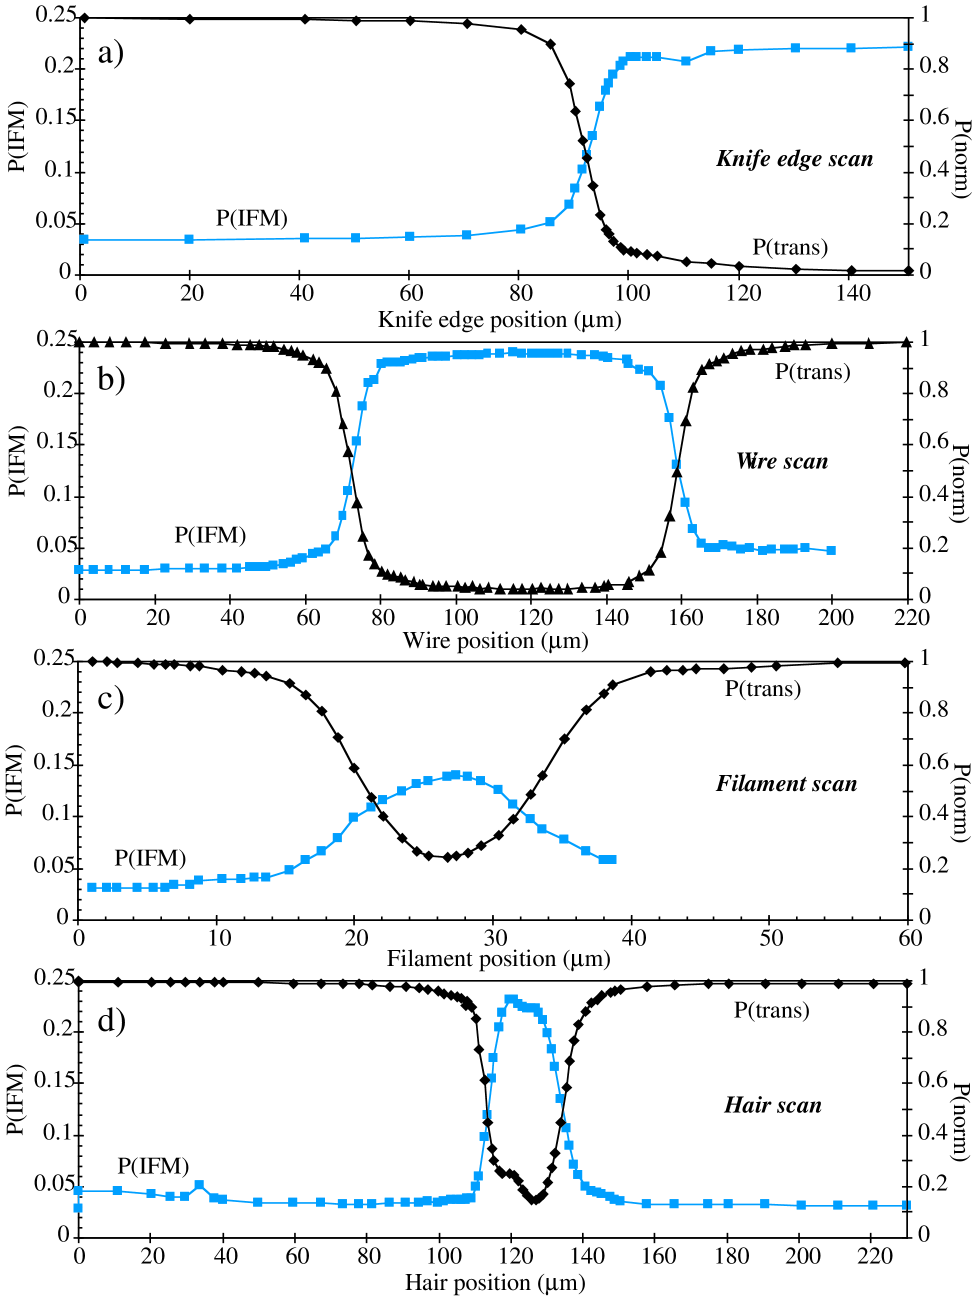
For these scans the transmittances were adjusted (, ) to give a higher expected IFM probability, . Again this agrees with the actual IFM values observed in the center of the IFM scan where the wire totally obscures the beam. The efficiency of the measurement in the central region can be calculated directly from Eqn. 2, we obtain . Alternatively, can be calculated via Eqn. 1; however, this requires the probability of absorption, , which was not measured directly. Fortunately, can be calculated from the measured value of the normalized probability of transmission (see Eqn. 5). In the central region , again giving an experimental efficiency of . The agreement between the efficiency calculated only from the reflectances and the efficiency calculated using the inferred absorption probability gives us confidence in the experimental analysis.
Note that the noise on the IFM scan rises slightly towards the right hand side of the scan, and that the IFM scan terminates before the transmission scan. This behavior is due to the non-ideal lock of the interferometer: the system gradually drifted away from the dark fringe, increasing the light and thus the noise through the dark port, before finally losing lock, ending the IFM scan. This behavior is seen on several of the scans (b,c,e,f) and highlights the importance of a robust locking scheme in future IFI systems.
Fig. 4c is a profile of a cloth fiber. The FWHM diameter was measured to be m (microscope) & m (diffraction), respectively. The difference between these two measurements suggest that the fiber had a non-uniform or non-isotropic (e.g. elliptical) cross-section, and that different sections or orientations of the fiber were measured by the two different techniques, giving slightly different widths. This is further borne out by the FWHM diameters measured from the transmission and IFM scans (16.3 m & 16.6 m, respectively): they are consistent with one another, are within one sigma of the diffraction measurement, and differ significantly from the microscope measurement.
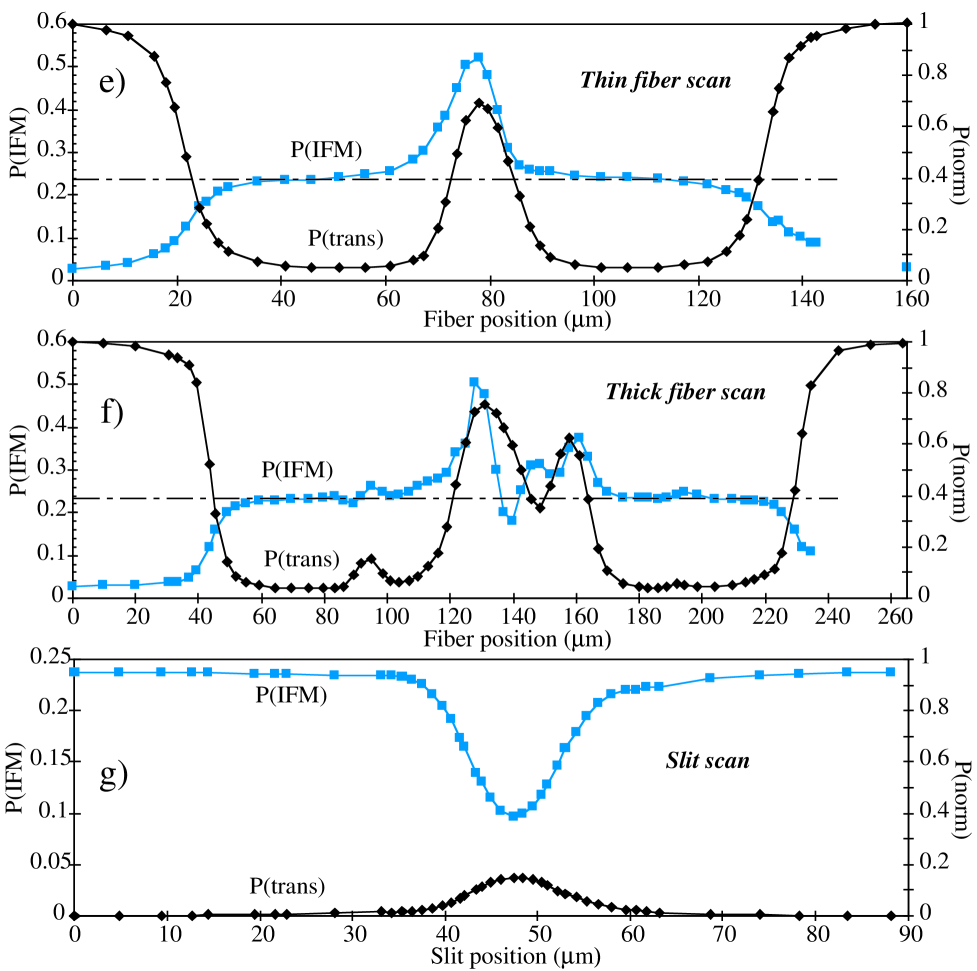
A more important feature of this scan is that as the transmission never drops to zero (i.e. the cloth fiber is not fully opaque), the probability of an interaction-free measurement never attains its maximum value of one quarter. At the minimum of transmission, , from which we expect, (see Appendix 2 for calculating from ). Actually, the observed value was higher than this, . A similar discrepancy is seen in the profile of a human hair, Fig. 4d. Note the internal structure of the traces. As can be seen from the transmission scan, the hair is also not totally opaque (the transmission never falls to zero, c.f. scans a & b), and furthermore near the center of the hair (m) more light is transmitted than at the edges, particularly the right edge (m). Left of center, where the object is less opaque and there is seemingly less chance of an IFM, one might expect the IFM scan to drop accordingly; however, it clearly increases. This is even more striking in the profile of a thin optical fiber, as shown in Fig. 4e. Here for two thirds of the width of the fiber, the fiber is essentially opaque (due to scattering and reflection from the curved surface of the fiber), and is near the expected value of . However, in the middle of the fiber the transparency increases notably, and attains values of up to 0.52, exceeding even the naïve in-principle limit of 0.25.
In all three cases (scans c-e) we believe the increase in is caused by the light transmitted through the object acquiring a relative phase shift, which changes the interference conditions and so causes the IFM port to no longer be at a dark fringe. This is clearly an important phenomena in IFM measurements (and in fact, is present to an even greater degree in high-efficiency schemes [9]). Consider, for example, imaging a completely transparent object (; ) that introduces a -phase shift: all the light is detected at the “dark” port detector yielding a 100% efficiency, i.e. and . As the transparency of such an object is reduced, then and decrease accordingly. In the limit where the object is totally opaque we recover our familiar results of , and as given by Eqn. 3. As soon as there is some probability that a photon can be transmitted through the object, it is no longer sensible to describe the measurements as interaction-free, and concepts and equations based on the assumption of detecting a wholly opaque object need to be used with care (see Section III).
But what exactly causes the phase shift? As shown by the asymmetry of the IFM scan in Fig. 4e it is clearly associated with, but not directly proportional to, the increase in transparency. There are several possible causes for both the phase and transparency shifts: scattering and reflection from the object; the phase shift due to passage through the object (, where is the width of the object that the light passes through); and the geometrical phase shift due to the additional focusing from a semi-transparent cylinder (i.e. the Guoy phase shift associated with focused beams; approximately radians [12]). In Fig. 4e , from which we expect , if there were no phase shift (see Appendix 2). As the experimental value is , we calculate, using Eqn. 20 from Appendix 2, that the relative phase shift for light passing through the center of the fiber is 104∘.
It is tempting to interpret the transmission scan of Fig. 4e as a straightforward image of the well-known internal structure of an optical fiber, i.e., a core cylinder of glass surrounded by a cladding cylinder of higher refractive glass. However, given the opportunity for refraction and beam-steering, things are not likely to be so straightforward, as borne out by the profile of a thicker optical fiber in Fig. 4f. Here there are 4 peaks in the transmission scan (two central, and two small side peaks) and four corresponding features in the IFM scan. These are most likely due to guided and scattered light paths, and certainly don’t represent a simple profile of the core structure. The shape of the features in the IFM scan reflect that the phase shift across the transmission peaks is large and non-uniform.
Finally, Fig. 4f is the profile of the absence of an object, i.e., a slit. The slit was constructed by aligning two razor-blade edges in close proximity. Due to mechanical constraints the blade edges were not exactly parallel and the slit was marginally V-shaped. From the transmission and IFM scans, we respectively infer a slit width of m & m; from the diffraction measurement, a width of m. It is probable that the difference was due to a slightly different vertical alignment of the slit with respect to the beam. Note that this, combined with a small longitudinal shift from the waist position, may also explain the surprisingly low transmission (the slit was effectively nearly opaque). The IFM scan is sensitive to small changes in the effective transparency of the object: when the object fully blocks the beam, () and is at its maximum value, ; a small change in the transparency, to , , leads to a much larger change in the IFM scan, (which agrees within error with the expected value, ). This sensitivity to small changes in transparency holds promise for high-relief interaction-free imaging of low-relief absorption objects, with much less than the classically necessary light flux. The effect is in fact more pronounced in high-efficiency schemes, wherein it is possible for a given absorptive object to have a lower probability of absorption than another object with lesser intrinsic absorptance [9].
As a final note, we point out that it may be possible to use the current device to obtain information on the polarization properties of objects. As currently used, the object is interaction-free imaged by purely vertically-polarized light (i.e. s-polarized with respect to vertically aligned objects); equally validly, interaction-free imaging could be done in the complementary arm with horizontally-polarized light (i.e. p-polarized w.r.t vertically aligned objects). Fine polarization-dependent details could then be brought out by looking at the difference of the two interaction-free images.
C Approaching high efficiency
In principle the measurements in the last section could have been made at efficiencies higher than (up to in the EV scheme). However, there was a strong experimental reason that this was not done. As discussed previously, the probability of an IFM in the EV scheme is actually highest when , i.e. and . Because the IFM noise floor is a fixed value set by the visibility of the interferometer (2-3% for our system) the greatest signal to noise ratio (and so the greatest detail) for IFM scans is attained when .
To investigate this issue, and efficiency were measured for a range of reflectances. An opaque object completely blocked the imaging arm of the polarizing Mach-Zehnder. By appropriately varying the angles of the two half-wave plates (see Figure 3) the reflectances were varied so that , where . The results are shown in Fig. 5. For high reflectances, , as the probability of absorption is very high. attains its maximum value at ; in the region , decreases because the probability of a no-result measurement increases. (The decrease is not reflected in the efficiency because by definition depends only on the ratio of to & , and also decreases as .)
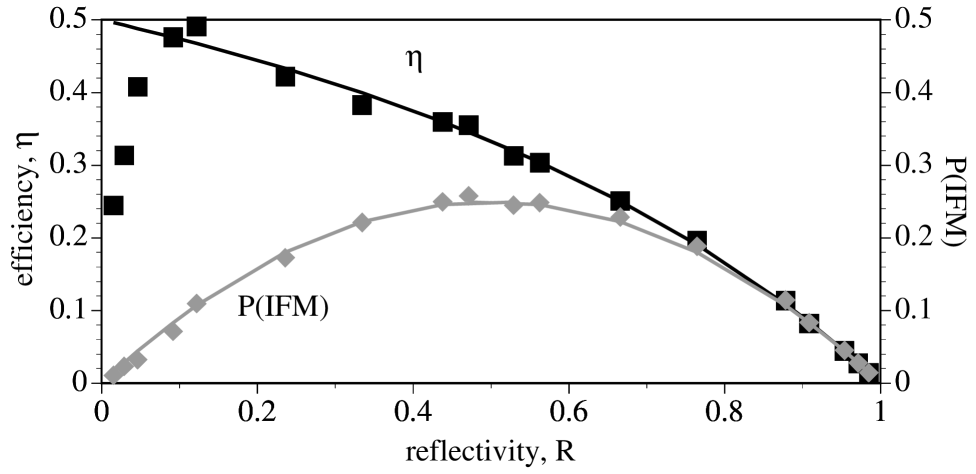
The experimental values of were calculated directly from the output powers (as described by Eqn. 4). To obtain the experimental values for efficiency it was necessary to know the values for : these were calculated by assuming that the sum of the absorption, interaction-free, and no-result powers equaled the observed output power in the absence of an object. The agreement between experiment and theory for is excellent
The agreement for the efficiency is also very good but breaks down badly at low reflectances, when polarization cross-talk degrades the efficiency. Polarizing beam splitters (PBS) are designed to separate an arbitrarily polarized beam into its horizontal and vertical components. The cross-talk of a PBS is the residual amount of the orthogonal polarization on each “pure” output beam. Thus at low reflectances, where is in principle vanishingly small, in practice it has a fixed value, set by the cross-talk. The undesirable consequence of this is that, while decreases as , is fixed due to the cross-talk, and thus the efficiency decreases sharply. The system only behaves as described by Eqns. 1-3 for reflectances above %.
III Discussion
As has been touched upon in the experimental results section, semi-transparent objects necessarily force a reevaluation of what is meant by an “interaction-free” measurement. The original central idea of interaction-free measurement was a totally opaque object causing the non-interference of a single photon [4]. Classical objects can modify this effect if they are semi-transparent or diffract the light. A transparent or semi-transparent object can phase-shift the light and modify the interference (we note in passing that such shifts can in principle yield information about the dispersive properties of the object). However, even in the absence of such a phase shift, some interference will still occur, as any transmitted light may interfere with the light from the other arm of the interferometer. Similarly, even a totally opaque object may allow interference if it diffracts light in such a way that it can overlap with light from the other arm.
Quantum objects may also be imaged by interaction-free detectors [13, 14]. For these objects, any forward scattering (be it due to transparency, diffraction, re-emission, or some other process) will allow some degree of interference. Further, during “interaction-free” measurements of quantum objects, momentum and energy can be transferred from the light to the object [3, 15] if there is a forward scattering amplitude from the object. Energy and momentum transfer are unusual phenomena indeed for an “interaction-free” measurement!
Accordingly, we reiterate that as soon as there is some probability that a photon can be transmitted or diffracted by the object, it is no longer sensible to describe the measurements as truly interaction-free, at least in the original sense of the phrase.
An interaction-free measuring system can be thought of as a detector, albeit an unusual one. As with all detectors, IFM systems are characterized in terms of their efficiency () and noise (). The interaction-free imaging systems considered here are extensions of this concept — they are IFM detectors with fine spatial resolution. The ultimate limit to spatial resolution for any standard optical detector is the diffraction limit: in the current system we are still some way from achieving this limit ( 10 m vs 0.6 m). In the future it may be better to avoid polarization-based IFM detectors, since the polarization cross-talk limits both the spatial resolution (see Appendix 1) and the minimum noise of the detector.
For practical applications the greatest benefit will be obtained by incorporating imaging into a high efficiency IFM system [6, 8], as it is only in these systems that the chance of a photon interacting with the object becomes vanishingly small. Because such systems are in their infancy, with current efficiencies of only % [9], the issue of incorporating imaging into these systems is non-trivial, and requires further research. Aside from this, further technical improvements are conceivable: for example, the possibility of obtaining an image “all at once” using a large diameter interrogating beam, and some sophisticated image-processing algorithm to back-out from the interference pattern the image of the object.
Classical objects that would benefit from the greatly reduced photon flux of interaction-free imaging include: biological systems, such as cells [16], whose biological and chemical operation can change as a function of light level; and cold atom clouds, which can literally be blown apart from the photon flux of conventional imaging systems. Not only could a variety of “delicate” quantum objects (such as trapped ions, Bose-Einstein condensates, or atoms in an atom interferometer) be interaction-free imaged as well, but in high efficiency systems the act of imaging can entangle the imaging photons and the quantum object, creating novel quantum-mechanical states, such as entangled “Schrödinger Cat” states [13].
The difference between conventional and interaction-free measurements of the presence of an object is that in the latter, in principle the object can be detected with no photons interacting with the object. Similarly, the principal difference between conventional and interaction-free imaging of an object is the vastly reduced photon flux needed to obtain an image in the latter. Current photonic imaging systems (e.g., optical low coherence reflectometry, OCLR) can have very high sensitivity (to opacity), say one part in (-120 dB). However, this is at the expense of sending photons through the imaged object and having at least one of those photons interact in a detectable fashion (e.g. in OCLR, by backscattering) - of course the remaining photons can and do interact with the object in a variety of ways (general scattering, absorption, etc.). In contrast to this, we suggest that a high-efficiency interaction-free imaging system might attain high sensitivity by having only a few photons interact with the object, the rest remaining in the other arm of the interferometer - further analysis is needed to quantify this. In any event, it is clear that the techniques of interaction-free measurements and imaging, presented here and elsewhere, offer unique capabilities beyond those normally considered in conventional optics.
IV Acknowledgments
We wish to acknowledge fruitful discussions with Anton Zeilinger, Raymond Y. Chiao, Morgan W. Mitchell, Anders Karlsson and Gunnar Björk. We thank Sky Frostenson for performing the diffraction measurements of the objects. O.N.’s participation was funded by the Austrian Science Foundation (FWF project number S65-04).
V Appendix 1: Image resolution
As discussed in Section II A, it is desirable to have a small beam waist in the region where the object is scanned, in order to obtain high spatial resolution. The diameter of a spot available from a lens is given by:
| (6) |
where is the focal length of the lens, is the wavelength of the light, is the diameter of the clear aperture at the lens, and is a numerical factor that depends on experimental conditions and whether the diameter under consideration is the full-width half-maximum (FWHM) or the Gaussian diameter (where the power has fallen to of the original value). For a lens imaging an unapertured Gaussian beam, the Gaussian diameter is given by . However, the output of our diode laser was not a clean Gaussian mode as it had internal structure (e.g. “picket fencing”). To reduce effects from this structure, the beam was expanded to mm diameter () and then a more spatially uniform subsection of the beam was selected with an iris (mm) placed before the imaging lens. Under these conditions, the beam input to the iris is approximately plane wave and the factor varies as a function of the truncation of the initial beam, :
| (7) |
where is the diameter of the input beam and is the physical diameter of the iris. To calculate FWHM diameters, the factor is given by [11]:
| (8) |
Taking the 5 mm iris diameter as the clear aperture of the lens, the 60 mm focal length lens and initial beam diameter of mm yield a factor . Thus the predicted minimum spot size for the system is m (FWHM), and the predicted minimum resolution (as defined by the Rayleigh criterion [11]) is m.
It is possible in principle to attain a smaller spot size by increasing the diameter of the iris. However, in practice this was limited by two experimental factors: the non-uniform beam and the angle-dependent cross-talk at the polarizing beam splitters. As mentioned above, the output beam from the diode laser contained spatial structure. If the beam was unapertured the diffraction of this structure meant that the achievable fringe visibility was quite low, %; by aperturing a uniform subsection of the beam the fringe visibility was improved to %. This aperturing was merely for the sake of convenience, and could have been avoided by a suitable mode cleaning system. However, the second effect could not have been so avoided. The cross-talk on the polarizing beam splitters is a minimum when the beam passing through the device is collimated. As the beam becomes strongly diverging or converging (as was the case in our experiment), the amount of cross-talk increases rapidly. This behavior occurs both for interface PBS’s (such as the cube PBS’s we used) and for bulk PBS’s (e.g. calcite prisms). Our aperture size of 5 mm was thus chosen to give an acceptable trade-off between imaging spot size and polarization cross-talk.
VI Appendix 2: Calculating from .
¿From the normalized transmission probability, , it is straightforward to calculate the expected interaction-free measurement probability, , as long as the reflectances (, ) of the interferometer are known. Consider inputting linearly polarized light (at ) to the polarizing Mach-Zehnder described in section II A. We use a Jones matrix description, where for example, light linearly polarized at an angle with respect to the vertical axis is described as
| (9) |
After passing through the interferometer the light is described by
| (10) |
where is the real part of the free-space transmittivity of the object, and is the phase shift that the light acquires in its passage through the object :
| (11) |
After passing through the analyzer at angle (), the probability of an interaction-free measurement, , is
| (16) | |||||
| (17) |
¿From this, and remembering that the effective reflectance of the first beamsplitter is , that the transmittance of the analyzer is , and that , we rewrite Eqn. 17:
| (18) | |||||
| (19) |
which relates to . For the case of 50/50 beamsplitters (i.e., input light polarized at ), this reduces to:
| (20) |
In this case, if the object is totally opaque, (), then , as expected. (And of course, if the object is absent then , , and .) Of course, in the EV scheme considered here, the probability of the object absorbing a photon is independent of the interference conditions, and in all cases is given by .
REFERENCES
- [1] See, for example, R. P. Feynman, R. B. Leighton, and M. Sands, The Feynman Lectures on Physics (Addison-Wesley Publishing Company, USA, 1977).
- [2] M. Renninger, “Messungen ohne Störung des Meßobjekts”. (“Measurement without disturbance of the measured objects”), Zeitschrift Physik 158, 417-420 (1960). This is written in German. For non-German speakers, a brief and clear discussion of this paper in English is given in: J. G. Cramer, “The transactional interpretation of quantum mechanics”, Rev. Mod. Phys. 58 (3), 647-688 (1986).
- [3] R. H. Dicke, “Interaction-free quantum measurements: A paradox?”, Am. J. Phys., 49 (10), 925-930 (1981).
- [4] A. C. Elitzur and L. Vaidman, “Quantum Mechanical Interaction-Free Measurements”, Found. Phys., 23 (7), 987-997 (1993).
- [5] There has been some controversy and misunderstanding concerning what is meant by “interaction” in the context of “interaction-free” measurements. In particular, we stress that there must be a coupling (interaction) term in any Hamiltonian description of the IFM system. For brevity’s sake, throughout the rest of this paper we omit the quotes from “interaction-free”, although, as we shall see, they are often justified.
- [6] P. G. Kwiat, H. Weinfurter, T. Herzog and A. Zeilinger, “Interaction-Free Measurement”, Phys. Rev. Lett. 74 (24), 4763-4766 (1995).
- [7] E. H. du Marchie van Voorthuysen, “Realization of an interaction-free measurement of the presence of an object in a light beam”, Am. J. Phys., 64 (12), 1504-1507 (1996).
- [8] H. Paul and M. Pavicic, “Nonclassical Interaction-Free Detection of Objects in a Monolithic Total-Internal-Reflection Resonator”, Journ. Opt. Soc. Am. B, 14 (6), 1275-1279 (1997).
- [9] P. G. Kwiat, “Experimental and Theoretical Progress in Interaction-free Measurements”, in: Proceedings of the Nobel Symposium (#104) on Modern Studies of Basic Quantum Concepts and Phenomena, Physica Scripta (to appear).
- [10] P. G. Kwiat, H. Weinfurter and A. Zeilinger, “Quantum Seeing in the Dark”, Sci. Am., 275 (5), 52-58 (1996).
- [11] Melles Griot 1995/96 Catalog, (Melles Griot USA, 1996), pp. 1-24 and 2-9.
- [12] A. E. Siegman, Lasers, (First Edition, University Science Books, USA, 1986).
- [13] P. G. Kwiat, H. Weinfurter and A. Zeilinger, “Interaction-free measurements of a quantum object: on the breeding of ‘Schrödinger cats’ ” in: Coherence and Quantum Optics VII, ed. Eberly, et al. (Plenum Press New York, pp. 673-674, 1996).
- [14] A. Karlsson, G. Bjork and E. Forsberg, “Interaction” (Energy Exchange) Free and Quantum Nondemolition Measurements”, Phys. Rev. Lett., 80 (6), 1198-1201 (1998)
- [15] A. G. White, D. F. V. James, and P. G. Kwiat, in preparation.
- [16] As can be seen from the scan of the thick optical fiber, imaging thick objects that can steer the light is non-trivial. Our current system is better suited to imaging thin objects where this does not occur to any great extent, such as some varieties of cells.
| Object | Width inferred | Width inferred from | Width measured | Width measured |
|---|---|---|---|---|
| from IFM scan | transmission scan | by microscope | via diffraction | |
| [m] | [m] | [m] | [m] | |
| thin metal | 95.3 | 96.6 | ||
| wire | ||||
| thick metal | 160.2 | 162.7 | ||
| wire | ||||
| cloth | 16.6 | 16.3 | ||
| filament | ||||
| human hair | 22.8 | 24.7 | ||
| thin optical | 125.7 | 123.9 | ||
| fiber | ||||
| thick optical | 208.0 | 207.5 | ||
| fiber | ||||
| slit | 12.5 | 13.1 | - |