FSUJ TPI QO-2/98
February, 1998
Homodyne measurement of exponential phase moments
for quantum-phase reconstruction
M. Dakna a, G. Breitenbach b,
J. Mlynek b,
T. Opatrný c, S. Schiller b, D.–G. Welsch a
a Friedrich-Schiller-Universität Jena,
Theoretisch-Physikalisches Institut,
Max-Wien-Platz 1, 07743 Jena, Germany
b Fakultät für Physik, Universität Konstanz, D-78457 Konstanz, Germany
c Palacký University, Department of Theoretical Physics,
Svobody 26, 77146 Olomouc, Czech Republic
Abstract
We directly sample the exponential moments of the canonical phase for various quantum states from the homodyne output. The method enables us to study the phase properties experimentally, without making the detour via reconstructing the density matrix or the Wigner function and calculating the phase statistics from them. In particular, combing the measurement with a measurement of the photon-number variance, we verify fundamental number–phase uncertainty.
Keywords: Direct sampling, exponential phase moments, number–phase uncertainty relations, canonical phase distribution.
Optical homodyne tomography has been a powerful method for quantum-state measurement, because the measured quadrature-component distributions contain all the information about the quantum state [ being the eigenstates of ]. In this way, the Wigner function [1] and the density matrix [2, 3, 4] can be inferred from experimental data. When the state (in a chosen representation) is known, then the mean values of arbitrary quantities can be calculated.
Each measurement is associated with errors (at least, the statistical error) which propagate in the calculation procedure. Hence, the error of a calculated quantity can be too large to be acceptable. For example, if we are interested in photon-number moments , we have to multiply the diagonal density-matrix elements by and perform the sum. Since the statistical error of does not vanish with increasing , the total error is infinite after summing all the terms. Truncation of the sum can avoid this trouble for sufficiently low-order moments, whereas for high-order moments also small values of with large may be essential. To overcome this problem, it has been suggested to sample the desired quantities directly from the measured data, without the detour via the density matrix (or other state representations). Formulas have been derived that are suited for direct sampling of normally ordered moments of photon creation and destruction operators [5], and an extension to arbitrary quantities that admit normal-order expansion has been given [6]. Quite recently sampling functions for measuring the exponential moments of the canonical phase have been derived [7].
In this paper we apply the sampling method to an experimental determination of the exponential moments of the canonical phase for various single-mode quantum states. The results are then used for determining the phase distribution as Fourier transform of the exponential phase moments. In particular, the sampled first exponential phase moment already defines a phase uncertainty [8, 9]. Using the (simultaneously) sampled photon-number variance a verification of the number–phase uncertainty predicted theoretically in [9] is given.
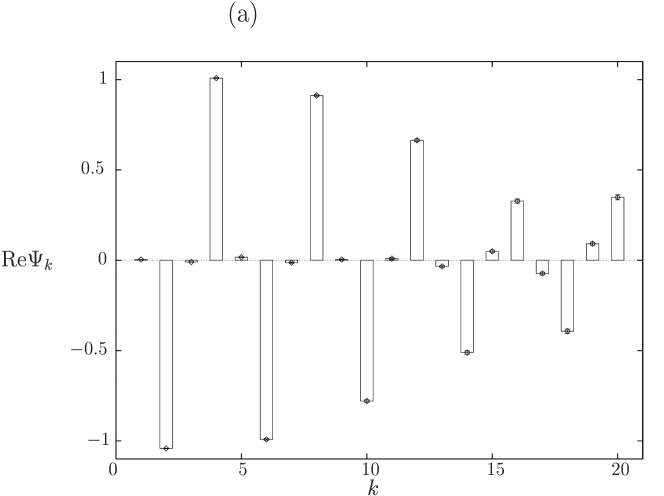
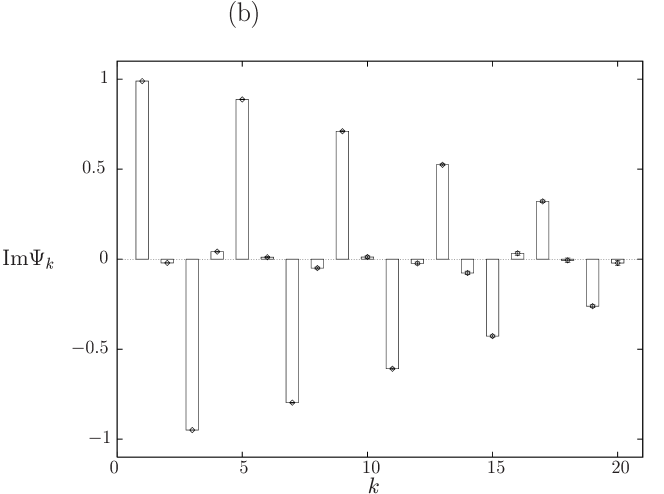
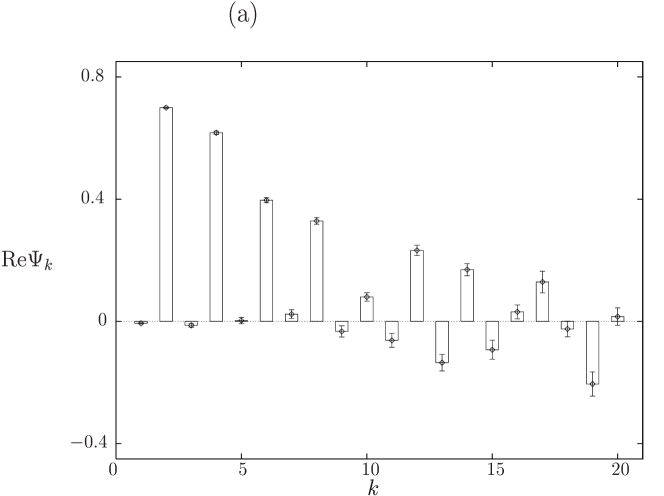
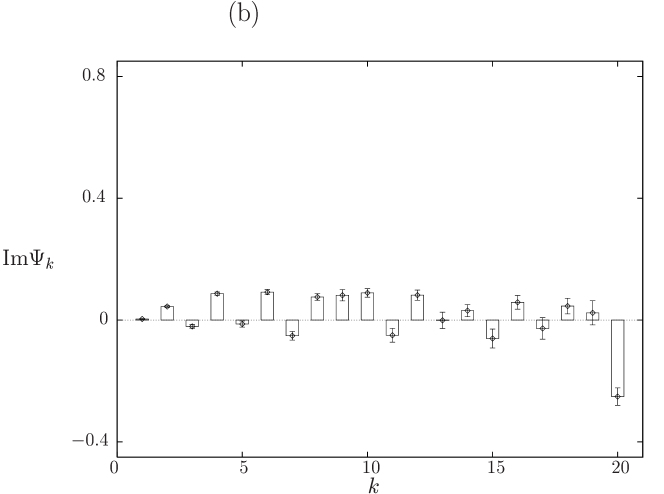
The exponential phase moments are defined by the Fourier components of the phase distribution , i.e., . For the canonical phase they are given by [10] if , and if , where , being the photon-number operator. It can be shown that can be obtained from the quadrature-component distributions as [7]
| (1) |
where is a well-behaved integral kernel suited for direct sampling of from the homodyne output for any normalizable quantum state.
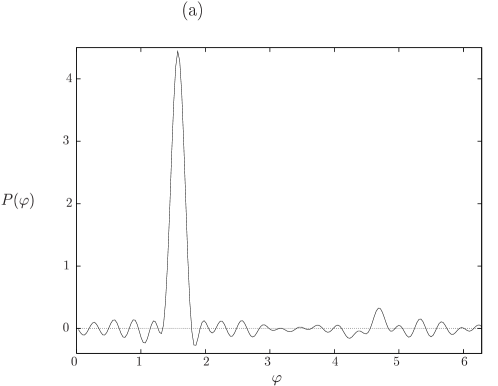
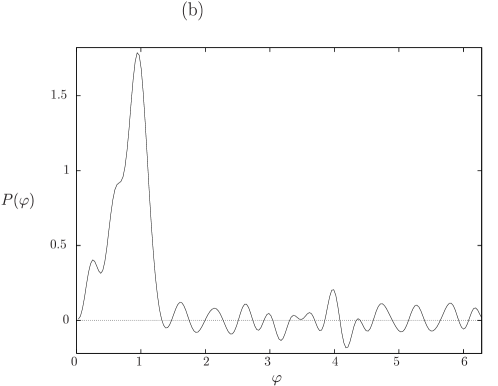
Knowing , the phase distribution can be obtained according to . However, the first moment already contains essential information about the phase properties. It can be used to introduce a mean phase and a phase uncertainty , which implies a number–phase uncertainty relation [9]
| (2) |
Note that for the number-uncertainty the quantities and can also be obtained by direct sampling according to a relation of the form (1), with the integral kernel being given in [5]. Hence, homodyne detection can be regarded as the most direct way that has been known so far for experimental verification of the uncertainty relation (2).
The experimental setup is the same as in [4]. Its central unit is a monolithic standing-wave lithium-niobate optical parametric amplifier (OPA) pumped by a frequency-doubled continuous-wave Nd:YAG laser ( nm). Operated below threshold, the OPA is a source of squeezed vacuum. We study the spectral components of the field around a frequency offset by or MHz from the optical frequency , to avoid low-frequency laser excess noise. To generate bright light, a very weak wave split off the main laser beam is phase-modulated by an electro-optic modulator (EOM) at the frequency and injected into the OPA through its high reflector port. The carrier frequency is kept on-resonance with the cavity and the two “bright” sidebands are well within the cavity bandwidth. By turning the modulation off, we obtain squeezed vacuum, by blocking the OPA pump wave, we are left with coherent excitations.
The signal is analyzed at a homodyne detector, whose output current is mixed with an electrical local oscillator phase-locked to the modulation frequency, low-pass filtered and recorded with a high speed A/D converter. Since the squeezed states are essentially two-mode states, a two-mode detection is crucial for obtaining the correct statistics of the light field. We remark however, that this type of measurement may need modifications for general states of the light field. The quadrature-component distributions are obtained by subdividing the recorded noise traces into 128 equal length intervals and subsequently forming histograms of 256 amplitude bins, normalizing the absolute bin width using as reference the distribution of a vacuum state.
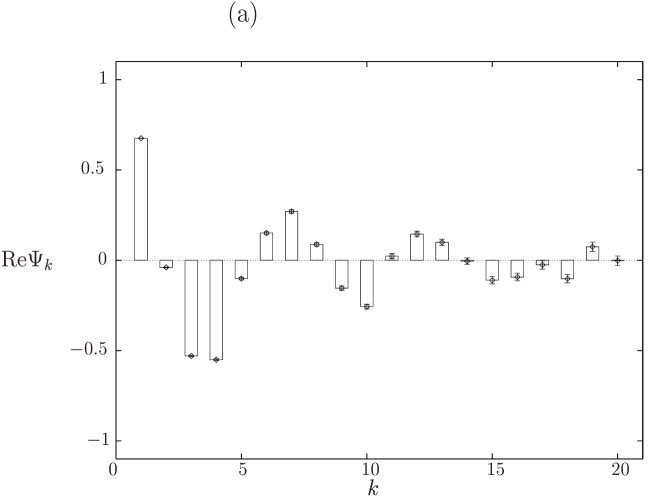
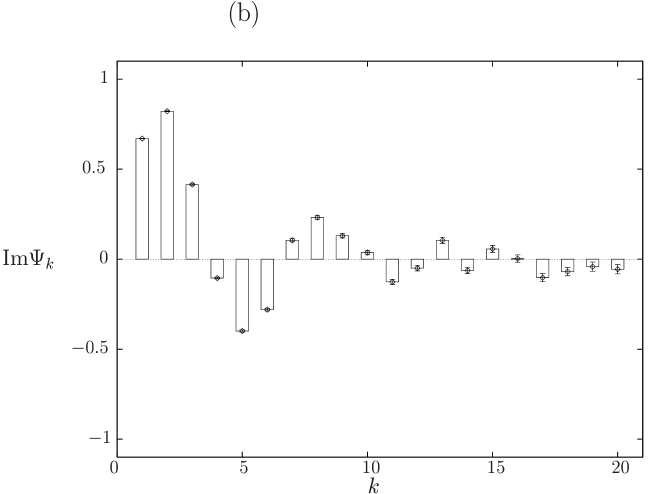
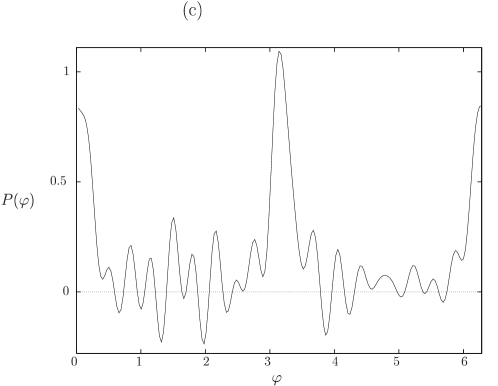
In Figs. 1–3, the sampled exponential phase moments , , are shown for a phase-squeezed state (Fig. 1), a state squeezed at a phase angle of (the difference between the argument of the squeezing parameter and the argument of the displacement parameter) and a squeezed vacuum (Fig. 3). The error bars indicate the statistical error. Since the main source of inaccuracy is the fluctuation of the local oscillator, the error is dominated by the systematic one. The canonical phase distributions obtained from the sampled moments (Fourier components) are plotted in Fig. 4. Since in Fig. 1 decreases with increasing slower than in Fig. 1, the phase distribution of the phase-squeezed state in Fig. 4(a) is more sharply peaked than that in Fig. 4(b). Figure. 4(c) clearly reveals the double-peak structure of the phase distribution of a squeezed vacuum. Note that the small oscillations in the figures (which also include negative values) mainly result from systematic errors.
Examples of and together with the measured mean photon number and photon-number uncertainty are given in Tab. 1 for various states prepared in the experiment. The last row shows the resulting values of the number–phase uncertainty product , which are in full agreement with the predicted inequality (2). The (near-)coherent states (A,B) and phase-squeezed states (E,F) are seen to exhibit relatively small phase uncertainties. Note that the coherent state (B) has the smallest phase uncertainty. Relatively large phase uncertainties are observed for the amplitude-squeezed states (C,D) and the state (H) squeezed at a phase angle of . As expected, the near-maximum phase uncertainty corresponds to the squeezed vacuum (G) (the “ellipse” in the phase space is centred at the origin). Therefore, for this state the uncertainty product tan achieves a very large value. The smallest value of the uncertainty product is observed for the coherent state (A). It is close to its limit 1/2. With respect to the photon number, the amplitude-squeezed state (C) is seen to be sub-Poissonian.
In summary, we have sampled the exponential moments of the canonical phase directly from the homodyne output for various coherent and squeezed states produced in a continuous optical field by means of parametric amplification. This has enabled us to study the canonical phase statistics experimentally, without the necessity of state reconstruction, which saves calculation effort and reduces the statistical error. In particular, from the sampled first-order exponential phase moment and the simultaneously sampled first- and second order photon-number moments we have determined phase and number uncertainties and shown that the uncertainty products are in agreement with the theoretical prediction.
This work was supported by the Deutsche Forschungsgemeinschaft.
References
- [1] K. Vogel and H. Risken, Phys. Rev. A 40 (1989) 2847; D.T. Smithey, M. Beck, M.G. Raymer and A. Faridani, Phys. Rev. Lett. 70 (1993) 1244; D.T. Smithey, M. Beck, J. Cooper, M.G. Raymer and A. Faridani, Phys. Scripta T 48 (1993) 35; G. Breitenbach, T. Müller, S. Pereira, J.-P. Poizat, S. Schiller und J. Mlynek, J. Opt. Soc. Am. B 12 (1995) 2304.
- [2] H. Kühn, D.–G. Welsch and W. Vogel, J. Mod. Opt. 41 (1994) 1607; A. Zucchetti, W. Vogel, M. Tasch and D.–G. Welsch, Phys. Rev. A 50 (1994) 4298; G.M. D’Ariano, C. Macchiavello and M.G.A. Paris, Phys. Rev. A 54 (1996) 1678; U. Leonhardt, H. Paul and G.M. D’Ariano, Phys. Rev. A 52 (1995) 4899; M. Munroe, D. Boggavarapu, M.E. Anderson and M.G. Raymer, Phys. Rev. A 52 (1995) R924; U. Leonhardt, M. Munroe, T. Kiss, Th. Richter and M.G. Raymer, Optics. Comm. 127 (1996) 144; Th. Richter, Phys. Lett. 211 A (1996) 327.
- [3] S. Schiller, G. Breitenbach, S.F. Pereira, T. Müller and J. Mlynek, Phys. Rev. Lett. 77 (1996) 2933.
- [4] G. Breitenbach, S. Schiller and J. Mlynek, Nature, 387 (1997) 471; G. Breitenbach and S. Schiller, J. Mod. Opt. 44 (1997) 2207.
- [5] Th. Richter, Phys. Rev. A 53 (1996) 1197 .
- [6] G.M. D’Ariano, in Quantum Communication, Computing and Measurement, edited by O. Hirota, A.S. Holevo and C.M. Caves (Plenum, 1997), p. 253.
- [7] T. Opatrný, M. Dakna and D.–G. Welsch, Proc. 5th International Conference on Squeezed States and Uncertainty Relations, Balatonfüred, 1997, to be published; Phys. Rev. A., to be published; M. Dakna, T. Opatrný and D.–G. Welsch, Opt. Commun., to be published.
- [8] A. Bandilla and H. Paul, Ann. Phys. (Leipzig) 23 (1969) 323.
- [9] A.S. Holevo, Probabilistic and statistical aspects of quantum theory (North-Holland, Amsterdam, 1982); A.S. Holevo, in Quantum Probability and Applications to the Quantum Theory of Irreversible Processes, edited by L. Accardi, A. Frigerio, and V. Gorini, Springer Lect. Notes Math. Vol. 1055 (Springer-Verlag, Berlin, 1984), p. 153; T. Opatrný, J. Phys. A 27 (1994)7021; J. Phys. A 28 (1995) 6961.
- [10] R. London, Z. Phys. 37 (1926) 915; ibid. 40 (1927) 193; L. Susskind and J. Glogower, Physics 1 (1964) 49; P. Carruthers and M.M. Nieto, Rev. Mod. Phys. 40 (1968) 411.
![[Uncaptioned image]](/html/quant-ph/9802023/assets/x1.png)