Producing and Detecting Correlated Atoms
Abstract
We discuss experiments to produce and detect atom correlations in a degenerate or nearly degenerate gas of neutral atoms. First we treat the atomic analog of the celebrated Hanbury Brown Twiss experiment, in which atom correlations result simply from interference effects without any atom interactions. We have performed this experiment for both bosons and fermions. Next we show how atom interactions produce correlated atoms using the atomic analog of spontaneous four-wave mixing. Finally, we briefly mention experiments on a one dimensional gas on an atom chip in which correlation effects due to both interference and interactions have been observed.
Keywords:
atom interferometry, atom correlations, Hanbury Brown Twiss effect:
03.75.Dg, 03.75.Ss1 Introduction
Recent years have seen a blossoming in the use of experimental techniques sensitive to atom correlation in the study of ultra-cold atomic gases. After a pioneering experiment in 1996 Yasuda and Shimizu (1996), in which the atomic Hanbury Brown Twiss (HBT) experiment was first observed, there were many analyses and proposed extensions to other situations Naraschewski and Glauber (1999); Cahill and Glauber (1999); Grondalski et al. (1999); Altman et al. (2004). In the past two years several experimental realizations have been reported Fölling et al. (2005); Öttl et al. (2005); Greiner et al. (2005); Schellekens et al. (2005); Estève et al. (2006). At the same time, the theoretical community has shown much interest in correlated pairs of atoms, either from collisions or from the breakup of moleculesDuan et al. (2000); Moore and Meystre (2000); Zin et al. (2006); Norrie et al. (2006); Kheruntsyan (2005); Deuar and Drummond (2006). Here again, the year 2005 saw the report of an experimental realization. In this paper we will discuss some new experiments concerning atom correlations. We refer the reader to the contribution of I. Bloch in this volume for additional ones. All this activity promises to provide much new information about the behavior of cold quantum gases, but we also emphasize that in the field of nuclear and particle physics, Hanbury Brown Twiss correlations are a well established experimental technique and we recomend Ref. Boal et al. (1990) for a review.
2 The atomic Hanbury Brown Twiss experiment
2.1 Intuitive picture
At this conference, the contributions of R. Glauber and that of E. Demler discuss the theoretical interpretation of the correlation experiments. Here we will give a less general but intuitive point of view due to Fano Fano (1961). The HBT effect necessarily involves the detection of two particles at different space-time points. Thus one is led to consider, two source points, A and B, which emit particles detected at two detection points, and . One must consider the quantum mechanical amplitude for the process ( and ) as well as that for ( and ). If the two processes are indistinguishable, the amplitudes interfere. For bosons, the interference is constructive resulting in a joint detection probability which is enhanced compared to that of two statistically independent detection events, while for fermions the joint probability is lowered. For a detector separation larger than the aperture which would permit the resolution of the structure of the source, the average over different points in the source washes out the interference and one recovers the situation for uncorrelated particles.
In the case of a chaotic source of light the correlations are also easily understood in terms of speckle, without reference to the concept of photons. But, as in optics with light, we are capable of producing sources for which a classical analysis is not adequate. The experiment discussed below using fermions is an example. The idea of speckle can still be useful however, because it reminds us that these experiments can be analyzed from the point of view of noise or fluctuation phenomena.
2.2 Experiment with bosons
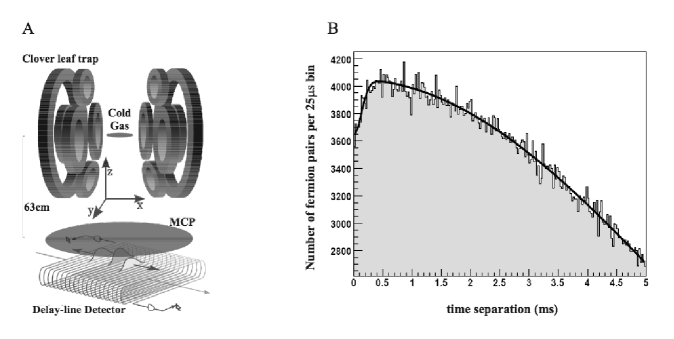
The detection of HBT correlations has presented a significant experimental challenge, because the correlation is only maximal if the two detectors occupy the same volume in phase space. In other words, the correlation length, where is the size of the source and is the time of flight to the detectorViana Gomes et al. (2006), is generally quite small. In addition, the signal to noise ratio in the experiment is proportional to the phase space density of the source. Thus, the detailed study of the HBT effect was greatly facilitated by the advent of degenerate quantum gases. Figure 1 shows our detector. A micro-channel plate (MCP) amplifies the electron ejected upon impact by a metastable helium atom (20 eV internal energy). The charge pulse is recorded with ns time resolution and in the horizontal plane a delay line anode and timing electronics provides position resolution111Available from Roentdek http://www.roendtek.com. Our time to digital converter is manufactured by ISITech http://www.opticsvalley.org/data/isitech.pdf. Although the detector actually measures arrival times, we conventionally convert the arrival time into a vertical position by multiplying by the velocity at arrival at the detector. This velocity has a spread of less than 1% over the atomic sample.
In the spring of 2005, we successfully used this detector to observe the HBT effect using an evaporatively cooled sample of 4HeSchellekens et al. (2005); Westbrook et al. (2005). We refer the reader to those papers for more information. The shape, width and height of the correlation signal can be quantitavely understood by a simple ideal gas treatment of the atoms.
2.3 Experiment with fermions
Only weeks before the ICAP2006 conference, the metastable helium groups in Orsay and in Amsterdam began a collaboration to observe the analagous effect with the fermionic isotope 3He. Instead of a bump, we expect a dip. The Amsterdam group had already demonstrated the production of a degenerate gas of 3He McNamara et al. (2006), and the setup was sufficiently similar to the one in Orsay that it was possible to install the Orsay detector in the Amsterdam apparatus with some minor modifications to the vacuum system. It took only two weeks of (albeit intense) work to see an unambiguous anti-bunching signal. One of the first of these is shown in Fig. 1. Unlike the published boson data, the data shown are not normalized. Thus one sees a broad structure in the peak corresponding to the Gaussian shape of the cloud as it arrives at the detector (or more precisely its auto-convolution). The anti-bunching signal is the small dip for pair separations below 1 ms. At this writing, quantitative analysis of these data is still in progress, but roughly speaking, the antibunching signal corresponds closely to our expectations. Under identical conditions, the width and amplitude of the signal for bosons and fermions are of similar magnitude.
3 Observation of correlated atom pairs
Interactions between atoms also produce correlated atoms. The correlations are particularly simple for elastic collisions, and obviously the study of collision products has occupied much of atomic, nuclear and particle physics for the last century. The collisions we study here however are a little different because the source is a Bose-Einstein condensate (BEC), and therefore approximates a ”single mode” source. Thus, analogies with four-wave mixing are very apt. Indeed stimulated four wave mixing using BEC’s has already been observedDeng et al. (1999); Vogels et al. (2002). Collisions between BEC’s have also been studied by two other groupsBuggle et al. (2004); Thomas et al. (2004). In these experiments collision velocities were sufficiently high that not only s-waves but also d-waves were involved. The experiments we describe here are limited to the s-wave regime.
The point of departure for the experiment is the Orsay apparatus used in the HBT experiment described above. To this apparatus we have added two more laser beams to drive stimulated Raman transitions between the trapped () and field insensitive () states of the energy level. The quantization axis is defined by the magnetic field which is along the x-axis. The two lasers are detuned by 400 MHz from the - transition and have a relative detuning of about 600 kHz in order to be in Raman resonance for atoms in the bias field of the magnetic trap. The laser beams propagate at small angles to the and axes of Fig. 1 and thus a momentum transfer of , where is a unit vector along the x-axis, accompanies the Raman transition. The beam along the -axis is retro-reflected resulting in a second possible Raman transition with a momentum transfer of .
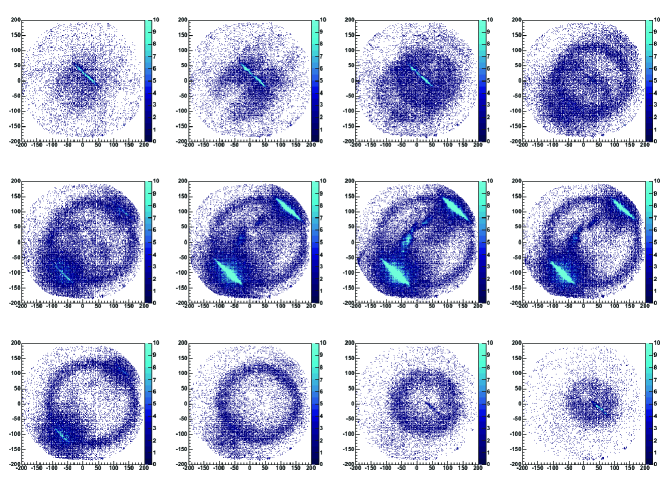
Most of the atoms are transfered to the state with one of the two possible momentum components. These atoms collide with a relative velocity of twice the recoil velocity and, in the absence of gravity, would be scattered into a spherical shell whose radius is where is the time after the collision. In the presence of gravity, the kinematics are the same except that the spherical shell accelerates downward. Atoms which are not transferred to the state remain in the trap. Figure 2 shows some data taken with the delay line detector under these conditions. The figure shows successive slices of the three-dimensional reconstruction of the atoms’ positions. The sphere into which the atoms are scattered, as well as the two colliding clouds are clearly visible. Less than 10% of the atoms are scattered from the colliding clouds.
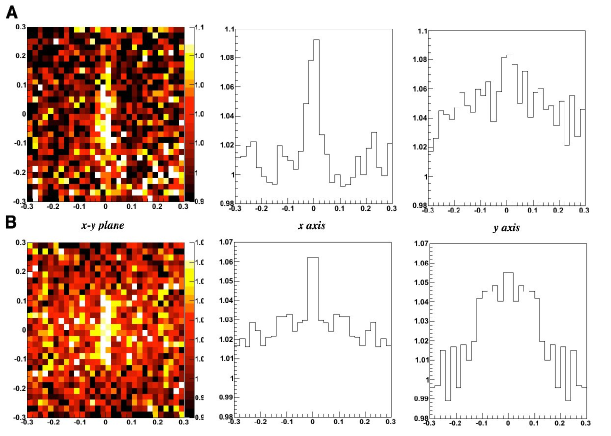
The correlations on the sphere are shown in Fig. 3. We see a correlation signal both for pairs of opposite momenta in the center of mass frame, as well as for pairs with the same momentum . The latter effect is simply another manifestation of the HBT effectZin et al. (2006); Deuar and Drummond (2006) and may prove useful because it allows us to characterize the size of the source. The size of signal for opposite momenta can in principle be many times the background level. Its small size here appears to be due to a rather poor quantum efficiency of the detector (on the order of 5% averaged over the detector). The width of the anti-colinear correlation peak is clearly larger than the colinear peak. We believe that its width is partly due to the mean field energy acquired by the atoms during their expansionZin et al. (2006); Norrie et al. (2005); Kheruntsyan (2005); Deuar and Drummond (2006). A quantitative study of the width and the detector quantum efficiency is in progress.
4 Correlations on an atom chip
As has been shown in other recent experiments, single atom counting is not necessary to observe atom correlation effects. Absorptive imaging, when performed in sufficiently low noise conditions can also be sensitive to atom number or atom density fluctuationsAltman et al. (2004); Fölling et al. (2005); Greiner et al. (2005). Inspired by these experiments, we have also examined number fluctuations in a nearly one dimensional gas on an atom chip. A difficulty in absorption imaging is the fact that the necessary integration over one direction can average out the desired signal. The one dimensional geometry is particularly favorable in this respect because this integration can be avoided. Atom chips are also advantageous for this sort of study because they permit the use of a compact, and mechanically stable apparatus. In our experiment we had little difficulty in taking images at the photon shot-noise limit. Multiple averages (several hundreds) of these images permitted an accurate subtraction of the photon shot-noise to reveal the atom number fluctuationsEstève et al. (2006).
In spite of the fact that the resolution of our imaging system was significantly larger than the correlation length of the sample, these measurements had two new features. First, the fluctuations were observed without releasing the atoms from the trap. They were thus sensitive to correlations in position rather than momentum. Second, and more importantly, we were able to identify a regime of high density in which interactions between the atoms suppressed the fluctuations which would be expected for a non-interacting gas. A careful analysis of the density profile of such a gas also reveals that the profile cannot be explained by a Hartree-Fock calculation that neglects correlations between the particles Trebbia et al. (2006). Improved calculations, including correlation effects promise to give a better account of the observations Blakie and Davis (2005); Proukakis (2006).
We hope that the experiments discussed above have given a taste of the rich possibilities in correlation measurements. The main conclusion with which we would like to leave the reader is that, in the field of degenerate quantum gases, treating correlations between particles remains an important challenge. But our increasingly sophisticated experimental techniques are beginning provide a window on these phenomena, and we can expect great progress in the near future.
References
- Yasuda and Shimizu (1996) M. Yasuda, and F. Shimizu, Phys. Rev. Lett. 77, 3090–3093 (1996).
- Naraschewski and Glauber (1999) M. Naraschewski, and R. J. Glauber, Phys. Rev. A 59, 4595–4607 (1999).
- Cahill and Glauber (1999) K. E. Cahill, and R. J. Glauber, Phys. Rev. A 59, 1538–1555 (1999).
- Grondalski et al. (1999) J. Grondalski, P. M. Alsing, and I. M. Deutsch, Optics Express 5, 249 (1999).
- Altman et al. (2004) E. Altman, E. Demler, and M. D. Lukin, Phys. Rev. A 70, 013603 (2004).
- Fölling et al. (2005) S. Fölling, F. Gerbier, A. Widera, O. Mandel, T. Gerike, and I. Bloch, Nature 434, 481–484 (2005).
- Öttl et al. (2005) A. Öttl, S. Ritter, M. Köhl, and T. Esslinger, Phys. Rev. Lett. 95, 090404 (2005).
- Greiner et al. (2005) M. Greiner, C. A. Regal, J. T. Stewart, and D. S. Jin, Phys. Rev. Lett. 94, 110401 (2005).
- Schellekens et al. (2005) M. Schellekens, R. Hoppeler, A. Perrin, J. Viana Gomes, D. Boiron, A. Aspect, and C. I. Westbrook, Science 310, 648–651 (2005).
- Estève et al. (2006) J. Estève, J.-B. Trebbia, T. Schumm, A. Aspect, C. I. Westbrook, and I. Bouchoule, Phys. Rev. Lett. 96, 130403 (2006).
- Duan et al. (2000) L.-M. Duan, A. Sørensen, J. I. Cirac, and P. Zoller, Phys. Rev. Lett. 85, 3991–3994 (2000).
- Moore and Meystre (2000) M. G. Moore, and P. Meystre, Phys. Rev. Lett. 85, 5026–5029 (2000).
- Zin et al. (2006) P. Zin, J. Chwedenczuk, and M. Trippenbach, Phys. Rev. A 73, 033602 (2006).
- Norrie et al. (2006) A. A. Norrie, R. J. Ballagh, and C. W. Gardiner, Phys. Rev. A 73, 043617 (2006).
- Kheruntsyan (2005) K. V. Kheruntsyan, Phys. Rev. A 71, 053609 (2005).
- Deuar and Drummond (2006) P. Deuar, and P. Drummond, arXiv e-print (2006), URL http://fr.arxiv.org/abs/cond-mat/0607831.
- Boal et al. (1990) D. H. Boal, C.-K. Gelbke, and B. K. Jennings, Rev. Mod. Phys. 62, 553–602 (1990).
- Fano (1961) U. Fano, Amer. J. Phys. 29, 539 (1961).
- Viana Gomes et al. (2006) J. Viana Gomes, A. Perrin, M. Schellekens, D. Boiron, C. I. Westbrook, and M. Belsley, arXiv e-print (2006), URL http://fr.arxiv.org/abs/quant-ph/0606147.
- Westbrook et al. (2005) C. I. Westbrook, M. Schellekens, R. Hoppeler, A. Perrin, J. Viana Gomes, D. Boiron, and A. Aspect, “The Hanbury Brown Twiss effect for atoms,” in Laser Spectroscopy, edited by E. Hinds, A. Ferguson, and E. Riis, World Scientific, Singapore, 2005, p. 8.
- McNamara et al. (2006) J. M. McNamara, T. Jeltes, A. S. Tychkov, W. Hogervorst, and W. Vassen, Phys. Rev. Lett. 97, 080404 (2006).
- Deng et al. (1999) L. Deng, E. W. Hagley, J. Wen, M. Trippenbach, Y. Band, P. S. Julienne, J. E. Simsarian, K. Helmerson, S. L. Rolston, and W. D. Phillips, Nature 398, 218–220 (1999).
- Vogels et al. (2002) J. M. Vogels, K. Xu, and W. Ketterle, Phys. Rev. Lett. 89, 020401 (2002).
- Buggle et al. (2004) C. Buggle, J. Leonard, W. von Klitzing, and J. T. M. Walraven, Phys. Rev. Lett. 93, 173202 (2004).
- Thomas et al. (2004) N. R. Thomas, N. Kjærgaard, P. S. Julienne, and A. C. Wilson, Phys. Rev. Lett. 93, 173201 (2004).
- Norrie et al. (2005) A. A. Norrie, R. J. Ballagh, and C. W. Gardiner, Phys. Rev. Lett. 94, 040401 (2005).
- Trebbia et al. (2006) J.-B. Trebbia, J. Estève, C. I. Westbrook, and I. Bouchoule, arXiv e-print (2006), URL http://fr.arxiv.org/abs/quant-ph/0606247.
- Blakie and Davis (2005) P. B. Blakie, and M. J. Davis, Phys. Rev. A 72, 063608 (2005).
- Proukakis (2006) N. P. Proukakis, Phys. Rev. A 73, 023605 (2006).