Long-Term Stability of an Area-Reversible Atom-Interferometer Sagnac Gyroscope
Abstract
We report on a study of the long-term stability and absolute accuracy of an atom interferometer gyroscope. This study included the implementation of an electro-optical technique to reverse the vector area of the interferometer for reduced systematics and a careful study of systematic phase shifts. Our data strongly suggests that drifts less than 96 deg/hr are possible after empirically removing shifts due to measured changes in temperature, laser intensity, and several other experimental parameters.
pacs:
06.30.Gv, 03.75.Dg, 32.80.Lg, 39.20.+qA Sagnac gyroscope measures rotation through an induced phase shift, known as the Sagnac phase, between the two arms of an interferometer. In recent years Sagnac gyroscopes have demonstrated extraordinary sensitivity Gustavson00rs ; Rowe99da ; Dunn02da . In addition to sensitivity, however, many applications, including inertial navigation and tests of general relativity, require an instrument with high accuracy or excellent long-term stability Schiff60pn . In this paper we report on a study of the long-term performance of an atom interferometer gyroscope. As part of this study we implemented a method to periodically reverse the vector area of the interferometer loop, a technique which has already proven useful in atom interferometer accelerometers Snadden98mo . This reversal causes the sign of the Sagnac phase to change, allowing systematics which do not change sign with the reversal to be cancelled.
The apparatus has been described previously Gustavson00rs ; Gustavson00thesis . Experimental details are summarized here. A pair of counter-propagating cesium atomic beams run the length of the apparatus. The atoms are generated thermally and have a characteristic velocity of 220 m/s (determined from the Sagnac phase induced by Earth rotation and by time-of-flight measurements). The atoms are collimated by narrow tubes, transversely laser cooled, and then optically pumped into the hyperfine ground state. They then interact with three pairs of counter-propagating laser beams traveling perpendicular to the atomic beams. The three interaction regions are spaced by 0.968 m, for a total length from the center of the first to the center of the last beam pair of 1.936 m. The counter-propagating laser beams drive stimulated Raman transitions between the , and the , cesium ground-state hyperfine levels. Laser polarization and a magnetic bias field suppress transitions between other magnetic sub-levels. For the studies reported here the two Raman lasers were tuned about 850 MHz below the and to transitions. This combination of parameters results in a Sagnac phase of 9.1 radians for a rotation rate equal to Earth rotation ( deg/hr).
Each Raman transition involves the absorption of a photon from one laser beam and the stimulated emission of a photon into the counter-propagating beam, giving the atom two photon recoils of transverse momentum. As a result, the Raman lasers act as atom “mirrors” and “beamsplitters” to spatially split and then coherently recombine the beam of atoms. In the language of Ramsey interferometry the laser fields form a pulse sequence. The first pulse places the atoms into an equal superposition of and states and gives the component two photon recoils of momentum. Next the pulse swaps the internal energy and external momentum states of the two halves of the atom wave. This causes their paths to cross at the final pulse which mixes them and causes them to interfere. The atoms are then probed by resonant fluorescence to determine the final population in the state. From this measurement the interferometer phase, and thereby the rotation rate of the apparatus, is determined.
To implement the area reversal we modified our previous method of generating the two Raman laser frequencies Bouyer96ms . In our current scheme, the +1 and -1 diffraction orders of a master laser passing through a high frequency acousto-optic modulator (AOM) are used to inject two slave diode lasers. The AOM’s frequency is set such that the slave lasers differ in frequency by the cesium hyperfine ground state splitting plus or minus a small (5 MHz) detuning. The 5 MHz detuning from the two-photon resonance prevents the co-propagating light frequencies from driving recoil-free Raman transitions. The beams from the two slave lasers are coupled into a common fiber which delivers the light to the interferometer. The beam is then split into three “Raman” beams: two of equal intensity plus a third beam at twice this intensity. These beams are used to generate the and pulses.
The sign of the 5 MHz detuning determines the direction of the interferometer’s vector area. Each Raman beam passes through the atomic beam in one of the three interaction regions. After passing once through the atomic beam, each Raman beam is sent through a pair of AOMs and then retro-reflected back through the AOMs and the atomic beam. The double pass through the AOMs results in a frequency upshift of 5 MHz. This causes one of the incoming light frequencies to form a two-photon resonance with one of the retro-reflected frequencies. Changing the sign of the 5 MHz detuning switches which frequency components of the direct and retro-reflected light are involved in the transition. This causes the atoms to recoil in the opposite direction, reversing the interferometer’s area. This electro-optic area reversal method is extremely clean, producing a precise reversal and exceptional cancellation of numerous systematic errors which change sign relative to the Sagnac phase with the reversal.
All of the data we present was taken utilizing the counter-propagating atomic beam and electro-optically applied rotation bias methods described in Gustavson00rs , allowing us to cancel linear acceleration shifts and the Sagnac phase due to the Earth’s rotation. The ability to bias our instrument near zero rotation is an uncommon feature in Sagnac interferometers. Laser gyros typically require a rotation bias to prevent backscatter-related frequency pulling and mode locking Stedman97rl . Working near zero bias makes the interferometer insensitive to many sources of instability and increases the fringe contrast for improved signal-to-noise ratios. In this mode of operation the instrument’s rotation rate can be obtained by subtracting the electro-optically applied rotation bias from the interferometrically measured rotation rate.
To study long-term stability we took several sets of data, each of which span a period of about two and a half days. A typical data set is shown in Fig. 1. Although this data set exhibits more long-term drift than some of our other sets, it demonstrates the cancellation of systematic drifts that can result from area reversal. This figure presents raw data, corrected only by the removal of a calibrated, independently-measured phase-shift due to drifts in Raman laser intensity. The strong anti-correlation of the two configurations seen in this figure, and the much lower drift in the average phase relative to either configuration, demonstrates the utility of area reversal for increased stability.
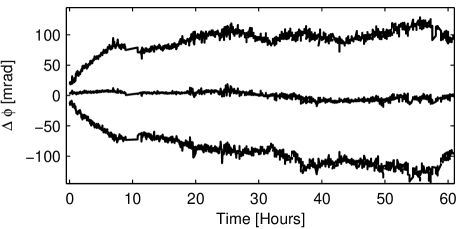
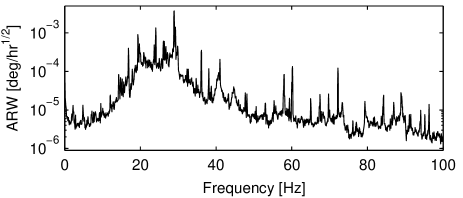
Figure 1 shows high-frequency noise on top of slow drifts. The high-frequency noise is due to mechanical noise in the building. For measurements of long-term stability we placed the interferometer directly on the lab floor to reduce measurement errors due to slow drift in the position of the device. Although this results in efficient coupling of our apparatus to the high-frequency mechanical noise present in the room, for these studies we were not concerned with high-frequency noise which quickly averages away. This noise has been well characterized with high-speed measurements of the Sagnac phase of our instrument. The rotational noise, shown in Fig. 2, hits a baseline angle random walk (ARW) of a few times deg/hr1/2 at frequencies from 2 to 7 Hz.
Several of our data sets showed considerably less low-frequency drift than the data shown in Fig. 1 due to lower environmental noise in the lab during these runs. One of these data sets is shown in Fig. 3(a). The Allan variance of the raw data in this figure, shown in Fig. 3(c), bottoms out at a measurement time of about 18 minutes. Using the methods described in Ng97co we calculate a bias stability of 560 deg/hr for this data set. This is considerably smaller than what is found from the data in Fig. 1, which bottoms out at 1.1 mdeg/hr at a measurement time of about an hour.
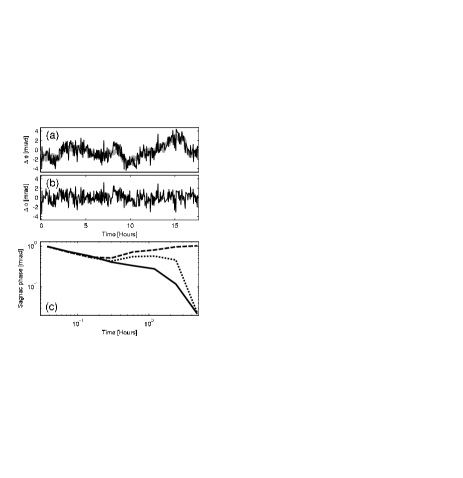
The stability of most gyroscopes is improved considerably by removing known correlations in the rotation signal with other measured parameters such as the temperature of the apparatus. In each experiment we measured auxiliary parameters, including laser pointing and intensity and temperatures around the apparatus. In quiet data sets the long-term drift shows strong correlation with several of these parameters. A simple linear correction, in which a subset of these quantities were each multiplied by a constant and subtracted from the Sagnac phase at every point in time, considerably reduced drift. The effect is shown in Fig. 3(a) and (b). The Allan deviation is plotted in Fig. 3(c).
The Allan deviation in Fig. 3(c) shows that the corrected signal’s long-term stability is limited not by systematic error but by random noise, even for the maximum measurement time of 4.7 hours. Because the last few points in the Allan variance involve only a statistically small number of clusters of data Ng97co , rather than use the minimum Allan deviation of 22 rad, we calculated a more conservative estimate of the bias stability of the corrected data by extrapolating out to 4.7 hours the behavior present in Fig. 3(c) up to measurement times of about 1 hour. This yields a minimum deviation of 88 rad corresponding to a bias stability of 96 deg/hr. The character of the Allan variance strongly suggests that the inherent long-term drift of the apparatus could be less than this and implies a scale factor drift of less than 7 parts per million.
In addition to stability tests, we have also re-examined systematics in the context of area reversal Gustavson00rs ; Gustavson00thesis . Below we discuss only the dominant sources. A detailed discussion of the theory can be found in Bongs05ho .
One significant error results from a % difference in the magnetic bias field between the two halves of the apparatus. The resulting quadratic Zeeman shift systematic is shown in Fig. 4(a). Area reversal nearly cancels this shift, leaving a residual shift of less than 0.1% of .
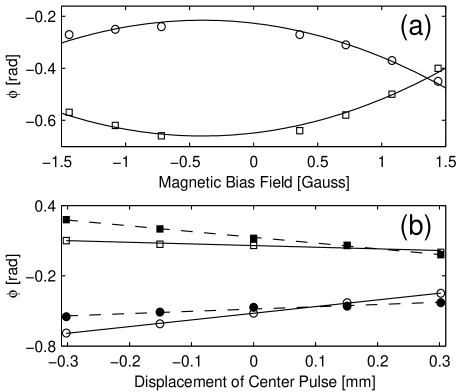
Another significant systematic phase shift occurs if the pulse is not exactly centered between the pulses. Assuming that gravity is nearly perpendicular to the plane defined by the interferometer and that the atomic beam is nearly perpendicular to the Raman beams, to lowest order this interferometer phase shift is given by
| (1) |
Here is the effective two-photon wave vector for the Raman beams (defined such that the two-photon momentum kick the atom receives is given by ) and is the distance between pulses. The parameters and are the effective velocity of the atomic beam and the atomic mass, and and are the rotation rate and acceleration (gravity) present on the apparatus. The displacement of the pulse from the center of the interferometer is represented by . The first term in Eq. 1 is cancelled by area reversal. Given our ability to center the pulse, this term can account for most of the difference between the reversed and non-reversed phase near zero field in Fig. 4(a). The second term (a combination of and a non-zero transverse atom velocity), and the last two terms (resulting from a combination of inertial forces and unbalanced lengths), are not cancelled by area reversal. We studied these systematics by varying the pulse spacing. From the results, shown in Fig. 4(b), we conclude that they contribute an error of less than 1% of .
Systematics due to horizontal Raman beam misalignment should be negligible; we use observed Doppler shifts in individual interaction regions for precision horizontal alignment. Vertical misalignments, however, may contribute significant shifts. Tilting the plane of the interferometer introduces a phase shift due to gravity. This shift is cancelled using counter-propagating atom beams Gustavson00rs ; Gustavson00thesis . Deviation of the beams from the plane defined by the atomic beam and the beam results in a gravitational shift which is not cancelled by counter-propagating atom beams or with area reversal. A related shift of the same magnitude results from a combination of vertical Raman beam misalignment and a non-zero vertical component of an atom’s velocity. Intentionally walking the vertical Raman beam alignment we could only change the measured rotation rate by 7% of before signal contrast was reduced significantly. When aligned for maximal contrast this systematic should be below 2% of .
Drift in Raman laser intensities introduce additional phase shifts. The two Raman laser intensities are chosen to minimize the differential ac-Stark shift between the and hyperfine ground-states. Because both interferometer paths experience nearly equal ac-Stark shifts, and since Stark shifts can be cancelled using counter-propagating atomic beams, Stark effects should not be significant Weiss94pm ; Gustavson00rs . But because the pulse area received by an atom with a given velocity depends on the intensities of the Raman beams, the laser intensity determines which velocities result in highest fringe contrast and contribute most to the interferometer signal. Since the Sagnac phase at a given rotation rate depends on velocity, we still observe changes in phase when the intensities of the Raman beams are varied.
Area reversal reduces intensity-dependent shifts by an order of magnitude. Incomplete cancellation is due in part to an imperfect implementation of area reversal; a difference in the detuning from the single photon resonance for the two configurations and imperfect AOM efficiency in the retro-reflections results in slightly different pulse areas and ac-Stark shifts for the non-reversed and reversed configurations. Although it is possible to improve the implementation, these shifts are not a dominant source of instability. The difference in Sagnac phase for the two areas at a given rotation rate is well below 1%. And since we typically add a rotation bias to keep the Sagnac phase small, effects related to the atomic beam velocity which scale the Sagnac phase without adding an independent bias phase are greatly reduced.
In conclusion, we have implemented a method of reversing the vector area of the interferometer to reduce systematic drifts and have completed a study of the long-term behavior of our gyroscope. Removing correlations with auxiliary parameters reveals that the intrinsic stability of our gyroscope is probably less than 96 deg/hr (this upper value limited by statistical white noise) with a scale factor stability better than 7 parts per million. We also completed an analysis of the dominant systematics present in our apparatus and determined that the absolute accuracy is better than a few percent of Earth rotation.
We acknowledge helpful discussions with J.M. McGuirk, J.B. Fixler, G.T. Foster and G. Nogues. This work was supported by the National Science Foundation, the Office of Naval Research, and NASA.
References
- (1) T. L. Gustavson, A. Landragin, M. A. Kasevich, Class. Quantum Grav., 17, 2385-2398 (2000).
- (2) C. H. Rowe, U. K. Schreiber, S. J. Cooper, B. T. King, M. Poulton and G. E. Stedman, Appl Opt., 38, 2516-2523 (1999).
- (3) R. W. Dunn, D. E. Shabalin, R. J. Thirkettle, G. J. MacDonald, G. E. Stedman and K. U. Schreiber, Appl. Opt., 41, 1685-1688 (2002).
- (4) L. I. Schiff, Phys. Rev. Lett., 4, 215-217 (1960).
- (5) M. J. Snadden, J. M. McGuirk, P. Bouyer, K. G. Haritos and M. A. Kasevich, Phys. Rev. Lett., 81, 971-974 (1998).
- (6) T. L. Gustavson, PhD. Thesis, Stanford University (2000).
- (7) P. Bouyer, T. L. Gustavson, K. G. Haritos and M. A. Kasevich, Opt. Lett., 21, 1502-1504 (1996).
- (8) G. E. Stedman, Rep. Prog. Phys., 60, 615-688 (1997).
- (9) L. C. Ng and D. J. Pines, Journal of Guidance, Control, and Dynamics, 20, 211-214 (1997).
- (10) K. Bongs, R. Launay and M. A. Kasevich, arXiv:quant-ph/0204102
- (11) D. S. Weiss, B. C. Young and S. Chu, Appl. Phys. B, 59, 217-253 (1994).