Can optical squeezing be generated via polarization self-rotation in a thermal vapour cell?
Abstract
The traversal of an elliptically polarized optical field through a thermal vapour cell can give rise to a rotation of its polarization axis. This process, known as polarization self-rotation (PSR), has been suggested as a mechanism for producing squeezed light at atomic transition wavelengths. In this paper, we show results of the characterization of PSR in isotopically enhanced Rubidium-87 cells, performed in two independent laboratories. We observed that, contrary to earlier work, the presence of atomic noise in the thermal vapour overwhelms the observation of squeezing. We present a theory that contains atomic noise terms and show that a null result in squeezing is consistent with this theory.
pacs:
I Introduction
Squeezing is the reduction of the noise variance of an optical field below the quantum noise limit (QNL). Many applications, ranging from increased sensitivity of interferometric measurements mckenzie to quantum entanglement based information protocols ou ; furusawa ; bowen , are reliant on squeezed light. Recently, Duan et al. duan proposed a long-distance quantum communication network that is based on the interaction of atomic ensembles with squeezed and entangled light beams. To achieve such goals, squeezed light at atomic wavelengths is required.
Conventionally, squeezing can be generated via efficient non-linear optical processes, such as parametric down-conversion ou ; lam ; sorensen . The transparency windows of non-linear optical crystals, however, may not coincide with some atomic transitions. For example, commonly used Sodium and Rubidium atomic transition wavelengths are difficult to access via crystals. Another method of generating squeezed light is to utilize the atomic Kerr effect at the required atomic wavelength. These experiments, however, require ultra-cold atoms confined in cavities and are therefore technically challenging lambrecht ; josse1 .
Recently, there has been a proposal for generating atomic wavelength squeezing via the single traversal of an optical field through a thermal vapour cell matsko . This proposal promises a simple, scalable and cost-effective means of generating squeezed light for Rb and potentially for other atomic species. Due to the ac Stark shift and optical pumping-induced refractive index changes of the atomic vapour, an elliptically polarized input field will experience an intensity dependent rotation of the optical polarization axes rochester . This effect, known as polarization self-rotation (PSR), was suggested as a non-linear mechanism for squeezing novikova ; matsko . Assuming negligible atomic spontaneous emission noise, Matsko et al. matsko developed a phenomenological model that treats PSR as a cross-phase modulation mechanism. In the situation of a linearly polarized input field propagating through the vapour cell, a non-linear cross-phase interaction occurs between the two circularly polarized field components. This results in the squeezing of the output vacuum field mode that is orthogonally polarized to the input field. Analogous to cross-phase modulation squeezing in optical fibres haus ; margalit ; bergman ; bergman1 ; silberhorn ; rosenbluh , it was suggested that 6 dB of PSR squeezing is possible with thermal Rb vapour cell. Subsequently Ries et al. ries reported an observation of 0.85 dB maximum squeezing from a Rb vapour cell and attributed their squeezing to PSR.
The phenomenological model of PSR squeezing by Matsko et al. matsko ignored effects such as atomic spontaneous emission. In contrast, Josse et al. josse pointed out the importance of noise terms arising from the atomic dynamics that could possibly degrade, if not totally destroy, squeezing. The model of Josse et al. josse was based on the interaction of a linearly polarized field with 4-level atoms. They showed that in the high saturation regime, the atomic noise contribution could potentially be larger than the squeezing term. Nevertheless, in the low saturation regime and at sideband frequencies larger than the atomic relaxation rate, squeezing on the vacuum mode can be generated via the cross-Kerr effect induced by the bright field. Such a regime, however, can only be obtained with ultra-cold trapped atoms enclosed in an optical cavity josse1 .
This paper is structured as follows - In Section II, we review the theoretical works of Matsko et al. matsko and Josse et al. josse . We modified the analysis of Josse et al. josse to the case of a single traversal optical field through a thermal vapour cell. In Section III, we report measurements of both the transmittivity and the PSR of an elliptically polarized field through an isotopically enhanced 87Rb vapour cell on both the and lines. We then study the noise properties of the outgoing vacuum field. The parameter regime investigated extends beyond the squeezing regime reported in Ref. ries . In contradiction to the results in Ref. ries , no optical squeezing was observed. Instead, we observed excess quadrature noise above the QNL for a wide range of parameters. Finally, in Section IV we relate experimental results to the theory and show that under our experimental conditions, where atomic spontaneous emission is significant, squeezing is overwhelmed by atomic noise terms.
II Theory
II.1 Cross-phase modulation squeezing
For cross-phase modulation squeezing in fibers, a bright input optical pulse in the -polarization is delivered into a weakly birefringent optical fiber. As a result of the non-linearity in the fiber, the annihilation () and creation () operators for the -polarized vacuum field become coupled haus ; margalit ; bergman ; bergman1 . The equation of motion for the -polarized field, in the rotating frame, is given by
| (1) |
where is the Kerr coefficient, is the non-linear index coefficient of the medium, is the carrier frequency and is the effective transverse area of the propagating field. The last term of Eq. (1) describes the cross-Kerr coupling between the bright - and vacuum -linearly polarized fields, and is responsible for generating squeezing in the -polarized field.
Matsko et al. matsko proposed that the PSR effect in atomic vapour can be used to generate vacuum squeezing. Their proposal was related to the mechanism of cross-phase coupling between two orthogonal polarization fields. We consider the PSR effect rochester , where an elliptically polarized field undergoes a rotation in its polarization ellipse upon propagation through an atomic medium. For an optically thin medium, the rotation angle is given by
| (2) |
where is the PSR parameter (dependent on the input field intensity and frequency), is the input field ellipticity (assumed to be small and constant during propagation, ) and is the length of the medium. One could take the analogy of the PSR effect to the quantum regime by considering a bright linearly -polarized input field. The PSR effect projects fluctuations of the bright -polarized field onto the -polarized vacuum field. The relative phase between the - and -polarized fields then provides amplification or attenuation of the -polarized field. This effect could potentially result in the reduction of the quantum fluctuations of the -polarized field.
We will now introduce a methodical representation for our optical field. For a measurement performed in an exposure time , a freely propagating single-mode optical field can be described by the electric field operator given by
| (3) |
where , and are the slowly varying field envelope annihilation and creation operators, respectively. is the field propagation axis, is the field carrier frequency and is the quantisation cross-section area. We can simplify the expression by introducing and phenomenologically extend the classical PSR to the quantum regime. The resulting -polarized field at the output of the PSR medium is given by
| (4) | |||||
The noise variance for the field, taking into account a phenomenogical absorption parameter matsko , is given by
| (5) | |||||
where for appropriate values of the phase , squeezing of the -polarized field can be observed. Such a model predicts squeezing values of 6-8 dB below the QNL. However, crucial details such as spontaneous emission and atomic noise are completely ignored, the effects of which can reduce, if not completely destroy, squeezing.
II.2 Squeezing in a 4-level System
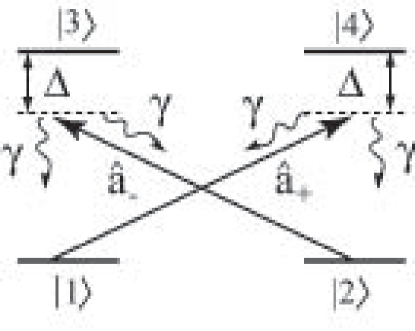
Since optical pumping is the main cause of PSR in the high saturation regime matsko ; zibrov , which is the relevant regime in our experiment, we can approximate the and lines of 87Rb using a 4-level atom model. In such a regime, the influence of atomic coherences are negligible. We thus explore the alternative cross-Kerr squeezing model proposed by Josse et al. josse . In the model, 4-level atoms interact with two orthogonal circularly polarized fields, as shown in Fig. 1. In the experiment of Ref. josse1 , squeezing was obtained in the vacuum field (orthogonally polarized to the bright input field) from ultra-cold trapped atoms, enclosed in a cavity. The 4-level squeezing model approximated the level structure of ultra-cold Cesium atoms ( to ), used in the experiment. In this section, we extend this cavity model to a single-propagation scenario for a single-mode bright -polarized input field. We derive the equation of motion describing the noise fluctuations of the output -polarized vacuum field.
The interaction Hamiltonian is given by
| (6) | |||||
where and are the respective slowly varying field envelope operators for the and circularly polarized fields, is the atomic density and is the atom-field coupling constant. The atomic dipole operator at position in the rotating frame is defined by locally averaging over a transverse slice containing many atoms
| (7) |
The optical Bloch equations for the atomic variables are then given by
where we have introduced the spontaneous decay term and Langevin noise operators that arise from the coupling of atoms to a vacuum reservoir. The Maxwell wave equations describing the and -polarized optical fields are given respectively by
| (9) | |||||
| (10) |
where is the total number of atoms. To deduce the noise properties of the field, we linearize the equations around the semi-classical steady state, and write the operators in the form . Transforming into the Fourier domain and linearizing Eqs. (LABEL:eqatoms)-(10) yields the equation of motion for the quantum fluctuations of the -polarized vacuum mode , given by
| (11) |
where and
| (12) | |||||
where is the cooperativity parameter, is the mean field intensity and is the saturation parameter. The last term of Eq. (11) represents the atomic Langevin noise term and is responsible for a loss or degradation of squeezing. Its exact form and noise spectrum are given and discussed in Sec. IV.
Note that for , the imaginary part of from the second term on the right hand side of Eq. (11) equates to the first term on the right hand side of Eq. (1). This turns out to be the parameter given in Eq. (2). In the 4-level atom model, the PSR for one velocity class increases with the number of atoms and is maximum when . For a Doppler-broadened vapour, can be obtained by summing Eq. (12) over all the velocity classes. Note that also gives the amplitude of the cross-Kerr squeezing term in , as in Eq. (11). However, the associated atomic noise contribution must be evaluated in order to obtain the total noise spectrum for the output -polarized field.
III Experiment
In this section, we present experimental results obtained from the two authoring institutions. Both experiments have similar experimental arrangement. In our experiments, a coherent beam at 795 nm (or 780 nm) was delivered from a Ti:Sapphire laser (Coherent MBR-110), as shown in Fig. 2. The laser beam was measured to be quantum noise limited at sideband frequencies MHz. A small fraction of the beam was sent through another Rubidium (Rb) vapour cell for saturated absorption spectroscopy. This provided us with a fine frequency reference for the laser and also allowed the possibility of laser frequency stabilisation. The majority of the beam was sent through a polarizer which transmitted the -polarized field.
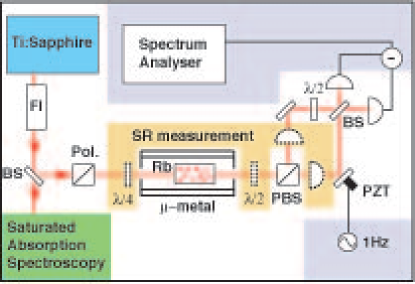
In order to measure the PSR and absorption of an input elliptically polarized beam through the vapour cell, the orange-shaded configuration of Fig. 2 was used. The -linearly polarized beam was converted into an elliptically polarized beam using a wave-plate. The beam (collimated to a waist size of m) then passed through an isotopically enhanced 87Rb vapour cell (75mm length), which was temperature stabilised at C (which corresponded to an atomic density of atoms/cm3). The vapour cell was enclosed in a two-layer -metal alloy cylinder, with end caps. The stray magnetic fields within the shielding region were measured to be mG in all three spatial axes. The output beam from the cell was then analysed using a balanced polarimeter setup, which consisted of a wave-plate, a polarising beam-splitter and two balanced photo-detectors. The wave-plate was adjusted to balance the powers in the - and -linearly polarized beams from the outputs of the polarising beam-splitter, when the frequency of the laser was tuned far off-resonance. Thus any rotation of the axis of the input elliptically polarized beam could be measured using the relationship rochester
| (13) |
where and are the DC signals from the photo-detectors.
To measure the quadrature noise properties of the -linearly polarized vacuum beam, we then performed homodyne detection, as shown in Fig. 2, using the -linearly polarized output of the polarising beam-splitter as a local oscillator.
III.1 Classical results
The PSR and transmission of an input elliptically polarized beam through the Rb vapour cell were measured by scanning the laser frequency across the energy levels of interest, for a fixed input beam intensity. For the line, the relevant levels were to and for the line, to . We repeated the measurement for varying input beam powers and obtained a contour map of PSR and transmission as a function of laser frequency detuning and input beam intensity, shown in Figs. 3, 4, 6 and 7.
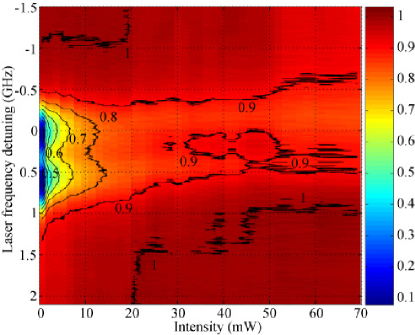
The transmission results for the line are shown in Fig. 3.
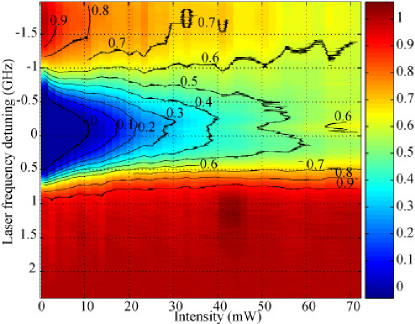
The region of lowest transmission % occurred at input beam intensities mW, around laser frequencies close to zero detuning. For input beam powers mW greater transmission ( %) was observed. However, power broadening effects were also observed for higher input beam powers, with reduced transmission at frequencies GHz. The transmission was non-symmetric with high transmission ( %) for frequencies GHz, whilst reduced transmission ( %) for frequencies GHz. This was due to the level structure of the excited states of the line, where the separations between the hyperfine levels are small (within a frequency band of GHz). Power broadening effects were also observed for input beam intensities mW.
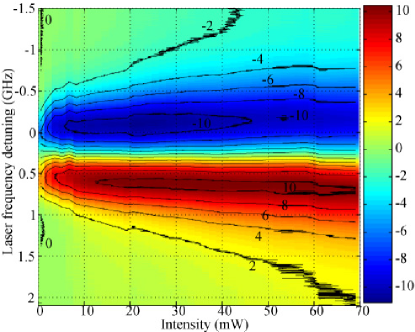
The PSR results for the line are shown in Fig. 4.
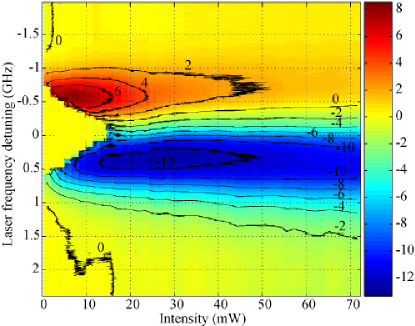
The regions of largest PSR were 0.3 GHz and -0.6 GHz. The input beam powers which gave the largest magnitudes of 8 and 13 were mW and mW, respectively. Zero around zero detuning for input beam powers mW was due to the low transmission of the input beam for the optically thick 87Rb vapour cloud. However, at frequency detunings and GHz, significant PSR was observed even though the transmission was reduced. For input beam intensities mW, the PSR was preferentially larger with positive frequency detunings as opposed to negative frequency detunings.
In order to explain the asymmetry present in the PSR results, we modelled the hyperfine energy levels of the line and took into account Doppler broadening. The theoretical fits to the experimental data are shown in Fig. 5.
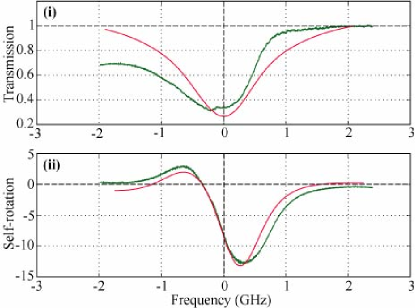
The reduction in PSR in the negative frequency detuning region was due to reduced transmission, as observed in Fig. 3. Broadening of the PSR profile was observed for higher input beam powers.
The transmission results for the line are shown in Fig. 6.
The region of lowest transmission ( %) occured for input beam intensities mW. These regions were confined around two frequency detuning bands, the to 0.25 GHz band and the 0.4 to 0.8 GHz band. The two frequency bands corresponded to the absorption lines centred at the to and to energy levels, respectively. For input beam powers mW, significant transmission was observed ( %). For most input beam powers, the transmission of the line was significantly higher than that of the line. This was due to the weaker atom-field coupling in the line compared to the line.
The PSR results for the line are shown in Fig. 7.
The regions of largest PSR occurred at frequency detunings -0.15 GHz and 0.6 GHz. The input beam powers that gave the largest magnitudes of 10 and 11 were mW and mW, respectively. Significant PSR was observed for input beam powers mW since the transmission was always %. The magnitude was almost equal in both frequency bands corresponding to the two absorption lines centred at the to and to energy levels, for most input beam powers. This was due to the excited state level structure of the line, where the two excited state levels have a large separation of GHz. This is illustrated by modelling the hyperfine excited state level structure of the line. The theoretical fits to the experimental data are shown in Fig. 8.
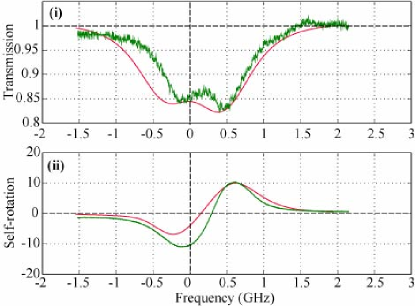
The two transmission dips are of approximately the same magnitude, resulting in the two PSR peaks to be of equal magnitudes.
III.2 Quantum results
The input field was linearly polarized in the -axis and we measured the quadrature noise of the outgoing -polarized vacuum field, using the homodyne detection setup shown in Fig. 2. The bright -polarized output field was used as a local oscillator. The fringe visibility of the interferometer was 99 %. The two outputs of the interferometer were then detected using two balanced Silicon photo-detectors (which consisted of Hamamatsu S3883 photo-diodes with measured quantum efficiency values of 94.6%) with bandwidths of MHz. Blocking the weak field provided a measurement of the QNL. The QNL was checked for linearity with beam power and the common mode rejection was optimised to -40 dB from 100 kHz to 10 MHz. We also checked that the polarising beam-splitter was well aligned such that negligible amounts of the -polarized field emerged at the -polarized output port. The result of the noise measurement for various sideband frequencies at various laser frequency detunings and input beam powers, are shown in Figs. 9 ( line) and 11 ( line).
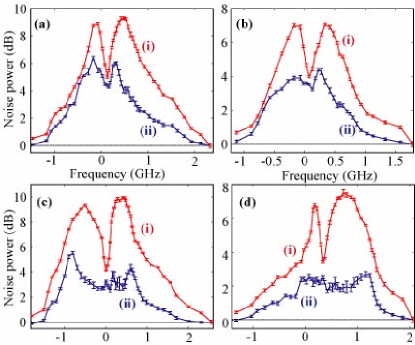
The largest quadrature noise observed for the line was 10 dB at a detuning of -70 MHz as shown in Fig. 9 (c). A time scanned quadrature noise measurement is shown in Fig. 10.
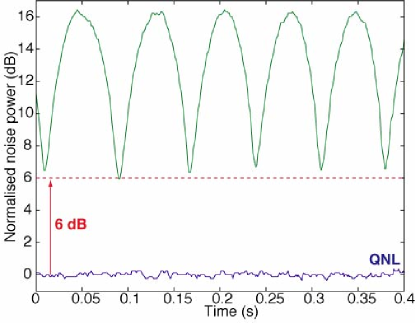
In the noise plots of Figs. 9 (a), (c) and (d), we observed large levels of excess noise of typically 5 dB above the QNL. In Fig. 9 (b) the excess noise level was 0.8 dB above the QNL. This was the lowest noise level observed around zero detuning. The largest values of the phase quadrature noise level corresponded to the regions of maximum PSR as shown in Fig. 4. At large frequency detunings from resonance, both quadrature noise levels were reduced to the QNL.
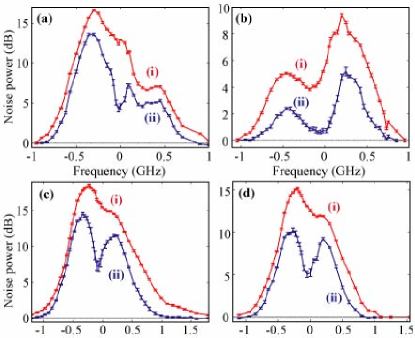
The noise measurements of the output vacuum field, for the D1 line, are shown in Fig. 11.
The largest noise modulation observed was 7 dB which occurred at a frequency detuning of 150 MHz as shown in Fig. 11 (c). In Figs. 11 (a)-(d), the phase quadrature noise level around zero detuning was always above the QNL due to the presence of large excess noise (3-4 dB). The largest values of the amplitude noise level corresponded to the regions of maximum PSR as shown in Fig. 7. At large frequency detunings from resonance, both quadrature noise levels were reduced to the QNL.
The noise measurement results presented do not vary qualitatively with varying beam focussing geometry, incident power or temperature. A large amount of excess noise was systematically observed close to resonance. We also performed similar experiments using paraffin-coated cells and cells containing buffer gas, none of which resulted in the observation of squeezing. Although the PSR and transmission results measured were in a very similar regime to that of Ref. ries , the quantum noise results are not in agreement with either the predictions of Ref. matsko or the observations of Ref. ries . We use the model presented in Sec. II.2 to discuss our experimental observations.
IV Discussion and Conclusions
IV.1 Langevin noise analysis
In order to contrast the effect of the atomic noise terms with the squeezing term in Eq. (11), we consider the Langevin term given by
| (14) |
where
with , , and . The contribution of this noise term, which depends on the sideband frequency, is to be compared with the cross-Kerr squeezing term . As shown in Ref. josse , in the low saturation regime, large excess atomic noise associated with optical pumping on the -polarized field dominates at sideband frequencies lower than the spontaneous emission rate (). In the low sideband frequency regime (assuming ), one obtains
| (15) |
where denotes the linear dephasing. Ignoring depletion of the mean -polarized field, the Langevin noise contribution is shown to be proportional to at least. For the experiment, this quantity is greater than the QNL, such that large excess noise is present in all quadratures for low sideband frequencies, even when absorption is ignored. One therefore cannot observe squeezing in this regime.
In the experiment, the quantum noise of the vacuum field was measured only for sideband frequencies greater than the excited state decay rate (). In this high sideband frequency regime (assuming ), we obtain succinct expressions for , and given by
| (16) | |||||
| (17) | |||||
The above equations describe the atomic noise contribution that may degrade the squeezing of the output -polarized vacuum field.
The optimization of squeezing is dependent on finding a regime that has low absorption and strong non-linearity. We now proceed by dividing the discussion into low and high atomic transition saturation regimes.
IV.2 Low saturation regime with ultra-cold atoms
Since cold atoms have higher atomic density, one can operate in the low saturation regime () and still obtain strong PSR with minimal atomic noise josse1 , when off-resonance. In the Kerr limit (), the equation of motion for the vacuum field fluctuations is given by
| (18) |
One recovers in the equation above the same terms as in the cavity model of Ref. josse under the same approximations. The term in corresponds to the linear dephasing, the second term gives the cross-Kerr squeezing term and the Langevin noise contribution corresponding to the last term can be shown to be proportional to , which can be small in the off-resonant situation (). In accordance with the prediction of Ref. josse and the experimental observations of Ref. josse1 vacuum squeezing can be generated when and .
IV.3 High saturation regime with thermal vapour cell
Contrary to the situation of cold atoms, the Doppler broadening in a thermal vapour makes it impossible to work in the low saturation regime while simultaneously having low absorption or high non-linearity. It is however possible to observe strong PSR in the high saturation regime. In this regime, the atomic noise term is significantly different to that given in Eq. (18). For , the equation of motion is given by
| (19) |
As we have seen experimentally with the PSR measurements, the non-linear term in can still be significant when the number of atoms are increased. However, the optical pumping processes associated with PSR now produce a lot of excess noise even in the high sideband frequency regime. The contribution of the last term in Eq. (19) can be shown to be proportional to . For our experimental parameters, the atomic noise prevents the observation of squeezing at all sideband frequencies.
IV.4 Further considerations
We now discuss the possible discrepancies between the theoretical models and the experiment. Due to the complexity of the problem, many effects have not been taken into account in the various models discussed in this paper.
Firstly, the presence of resonance fluorescence has not been considered in Ref. matsko . In Ref. josse , it was shown that PSR cannot generate squeezing in the low saturation regime because of optical pumping processes. We have shown in this paper that this is also true in the high saturation regime where the resonance fluorescence noise dominates over the cross-Kerr squeezing term, even at high detection frequencies. This conclusion is in agreement with other observations boyd ; agarwal ; zibrov .
Secondly, none of the models presented have included the Doppler effect. Since we are dealing with thermal atoms, the passage of light through the atoms will give rise to a range of observed atomic detuning. The integrated effect due to Doppler broadening will be detrimental to the observation of squeezing.
Thirdly, the multi-level hyperfine structure of the excited states of 87Rb have only been considered for the theoretical fits to the classical PSR results, but have not been included in any of the squeezing model. The experimental PSR data presented in this paper clearly shows that the multi-level hyperfine structure causes observable asymmetry in the PSR spectrum. This feature cannot be explained by any of the theoretical models presented in Sec. II. The multi-level theory can be expanded to include Langevin noise terms. However, a simple 4-level atom model is sufficient to demonstrate the lack of squeezing. The multi-level structure is also certainly less favourable to the generation of squeezing when compared with a simplified 4-level model. Different hyperfine levels will not contribute constructively towards a collective interaction that will generate squeezing. The added noise from these different levels will add up significantly. The inclusion of Doppler broadening and multi-level effects would only result in a dominance of the atomic noise term over the squeezing term.
Finally, the propagation of the transverse intensity profile of the input field has been totally ignored in all models. A full treatment of the process should include the multi-modal analysis of the evolution of the transverse field modes during propagation through the vapour cell. In the high saturation regime and for high atomic densities, self-focussing is readily observed. This is due to the atom induced Kerr lens-effect on the optical field. Thus the centre of the field intensity distribution will undergo greater PSR than the edges. The cross-Kerr non-linearity and the atomic absorption used in our calculations is a result of an “integrated” effect of the various transverse modes. It therefore does not model accurately the situation of the experiment. Similar to the previous argument, it is unlikely that the multi-modal consideration of the process will yield better squeezing.
IV.5 Conclusion
We have presented experimental results of PSR from two independent laboratories and have observed no squeezing. Instead we have observed excess noise in the output field spectrum at all sideband frequencies. We have modelled semi-classically the multi-level hyperfine structure of 87Rb and obtained theoretical fits to the experimental PSR data. Our multi-level modelling can predict the asymmetry in the PSR, that is due to the presence of other hyperfine excited states. We considered a quantum mechanical 4-level atomic model and showed that the squeezing term is overwhelmed by atomic noise terms in the situation of a thermal vapour. The effects of resonance fluorescence, the Doppler effect and the multi-level hyperfine structure of 87Rb all contribute to overwhelm the squeezing term. Therefore, it is expected that a full quantum mechanical treatment of a multi-level 87Rb atom will yield a result where squeezing cannot be generated. In spite of this, the 4-level atom model shows that squeezing can be generated in the situation of cold atoms where the Doppler effect is negligible. When the input field is off-resonance, the non-linearity is large but the absorption low, such that the atomic noise term does not overwhelm the squeezing term.
Acknowledgements.
We would like to thank P. Drummond, W. P. Bowen, J. J. Longdell and A. Lvovsky for fruitful discussions and Paul Tant for technical support. This research was funded under the Australian Research Council Centre of Excellence Programme and the European Project n∘FP6-511004 (COVAQIAL).References
- (1) K. McKenzie, D. A. Shaddock, D. E. McClelland, B. C. Buchler, and P. K. Lam, Phys. Rev. Lett. 88, 231102 (2002).
- (2) Z. Y. Ou, S. F. Pereira, H. J. Kimble, and K. C. Peng, Phys. Rev. Lett. 68, 3663 (1992).
- (3) A. Furusawa, J. L. Sorensen, S. L. Braunstein, C. A. Fuchs, H. J. Kimble, and E. S. Polzik, Science 282, 706 (1998).
- (4) W. P. Bowen, N. Treps, B. C. Buchler, R. Schnabel, T. C. Ralph, H.-A. Bachor, T. Symul, and P. K. Lam, Phys. Rev. A 67, 032302 (2003).
- (5) L.-M. Duan, M. D. Lukin, J. I. Cirac, and P. Zoller, Nature 414, 413 (2001).
- (6) P. K. Lam, T. C. Ralph, B. C. Buchler, D. E. McClelland, H.-A. Bachor, and J. Gao, J. Opt. B: Quantum Semiclassical Opt. 1, 469 (1999).
- (7) J. L. Sorensen, J. Hald, and E. S. Polzik, Phys. Rev. Lett. 80, 3487 (1998).
- (8) A. Lambrecht, T. Coudreau, A. M. Steinberg, and E. Giacobino, Europhys. Lett. 36, 93 (1996).
- (9) V. Josse, A. Dantan, L. Vernac, A. Bramati, M. Pinard, and E. Giacobino, Phys. Rev. Lett. 91, 103601 (2003).
- (10) A. B. Matsko, I. Novikova, G. R. Welch, D. Budker, D. F. Kimball, and S. M. Rochester, Phys. Rev. A 66, 043815 (2002).
- (11) S. M. Rochester, D. S. Hsiung, D. Budker, R. Y. Chiao, D. F. Kimball, and V. V. Yashchuk, Phys. Rev. A 63, 043814 (2001).
- (12) I. Novikova, A. B. Matsko, and G. R. Welch, J. Mod. Opt. 49, 2565 (2002).
- (13) L. Boivin, and H. A. Haus, Opt. Lett. 21, 146 (1996).
- (14) M. Margalit, C. X. Yu, E. P. Ippen, and H. A. Haus, Opt. Express 2, 72 (1998).
- (15) K. Bergman, and H. A. Haus, Opt. Lett. 16, 663 (1991).
- (16) K. Bergman, C. R. Doerr, H. A. Haus, and M. Shirasaki, Opt. Lett. 18, 643 (1993).
- (17) M. Rosenbluh and R. M. Shelby, Phys. Rev. Lett. 66, 000153 (1991).
- (18) Ch. Silberhorn, P. K. Lam, O. Weiss, F. König, N. Korolkova and G. Leuchs, Phys. Rev. Lett. 86, 4267 (2001).
- (19) J. Ries, B. Brezger, and A. I. Lvovsky, Phys. Rev. A 68, 025801 (2003).
- (20) V. Josse, A. Dantan, A. Bramati, M. Pinard, and E. Giacobino, J. Opt. B: Quantum Semiclassical Opt. 5, S513 (2003).
- (21) M. Kauranen, A. L. Gaeta, R. W. Boyd, and G. S. Agarwal, Phys. Rev. A 50, R929 (1994).
- (22) G. S. Agarwal, and R. W. Boyd, Phys. Rev. A 38, 4019 (1988).
- (23) A. S.. Zibrov and I. Novikova, e-print quant-ph/0508220.