Precision lifetime measurements of a single trapped ion with ultrafast laser pulses
Abstract
We report precision measurements of the excited state lifetime of the and levels of a single trapped Cd+ ion. The ion is excited with picosecond laser pulses from a mode-locked laser and the distribution of arrival times of spontaneously emitted photons is recorded. The resulting lifetimes are 3.148 0.011 ns and 2.647 0.010 ns for and respectively. With a total uncertainty of under 0.4%, these are among the most precise measurements of any atomic state lifetimes to date.
pacs:
32.70.Cs, 32.80.Pj, 42.50.VkPrecise measurements of atomic data are of great interest throughout many fields of science. Lifetime measurements are of particular importance to the interpretation of measurements of atomic parity nonconservation Wood et al. (1997), tests of QED and atomic structure theory Curtis (2003), and even astrophysical applications Li et al. (2000). Because of this, new and more accurate ways of measuring excited state lifetimes are constantly being investigated. Previous methods include time-correlated single photon techniques Young et al. (1994); DeVoe and Brewer (1994, 1996); Pinnington et al. (1994); Aubin et al. (2003); Xu et al. (2004), beam-foil experiments Pinnington et al. (1994), fast beam measurements Gaupp et al. (1982); Rafac et al. (1999), electron-photon delayed coincidence techniques Imhof and Read (1971); Shaw et al. (1975), luminescent decay Lefers et al. (2002); Zinner et al. (2003), linewidth measurements Oates et al. (1996), photoassociative spectroscopy McAlexander et al. (1995), and quantum jump methods Peik et al. (1994).
Here we report excited state lifetime measurements using a time-correlated single photon counting technique on a single atom. This method, designed especially to eliminate common systematic errors, involves selective excitation of a single trapped ion to a particular excited state (lifetime of order nanoseconds) by an ultrafast laser pulse (duration of order picoseconds). Arrival of the spontaneously-emitted photon from the ion is correlated in time with the excitation pulse, and the excited state lifetime is extracted from the distribution of time delays from many such events.
By performing the experiment on a single trapped ion, we are able to eliminate prevalent systematic errors, such as: pulse pileup that causes multiple photons to be collected within the time resolution of the detector, radiation trapping or the absorption and re-emission of radiation by neighboring atoms, atoms disappearing from view before decaying, and subradiance or superradiance arising from coherent interactions with nearby atoms. By using ultrafast laser pulses, we eliminate potential effects from applied light during the measurement interval.
With this setup, at most one photon can be emitted following an excitation pulse. While this feature is instrumental in eliminating the above systematic errors, it would appear that this signal would require large integration times for reasonable statistical uncertainties. However, with a lifetime of only a few nanoseconds, millions of such excitations can be performed each second, thus potentially allowing sufficient data for a statistical error of under 0.1% to be collected in a matter of minutes DeVoe and Brewer (1994).
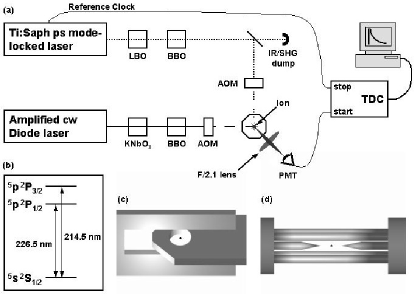
A diagram of the experimental apparatus is shown in Fig. 1. Individual cadmium ions are trapped and isolated in one of two rf quadrupole traps. First, the experiment is conducted using an asymmetric quadrupole trap of characteristic size 0.7 mm Jefferts et al. (1995) [Fig. 1(c)]. The entire experiment is then repeated in a linear trap with rod spacings of 0.5 mm and an endcap spacing of 2.6 mm [Fig. 1(d)]. Both traps have secular trapping frequencies on the order of MHz.
Two types of laser radiation are incident on the ion: pulsed and continuous wave (cw) lasers. The pulsed light is from a picosecond mode-locked Ti:Sapphire laser whose center frequency is resonantly tuned to provide excitation to one of the states [Fig. 1(b)]. For excitation to the ( ) state, each pulse is frequency quadrupled from 906 nm to 226.5 nm (858 nm to 214.5 nm) through phase-matched LBO and BBO nonlinear crystals. The UV is filtered from the fundamental and second harmonic via dichroic mirrors and directed to the ion with a near transform-limited pulse width of ps. Since the pulsed laser bandwidth (400 GHz) is much smaller than the fine-structure splitting (74 THz), selective excitation to the different excited states is possible. Each pulse has pJ of energy, which will excite the ion with a probability of approximately ten percent exc : , where is the atomic linewidth, is the saturation intensity, and m is the beam waist. This pulsed laser is also used to load ions in the trap via photoionization by tuning to the neutral cadmium - resonance at 228.8 nm. Once loaded, a single ion will typically remain in the trap for several days.
After the ion is loaded, it is crystallized within the trap via Doppler cooling on the D2 line at 214.5 nm using the cw laser. This laser is tuned approximately one linewidth to the red of resonance and localizes the ion to under 1 m. Residual micromotion at the rf drive frequency (40 MHz) is reduced via offset electric fields supplied from compensation electrodes Berkeland et al. (1998). We estimate the kinetic energy from this micromotion to be under 1 Kelvin.
Following excitation from the pulsed laser, the spontaneously emitted photons are collected by an imaging lens and directed toward a photon-counting photo multiplier tube (PMT) abe . The output signal of the PMT provides the start pulse for the time to digital converter (TDC), whereas the stop pulse is synchronized to the reference clock of the mode-locked laser. This time-reversed mode is used to eliminate dead time in the TDC. The PMT used is a Hamamatsu H6240 Series PMT of quantum efficiency , and the TDC is an ORTEC model 9353 time digitizer that has 100 ps digital time resolution with no interpolator, accuracy within 20 ppm, less than 145 ps time jitter, and an integral non-linearity within 20 ps rms.
In the experiment, an acousto-optic modulator (AOM) is used to switch on the cw beam to Doppler cool the ion for 500 ns. Following the cooling pulse, a reference clock from the pulsed laser (synchronized with the laser pulse train) triggers an AOM in the pulsed laser beam and directs a number of pulses to the ion ( 15 pulses, with adjacent pulses separated by 12.4 ns). The repetition rate of this cycle is limited to 1 MHz due to the update time of the pulse generator, and during a given excitation pulse the success probability of detecting an emitted photon is . This gives an average count rate of about 3000 counts per second and thus an expected statistical precision of , where is the excited state lifetime and is data collection time in minutes.
Despite the absence of previously mentioned common systematic effects, possible effects that still must be considered in this system include Zeeman and hyperfine quantum beats Silverman et al. (1978). Zeeman quantum beats have no significant effect (shifts of ) when working in sufficiently low magnetic fields ( Gauss), whereas hyperfine beating is eliminated by using an even isotope of Cd that has no hyperfine structure (i.e. 110Cd+). Potential effects from off-resonant laser light - AC stark shifts, background counts, etc. - are also greatly reduced or eliminated in this experiment by taking data only when the cw cooling beam is switched off via the AOM. Hence, immediately following the excitation pulse, the only light present is the single spontaneously emitted photon from the ion. Other possible effects such as relativistic shifts or isotopic dependencies are negligible. Therefore, the only remaining systematic effects to be considered in this experiment are those arising from the equipment.
| Trap | Error | ||
|---|---|---|---|
| Quadrupole | … | 3.148 | 2.646 |
| Statistical | 0.005 | 0.002 | |
| Systematic | 0.010 | 0.010 | |
| Linear | … | 3.132 | 2.649 |
| Statistical | 0.002 | 0.003 | |
| Systematic | 0.030 | 0.010 | |
| Final Results | 3.148 0.011 | 2.6470.010 |
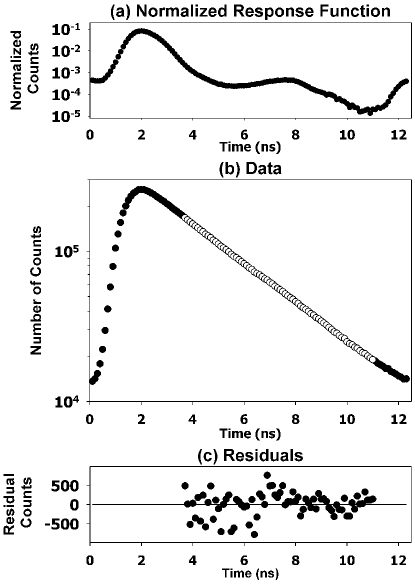
To determine the excited state lifetime, the data in a 12.4 ns range for each laser pulse are summed and time-inverted. These spectra are corrected for uncorrelated background events and then fit to a single exponential lifetime, . As the start time of the fit is stepped out from the peak Vallery et al. (2003), the fitted lifetime for the experimental data has a non-statistical variation of 3 to 5 percent. This systematic effect is expected given the presence of “prompt” events from scattered pulsed laser light and from electronic ringing on the PMT seen in Figure 2(a). The combination of these two effects distorts the spectrum from a pure exponential. To account for this variation, an appropriately convolved spectrum of the response function [Fig. 2(a)] and plus a function prompt peak is generated, fit in the same manner, and compared to the data to extract the lifetime value. These values are summarized in Table 1 for each trap and transition.
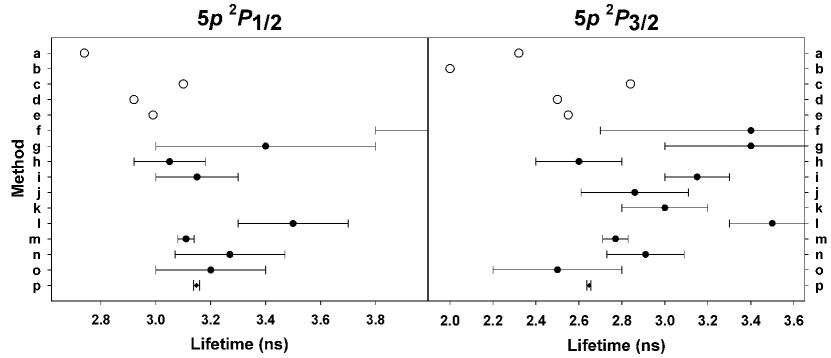
The final values, summarized in Table 1 for each trap, are ns for the state and ns for the state. The final error is the average of the statistical error (less than 0.15% for all measurements) and the systematic error. The systematic error of approximately 0.4% is due to the uncertainty in comparison of the fitted values of the convolved spectrum and the experimental data. These new results are plotted in Figure 3 along with previously reported theoretical and experimental values for these levels. It is seen from this figure that the results reported in this paper are the most precise measurements of these particular excited states of Cd+.
In conclusion, we have demonstrated a new technique for measuring excited state atomic lifetimes that is able to eliminate common systematic errors associated with such measurements. The results herein are not only the most precise to date for Cd+, but with absolute uncertainties of order 10 ps, are among the most precisely measured excited state lifetimes in any atomic system. Furthermore, this technique has the potential to achieve 100 ppm precision by eliminating the remaining systematic effects due to prompt events and PMT ringing. Other possible improvements include increasing the data collection rate by using a faster pulse generator and TDC, and measuring a longer decay range by pulse-picking individual pulses.
Acknowledgements.
This work is supported by the U.S. National Security Agency and Advanced Research and Development Activity under Army Research Office contract DAAD19-01-1-0667 and the National Science Foundation Information Technology Research Program.References
- Wood et al. (1997) C. S. Wood, S. C. Bennett, D. Cho, B. P. Masterson, J. L. Roberts, C. E. Tanner, and C. E. Wieman, Science 275, 1759 (1997).
- Curtis (2003) L. J. Curtis, Atomic Structure and Lifetimes (Cambridge Univ. Press, 2003).
- Li et al. (2000) Z. S. Li, H. Lundberg, G. M. Wahlgren, and C. M. Sikström, Phys. Rev. A 62, 032505 (2000).
- Young et al. (1994) L. Young, W. T. Hill III, S. J. Sibener, S. D. Price, C. E. Tanner, C. E. Wieman, and S. R. Leone, Phys. Rev. A 50, 2174 (1994).
- Pinnington et al. (1994) E. H. Pinnington, J. J. van Hunen, R. N. Gosselin, B. Guo, and R. W. Berends, Phys. Scr. 49, 331 (1994).
- DeVoe and Brewer (1994) R. G. DeVoe and R. G. Brewer, Optics Letters 19, 1891 (1994).
- DeVoe and Brewer (1996) R. G. DeVoe and R. G. Brewer, Phys. Rev. Lett. 76, 2049 (1996).
- Aubin et al. (2003) S. Aubin, E. Gomez, L. A. Orozco, and G. D. Sprouse, Opt. Lett 28, 2055 (2003).
- Xu et al. (2004) H. L. Xu, A. Persson, S. Svanberg, K. Blagoev, G. Malcheva, V. Pentchev, E. Biémont, J. Campos, M. Ortiz, and R. Mayo, Phys. Rev. A 70, 042508 (2004).
- Gaupp et al. (1982) A. Gaupp, P. Kuske, and H. J. Andrä, Phys. Rev. A 26, 3351 (1982).
- Rafac et al. (1999) R. J. Rafac, C. E. Tanner, A. E. Livingston, and H. G. Berry, Phys. Rev. A 60, 3648 (1999).
- Imhof and Read (1971) R. E. Imhof and F. H. Read, J. Phys. B 4, 450 (1971).
- Shaw et al. (1975) D. A. Shaw, A. Adams, and G. C. King, J. Phys. B 8, 2456 (1975).
- Lefers et al. (2002) J. Lefers, N. Miller, D. Rupke, D. Tong, and M. Walhout, Phys. Rev. A 66, 012507 (2002).
- Zinner et al. (2003) M. Zinner, P. Spoden, T. Kraemer, G. Birkl, and W. Ertmer, Phys. Rev. A 67, 010501(R) (2003).
- Oates et al. (1996) C. W. Oates, K. R. Vogel, and J. L. Hall, Phys. Rev. Lett. 76, 2866 (1996).
- McAlexander et al. (1995) W. I. McAlexander, E. R. I. Abraham, N. W. M. Ritchie, C. J. Williams, H. T. C. Stoof, and R. G. Hulet, Phys. Rev. A 51, R871 (1995).
- Peik et al. (1994) E. Peik, G. Hollemann, and H. Walther, Phys. Rev. A 49, 402 (1994).
- Jefferts et al. (1995) S. R. Jefferts, C. Monroe, E. W. Bell, and D. J. Wineland, Phys. Rev. A 51, 3112 (1995).
- (20) It would be possible to increase the data rate by increasing this excitation probability, however, it was kept to near 10% since higher pulsed laser powers also tend to load extra ions into the trap.
- Berkeland et al. (1998) D. J. Berkeland, J. D. Miller, J. C. Bergquist, W. M. Itano, and D. J. Wineland, J. Appl. Phys. 83, 5025 (1998).
- (22) Due to the chromatic aberration of this imaging system, state-selective light collection between and is also achieved.
- Hamel and Barrat (1974) J. Hamel and J.-P. Barrat, Opt. Commun. 10, 331 (1974).
- Kunisz et al. (1975) M. D. Kunisz, J. Migdałek, and J. Rutkowski, Acta Phys. Pol. A 47, 227 (1975).
- Chou and Johnson (1997) H.-S. Chou and W. R. Johnson, Phys. Rev. A 56, 2424 (1997).
- Baumann and Smith (1970) S. R. Baumann and W. H. Smith, J. Opt. Soc. Am. 60, 345 (1970).
- Andersen and Sørensen (1973) T. Andersen and G. Sørensen, J. Quant. Spectrosc. Radiat. Transf. 13, 369 (1973).
- Rambow and Schearer (1976) F. H. K. Rambow and L. D. Schearer, Phys. Rev. A 14, 1735 (1976).
- Andersen et al. (1976) T. Andersen, O. Poulsen, and P. S. Ramanujam, J. Quant. Spectrosc. Radiat. Transf. 16, 521 (1976).
- Verolainen and Privalov (1980) Y. F. Verolainen and V. I. Privalov, Opt. Spectrosc. 48, 245 (1980).
- Silverman et al. (1978) M. P. Silverman, S. Haroche, and M. Gross, Phys. Rev. A 18, 1507 (1978).
- Vallery et al. (2003) R. S. Vallery, P. W. Zitzewitz, and D. W. Gidley, Phys. Rev. Lett. 90, 203402 (2003).