Controlling the Spontaneous Emission Rate of Single Quantum Dots in a 2D Photonic Crystal
Abstract
We observe large spontaneous emission rate modification of individual InAs Quantum Dots (QDs) in 2D a photonic crystal with a modified, high- single defect cavity. Compared to QDs in bulk semiconductor, QDs that are resonant with the cavity show an emission rate increase by up to a factor of 8. In contrast, off-resonant QDs indicate up to five-fold rate quenching as the local density of optical states (LDOS) is diminished in the photonic crystal. In both cases we demonstrate photon antibunching, showing that the structure represents an on-demand single photon source with pulse duration from 210 ps to 8 ns. We explain the suppression of QD emission rate using Finite Difference Time Domain (FDTD) simulations and find good agreement with experiment.
pacs:
42.50.Ct, 42.70.Qs, 42.50.Dv, 78.67.HcOne of the core issues of modern optics is the subject of photon interaction with matter. In the Wigner-Weisskopf approximation, the emission rate is directly proportional to the LDOSScully1997 . Over the past decade, photonic resonators with increased LDOS have been exploited to enhance emission rate for improving numerous quantum optical devices (e.g., santori2002 ; McKeever2003 ). Single photon sources in particular promise to see large improvementsKiraz2004 . While more attention has been given to increasing emission rate, the reverse is also possible in an environment with decreased LDOS.
Here we demonstrate that by designing a photonic crystal structure with a modified single-defect cavity, we can significantly increase or decrease the spontaneous emission (SE) rate of embedded QDs. Photonic crystals (PCs), periodic arrays of alternating refractive index, are near-ideal testbeds for such experiments. Their electromagnetic band structure modifies the LDOS relative to free space and hence the SE rate of embedded QD emitters. We demonstrate that SE of cavity-coupled QDs is enhanced up to 8 times compared to QDs in bulk GaAs. This coupling paves the way to single photon sources with higher out-coupling efficiency and visibility. On the other hand, decoupled QDs emit at up to five-fold decreased rate compared to bulk. This lifetime enhancement is significantly higher than previous reports for photonic crystalsLodahl2004 . Moreover, our experiments address individual quantum dots.
The total SE rate of a QD at position , spectrally detuned from the cavity resonance wavelength by , can be expressed as the sum of rates into cavity modes and all other modes, . In the weak-coupling regime where the cavity decay rate exceeds the QD-cavity coupling strength , the SE rates can be calculated from Fermi’s Golden Rule. The cavity density of states follows a Lorentzian and gives a simple expression for Scully1997 . Similarly, is related to the LDOS, which in the PC band gap is reduced relative to bulk semiconductor.
Comparing to the bulk semiconductor emission rate gives the SE rate enhancement factor,
| (1) |
In this equation, the factors and describe the spatial and spectral mismatch of the emitter dipole to the cavity field , and is the base SE rate in the photonic crystal without cavity. For perfect alignment, the rate enhancement is given by , where the cavity Purcell factor
| (2) |
The refractive index in GaAs and the cavity mode volume .
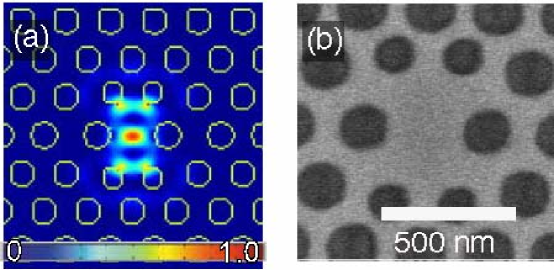
We designed a single-defect cavity in a 2D-photonic crystal to maximize SE enhancement (Fig.1). The structure was introduced earlier Vuckovic2003 and modified slightly for fabrication purposes. Briefly, we use FDTD to design high , low cavities with maximal QD-field interaction . To better meet fabrication constraints, the design was adjusted based on FDTD analyses of fabricated structures Englund2004b . The cavity supports an x-dipole mode with predicted and volume . We patterned this structure on 160 nm-thick GaAs membranes by a combination of electron beam lithography, dry- and wet- etching. Grown by molecular epitaxy, these membranes include a single central layer of self-assembled InAs QDs with density m2. The QD emission is inhomogeneously distributed about 920 nm with 50 nm linewidth (inset Fig.3(a)). The cavity resonance frequency was chosen to fall near the middle of the QD distribution.
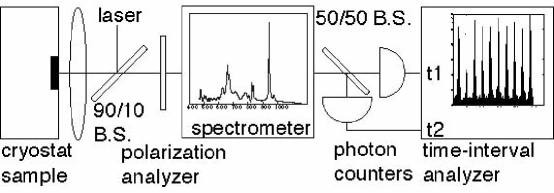
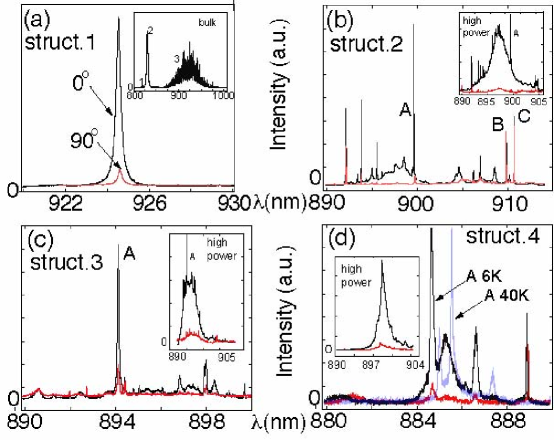
Cavity resonances of fabricated structures were measured by photoluminescence (PL) spectroscopy at 5 K. In the confocal microscope setup of Fig.2, the above-bandgap pump beam at 750 nm excites QDs within the 600 nm focal spot. This spot is much smaller than the 5 m-diameter PC so that only QDs within the crystal are addressed. The fraction of photoluminescence that originates from the cavity is enhanced over the background in two ways: through enhanced emission rate, and an increased coupling efficiency between cavity mode and collection optics. The latter efficiency was estimated by FDTD analysis of the cavity mode radiation pattern and equals for our objective lens with . This enhancement allows us to map out the cavity by pumping the QDs at high intensity, resulting in a broad inhomogeneous emission spectrum that mimics a white light source. The cavity then follows directly from a fit to the Lorentzian in Eq.1. The resonance shown in Fig.3(a) is a typical example for a fabricated cavity. It matches the polarization dependence predicted by FDTD. The quality factor misses the predicted value by an order of magnitude. We believe this decrease to result largely from fabrication inaccuracies as FDTD simulations of fabricated structures, which take these errors into account, do match the measured resonancesEnglund2004b . We note also that we observed no cavity linewidth narrowing at high pump intensity, so the cold-cavity is not over-estimated as a result of stimulated emission.
These typical high- cavities have the disadvantage that spectral coupling is unlikely. A calculation of the odds for spatial and spectral alignment predicts in only about 4% of cavities with . To analyze a larger data set, we must therefore focus on the easier coupling to low- cavities. For the present, we will consider three different structures, labeled 2, 3, and 4, with the same cavity design of Fig.1. Figs.3(b)-(d) show their PL spectra. High pump intensity spectra (insets) indicate x-dipole resonance modes with quality factors .
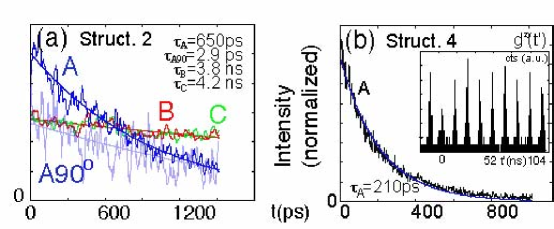
In Structure 2, the low-intensity spectrum reveals a single QD exciton line A, spectrally matched with the cavity (Fig.3(b)). Because of the low QD-cavity coupling probability, further evidence is required to confirm QD-cavity coupling. This comes from polarization matching. If the dot is coupled, only one of its two near-degenerate orthogonal emission lines Hoegele2004 is enhanced. Fig.3(b) indicates this is the case. For the coupled system, we expect the excitonic lifetime to be diminished by the Purcell factor compared to the surrounding. Using a streak camera with temporal resolution of 50 ps, we measured ps (Fig.5(a)). Compared to the excitonic lifetime in bulk semiconductor, which has a distribution of ns, this indicates a rate enhancement by . In striking contrast is the lifetime of QD excitons not coupled to a cavity. The cross-polarized emission A90∘ has a lifetime of 2.9 ns, far longer than in bulk. As can be seen in Fig.3(b), this line is much weaker than A due to low outcoupling and SE rate, as expected. Lines B and C, which are spectrally far detuned, show lifetimes extended even further to ns and ns, respectively.
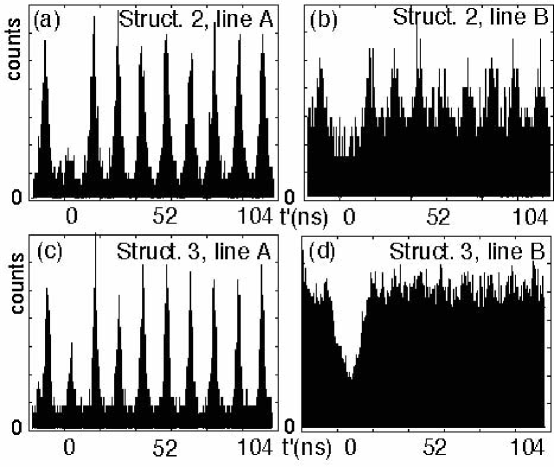
To verify that the observed emission results from single emitters, we measured photon statistics by the autocorrelation function . For short time scales, this function is measured from the coincidence rate between the two detectors of a Hanbury-Brown and Twiss interferometer. A start-stop scheme measures time delay between detection events. The laser repetition period is 13 ns (Fig.2). Fig. 4(a) presents the coincidence histogram for the cavity-coupled emission line A. The antibunching of at zero delay time indicates that the emission is indeed from a single emitter. Lines B (Fig. 4(a)) and C supplemental_section are also single emitters with and (estimated by exponential fits to the autocorrelation data).
This pattern of short-lived coupled, and long-lived decoupled excitonic lines was observed in many other structures. For instance, for structure 3, the PL spectrum (Fig.3(c)) shows a coupled single exciton line A, while a second line B at 932 nm is clearly decoupled. Line A again has short lifetime ns, while B has very long ns (Fig. 4(c,d)). Again, single photon behavior is apparent, with and . As an example of shortened lifetime, we show line A of Struct. 4. The low pump-intensity spectrum of Fig.3(d) shows coupling to the x-dipole cavity. To increase spectral coupling, we shifted line A from 884.67 to 885.54 nm by temperature-tuning from 6 to 40K Vuckovic2003b . Lifetime is sharply reduced to 210 ps (Fig.5(b)), roughly eight times shorter than in bulk GaAs, and photon coincidence is antibunched to .
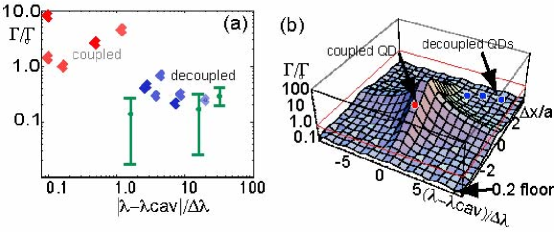
Off-resonant dots see up to five-fold lifetime enhancement. To explain these increased lifetimes, we again turn to Eq.1. The first term for emission into the cavity mode vanishes as the QD exciton line is far detuned from . The second term is reduced below unity due to the diminished LDOS in the PC for emission inside the PC bandgap, leading to longer lifetime. This SE rate modification is illustrated in Fig.6(b).
We verified the lifetime modification theoretically by FDTD analysis of a classical dipole in the PC with the x-dipole cavity. The simulation is based on the result that the quantum electrodynamical and classical treatments of SE emission yield proportional results, so that the SE rate is related to the classical dipole radiation power by for bulk GaAs and the PCXu1998 . In these simulations, we replicated the conditions under which the experimental data were obtained: 200 dipoles were placed at random positions and orientations in a photonic crystal structure, roughly covering the focal size over which we collected in the experiment. The same type of single-defect cavity with low was at the center. With the dipoles radiating at frequency and detuned from from the cavity, we simulated the averaged emitted power and were thus able to calculate the spatial average over all dipoles (QDs) of . To find the variance, we repeated this simulation for single emitters at a range of locations, one at a time. For decoupled QDs, we found average lifetime suppression to . These results, plotted in Fig. 6(a), agree well with our experimental observations and confirm earlier theoretical predictions of SE lifetime suppression inside the PC bandgap of a similar structureLee2000 . The TE bandgap of our structures extends from 784 nm to 1045 nm, calculated by FDTD simulations. Outside the bandgap, we expect to return closer to the bulk value, though we cannot observe this effect as the QD distribution does not reach outside the bandgap.
Due to spatial misalignment between the QD and cavity, most of the resonant dots presented here have moderate emission rate enhancement. This misalignment is estimated at about one lattice spacing based on the cavity mode pattern (Fig.1). Considering the low probability of QD-cavity coupling, these modest rate enhancements are not surprising. With better spatial and spectral matching, Eq.1 predicts that a rate enhancement of up to 400 is possible. Beyond that, Eq.1 is no longer valid as the system approaches the strong coupling regime near .
In conclusion, we show that by designing a suitable photonic crystal environment, we can significantly modify SE rate of embedded quantum dots. For QDs coupled to a PC defect cavity, we observe up to 8 times faster SE rate and demonstrate antibunching. This coupled system promises to increase out-coupling efficiency and photon-indistinguishability of single photon sources. In contrast, for individual off-resonant QDs in the PC, we show up to five-fold lifetime enhancement as a result of the diminished LDOS in the photonic bandgap. This extended lifetime may find applications in QD-based photonic devices (e.g., switching), including quantum information processing (e.g., quantum memory). It also shows that reported QD lifetime reduction due to surface proximity effectsWang2004 should not limit the performance of PC-QD single photon sources. We find good agreement between these results and FDTD simulations of SE in the photonic crystal.
Financial support was provided by the MURI Center for photonic quantum information systems (ARO/ARDA Program DAAD19-03-1-0199), JST, SORST project on quantum entanglement, NTT Basic Research Laboratories, NSF grants ECS-0424080 and ECS-0421483, as well as NDSEG and DCI fellowships. Sample growth was supported by the IT Program, MEXT.
References
- [1] M. O. Scully & M. S. Zubairy. Quantum Optics. Cambridge Univ. Press, Cambridge, 1997.
- [2] C. Santori, D. Fattal, J. Vuckovic, G. S. Solomon, and Y. Yamamoto. Indistinguishable photons from a single-photon device. Nature, 419(6907):594–7, October 2002.
- [3] J. McKeever, A. Boca, A. D. Boozer, J. R. Buck, and H. J. Kimble. Experimental realization of a one-atom laser in the regime of strong coupling. Nature, 425(6955):268–271, September 2003.
- [4] A. Kiraz, M. Atatüre, and I. Imamoǧlu. Quantum-dot single-photon sources: Prospects for applications quantum-information processing. Phys. Rev. A, 69:p.032305–1–032305–10, March 2004.
- [5] P. Lodahl, A. F. van Driel, I. S. Nikolaev, A. Irman1and K. Overgaag, D. Vanmaekelbergh, and W. L. Vos. Controlling the dynamics of spontaneous emission from quantum dots by photonic crystals. Nature, 430(7000):654–7, August 2004.
- [6] J. Vuckovic and Y. Yamamoto. Photonic crystal microcavities for cavity quantum electrodynamics with a single quantum dot. Applied Physics Letters, 82(21):3596–98, May 2003.
- [7] D. Englund et al. Error analysis and correction for fabrication of photonic crystal structures. to be published.
- [8] A. Högele, S. Seidl, M. Kroner, K. Karrai, R. J. Warburton, B. D. Gerardot, and P. M. Petroff. Voltage-Controlled Optics of a Quantum Dot. Physical Review Letters, 93(21):17401–1–217401–4, November 2004.
- [9] Data in supplemental material.
- [10] J. Vučković, D. Fattal, C. Santori, G. S. Solomon, and Y. Yamamoto. Enhanced single-photon emission from a quantum dot in a micropost microcavity. Applied Physics Letters, 82(15):2374–76, April 2003.
- [11] Y. Xu et al. Finite-difference time-domain calculation of spontaneous emission lifetime in a microcavity. Journal of the Optical Society of America B, 16(3):465–74, March 1999.
- [12] R. Lee et al. Modified spontaneous emission from a two-dimensional photonic bandgap crystal slab. Journal of the Optical Society of America B, 17(8):1438–42, August 2000.
- [13] C. F. Wang, A. Badolato, I. Wilson-Rae, P. M. Petroff, E. Huc, J. Urayama, and A. Imamoǧlu. Optical properties of single InAs quantum dots in close proximity to surfaces. Applied Physics Letters, 85(16):3423–5, October 2004.