Group velocity study in hot 87Rb vapor with buffer gas
Abstract
We study the behavior of the group velocity of light under conditions of electromagnetically induced transparency (EIT) in a Doppler broadened medium. Specifically, we show how the group delay (or group velocity) of probe and generated Stokes fields depends on the one-photon detuning of drive and probe fields. We find that for atoms in a buffer gas the group velocity decreases with positive one-photon detuning of the drive fields, and increases when the fields are red detuned. This dependence is counter-intuitive to what would be expected if the one-photon detuning resulted in an interaction of the light with the resonant velocity subgroup.
I Introduction.
Electromagnetically induced transparency (EIT) has been the subject of numerous theoretical and experimental studies Brandt et al., (1997); Vanier et al., (1998); Erhard and Helm, (2001); Lukin et al., (1997); Akulshin et al., (1998, 1991); Javan et al., (2002); Taichenachev et al., (2000). Materials displaying EIT have many interesting properties, such as narrow resonance width and steep dispersion resulting in ultra-low light group velocity Hau et al., (1999); Kash et al., (1999); Budker et al., 1999a . These properties make EIT interesting for several practical applications, such as frequency standards Knappe et al., (2001), precision magnetometry Novikova et al., (2001), enhanced nonlinear optics Hakuta et al., (1991); Hemmer et al., (1995); Jain et al., (1996); Zibrov et al., (1999), and quantum information storage Phillips et al., (2001); Liu et al., (2001); Zibrov et al., (2002).
The group velocity of light in media can be expressed as Kocharovskaya et al., (2001)
| (1) |
where is the speed of light in vacuum, is the frequency of the field, is the index of refraction in the medium, is the vacuum wave number, and we have defined
| (2) |
and
| (3) |
Here and below we use the convention that terms with a tilde ( ) denote values in the moving reference frame and terms with no tilde denote values in the laboratory frame.
The first term, , is due to frequency dispersion and the second term, , is due to spatial dispersion. Because of spatial dispersion, the group velocity is different for atoms with different speeds . This is easily seen because in the moving frame (we take positive for an atom moving in the same direction as the light propagation), from which we see that . This is just just the Galilean transformation from the moving frame of the atoms to the laboratory frame. Thus, a mono-velocity atomic beam moving in the opposite direction from the light propagation direction slows the group velocity.
In a dense Doppler broadened medium, it is possible to obtain slower or even zero group velocity Kocharovskaya et al., (2001); Rostovtsev et al., (2002) for the probe field in a configuration of strong drive and weak probe fields when both are red detuned but maintain the two-photon resonance condition. The following conditions on the power of the drive field must be satisfied
| (4) |
| (5) |
where is the Rabi frequency of the drive laser and is its wave vector, is the average thermal velocity, is the decay rate of the upper level, and is the decay rate of coherence between the lower (ground) levels.
Equation (4) is just the usual condition for EIT for individual atoms. Equation (5) is applicable only for the case where the drive field is weak enough that EIT occurs only for a narrow spread of atomic velocities. In this case, the intensity of the drive field is not large enough to pump all atomic velocity subgroups into the dark state. This means that the optical pumping rate , for atoms having one-photon detuning , is less than the relaxation rate , between levels and . Therefore implies that EIT does not occur for all moving atoms and the light interacts with a quasi atomic beam. When these conditions are satisfied, one can choose a velocity sub-group of atoms with a particular average velocity (in the direction of light propagation) and narrow velocity spread . This is accomplished by changing the one-photon detuning of the drive laser field while maintaining two-photon resonance. In this case, the center of the quasi-beam of moving atoms is determined by the simple Doppler relation
| (6) |
where is the drive laser frequency. Naturally we would expect atoms moving with the atomic quasi-beam to increase the group velocity, and atoms moving in the opposite direction to “drag” light with them, or decrease the total group velocity.
The intuitive picture described above is quantified rigorously in Ref. Kocharovskaya et al., (2001). In the present paper, we experimentally study these theoretical predictions by measuring the dependence of the group velocity on probe-field one-photon detuning for different experimental conditions.
A common method of increasing the dispersion in an EIT medium is to lengthen the ground-state coherence lifetime, thereby decreasing the linewidth of the EIT resonance. The coherence lifetime is often limited by the interaction time of the atoms with the lasers. Common methods for increasing this lifetime are by introducing a buffer gas to confine the atoms Brandt et al., (1997); Wynands and Nagel, (1998); Erhard et al., (2000); Erhard and Helm, (2001), using wall coatings in the cell so that coherence is preserved between successive interactions of the atoms and the lasers Kanorsky et al., (1995); Budker et al., (1998); Budker et al., 1999b ; Robinson et al., (1958); Bouchiat and Brossel, (1966); Alexandrov et al., (2002), and by cooling and trapping the atoms Lipsich et al., (2001); Chen et al., (1998).
We have found that for EIT conditions in a sample with buffer gas (with linewidth on the order of several kHz and group velocity on the order of a few tens to hundreds of meters/sec) the probe field has a slower group velocity when it is blue detuned with respect to resonance and higher group velocity for red detuning. This result is opposite to the intuitive picture described above, and to that of Kocharovskaya et al. in Kocharovskaya et al., (2001).
II Experiment
II.1 Setup
A schematic of the experimental setup is shown in Figure 1. One external cavity diode laser (ECDL) is used as the source of a strong driving field and another as a weak probe. The drive and probe lasers are combined and pass through a cell containing isotopically enhanced 87Rb vapor. The 87Rb density is varied by changing the temperature of the cell. A three layer magnetic shield (MS) screens out the laboratory magnetic field.
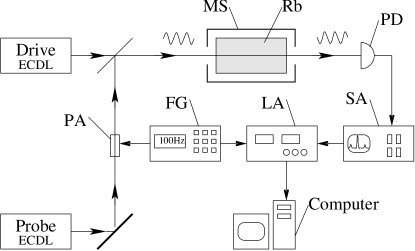
The lasers are phase locked to each other with a frequency offset that is tunable about the ground level hyperfine splitting of 87Rb (6835 MHz). The lasers are spatially mode-matched with a single-mode optical fiber. The drive laser is tuned to the transition of 87Rb and the probe laser is tuned to the transition as shown in Figure 2.
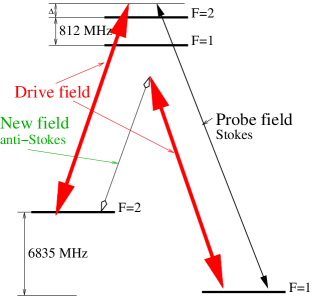
The configuration of drive and probe lasers shown in Figure 2 is called a configuration. In this case, the lasers optically pump all atoms in the desired velocity subgroup into a dark state superposition of the ground levels, giving rise to strong coherence between these lower levels. Scattering of the drive field on this coherence results in the generation of a fairly strong Stokes component (new field) in the medium (shown in Figure 2). The generation of this new field near two-photon resonance of the drive and probe field is described in Ref. Lukin et al., (1997); Kash et al., (1999); Mikhailov et al., (2002).
The transmitted drive and probe fields and the generated Stokes field are detected separately by heterodyne detection on a fast photo detector. This is done by splitting off part of the drive field from the main beam before entering the cell. This component is shifted up in frequency by a small amount (60 MHz), and combined with the beams exiting the cell before the photo-detector. The photo-current thus contains beat signals at various RF frequencies, separated by 60 MHz, in the vicinity of the 6835 MHz separation of the drive and probe. By separately analyzing these components with a spectrum analyzer (SA), we extract the transmitted probe and generated new fields independently. This technique is described in Ref. Mikhailov et al., (2002); Kash et al., (1999).
II.2 Time delay and group velocity measurement procedure.
We extract the group velocity in the medium by modulating the intensity of the probe field before the cell, and observing the time delay before this modulation is observed in the transmitted field. Experiments have been conducted with gaussian shaped (temporal) pulses and with sinusoidal modulation. We find that the delay time is independent of the probe field modulation technique as long as the bandwidth of the modulation does not exceed the transmission linewidth of the EIT resonance.
The modulation is generated by use of a frequency generator (FG) which drives an acousto-optical (AO) modulator in the probe laser. The deflected beam from the AO is blocked, so the AO serves as a probe power attenuator (PA in Figure 1). We also measure the time delay of the generated new field.
With a sinusoidal modulation of the probe, lock-in detection of the transmitted probe field provides a sensitive measure of the time delay due to the medium. When using lock-in detection in this way, we obtain the time delay from the phase shift of the transmitted probe field intensity relative to the probe intensity before the cell. For a sine wave of frequency , this phase shift is given by
| (7) |
where is the time delay introduced by the atoms and is a phase shift introduced by electronics. To eliminate the unknown we measure the phase shift for several different modulation frequencies. The phase shift increases linearly with frequency and the slope of this line is . We extract with a least squares fit. We then find the group velocity by setting where is the length of the cell. ( for our experiment.)
Another experimental technique to simplify the group velocity measurement is to replace the second laser and phase-lock circuitry with an electro-optic modulator (EOM) in the drive laser beam. By applying a narrow tunable microwave signal to the EOM, upper and lower sidebands are generated at the microwave frequency, which we choose to match the 6.835 GHz ground state hyperfine splitting. We tune the laser to the drive transition, so that the upper sideband drives the probe transition and the lower sideband is off resonance. We choose the microwave amplitude to generate a sideband with power that is 1/10 of the drive power. A careful comparison of the two methods (two phased locked lasers versus one modulated laser) shows no difference in the group velocity measurements. We note that a similar technique is to modulate the laser current, which directly creates sidebands on the laser, has also been successfully employed Affolderbach et al., (1999).
We measure the dependence of on one-photon laser detuning , where is the frequency of the drive laser and is the frequency of the transition. During each such measurement, the frequency difference of the probe and drive lasers is kept constant and equal to ground level splitting (6.835 GHz). The drive laser power is , and probe power is . These measurements may then be repeated for different 87Rb densities (different temperatures of the cell).
II.3 Experimental results
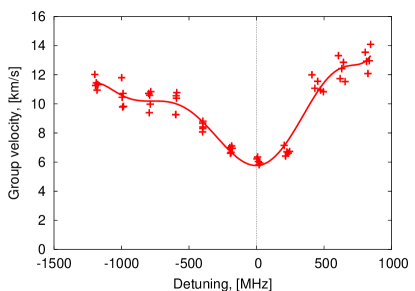
We first consider the case where no buffer gas is used, and the ground-state coherence lifetime is limited by the free-flight transit time of the thermal rubidium atoms through the laser beam. In our experiment, the EIT transmission linewidth is 30 kHz and the resulting group velocity on the order of 10 km/s. Figure 3 shows the dependence of the group velocity as a function of the drive laser frequency in the vicinity of the drive resonance. The group velocity is too large to observe the spatial dispersion effect described in the introduction. Another way to see this is to note that the group velocity is much higher than the mean thermal speed of the atoms. In Figure 3 the drive detuning spans the full range of the upper-state hyperfine splitting, and the small feature on the left of the spectrum is the result of generating EIT on the upper level (see Figure 2).
Next we narrow the transmission linewidth with a buffer gas. This increases the dispersion considerably, resulting in reduced group velocity. Figure 4 shows the group velocity as a function of drive laser detuning for similar conditions as Figure 3 but with the addition of 3 torr of buffer gas. The EIT transmission linewidth is only a few kHz and we see that the group velocity has fallen to below 100 m/s. We also see that increasing the laser beam diameter increases the dispersion and reduces the group velocity as expected.
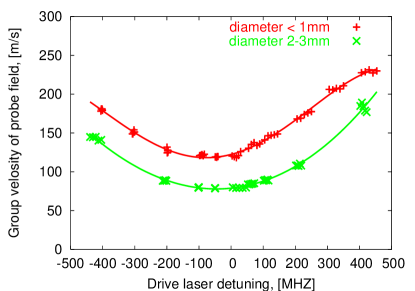
Figure 5 shows how the group velocity depends on drive laser detuning for increasing atomic density. We observe a lowering of the group velocity for higher density, but in no case do we observe a lowering of the group velocity as the drive laser is detuned red of resonance, which we would expect based on the prediction of dragging slow light by atoms moving opposite to the laser propagation direction Kocharovskaya et al., (2001). On the contrary, we see the group velocity increase for negative drive laser detuning, and a minimum group for one-photon detuning about 100 MHz blue of one-photon resonance (see Figure 5).
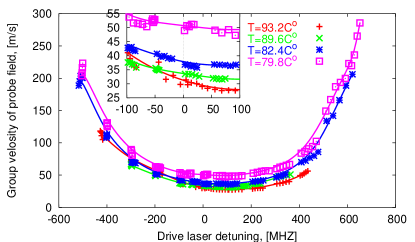
The explanation of this effect is still not clear, but it is plausible that this counter-intuitive behavior is caused by velocity changing collisions in the presence of the buffer gas. We note that when the beam diameter decreases, the group velocity dependence versus one-photon detuning becomes more shifted to the side of negative detuning (see Figure 4). In other words, the behavior becomes less counter-intuitive. We explain this by noting that for a very narrow beam, fewer velocity changing collisions take place before the atom leaves the laser beam. In any case, it is clear that the discussion of Ref. Kocharovskaya et al., (2001) about a quasi mono-velocity beam is not applicable in the case with a buffer gas, since all velocity groups are mixed by velocity changing collisions.
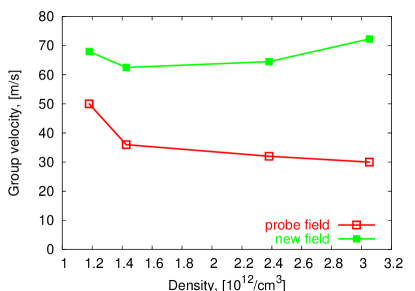
When the density of 87Rb atoms is increased () highly nonlinear interaction of the drive and probe fields leads to very efficient generation of a Stokes component, or new field Lukin et al., (1997); Kash et al., (1999). We can measure the intensity of the generated field as a function of two-photon detuning and find the width to be greater than the transmission width of the EIT resonance of the probe field. (Under the conditions in our experiment it is roughly a factor of two wider Mikhailov et al., (2002).) Correspondingly, we also measure the time delay between modulation of the probe field before the cell and the resulting modulation of the new field after the cell. For the rubidium cell with buffer gas, this delay time is smaller than for the probe field, meaning that the group velocity of the new field () is greater than the group velocity of the probe field (). This is no great surprise since the new field is propagating far from one-photon resonance.
As discussed above, as the rubidium density is increased the probe field group velocity decreases. Similar behavior occurs for the generated new field for low density. However, for large atomic density the group velocity for the new field starts to increase with density. These results are shown in Figure 6. This dependence is connected with a propagation effect. The effective generation of new field occurs in the part of the cell where the group velocity is small. As the light propagates through the cell, the drive field intensity decreases until the new field is decoupled from the probe. After this point, the new field propagates at nearly the vacuum speed of light. Thus the observed average speed of new field increases with atomic density.
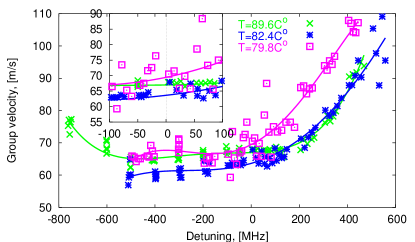
We can also measure the new-field group velocity as a function of drive laser detuning. The results are shown in Figure 7. We find that the the group velocity is smaller for negative one-photon detuning than for positive detuning in vicinity of resonance. This behavior follows the intuitive predictions of Ref. Kocharovskaya et al., (2001).
III Summary.
We observe counter-intuitive dependence of the probe field group velocity versus drive field one-photon detuning for different densities (temperatures) of 87Rb (see Figure 5). The group velocity decreases slightly for blue-detuned drive fields and increases slightly for red-detuned fields. We conclude that the the predictions of Ref. Kocharovskaya et al., (2001) cannot be applied to the case where the EIT linewidth is reduced with a buffer gas, since all velocities are constantly mixing via velocity changing collisions. Unfortunately, without a buffer gas we cannot achieve narrow enough EIT resonances to reach the amount of dispersion needed to get group velocities low enough to observe the effect of dragging the light by atoms.
We find that the group velocity is higher for the generated Stokes field, and that the behavior as a function of detuning is opposite that of the probe field.
IV Acknowledgement
We thank A. B. Matsko, I. Novikova, V. Sautenkov, and M. O. Scully for useful and stimulating discussions. This work was supported by the Office of Naval Research.
References
- Brandt et al., (1997) Brandt, S., Nagel, A., Wynands, R., and Meschede, D., 1997, Phys. Rev. A, 56(2), R1063–R1066.
- Vanier et al., (1998) Vanier, J., Godone, A., and Levi, F., 1998, Phys. Rev. A, 58(3), 2345–2358.
- Erhard and Helm, (2001) Erhard, M. and Helm, H., 2001, Phys. Rev. A, 63(4), 043813–+.
- Lukin et al., (1997) Lukin, M. D., Fleischhauer, M., Zibrov, A. S., Robinson, H. G., Velichansky, V. L., Hollberg, L., and Scully, M. O., 1997, Phys. Rev. Lett., 79(16), 2959–2962.
- Akulshin et al., (1998) Akulshin, A. M., Barreiro, S., and Lezama, A., 1998, Phys. Rev. A, 57(4), 2996 –3002.
- Akulshin et al., (1991) Akulshin, A. M., Celikov, A. A., and Velichansky, V. L., 1991, Opt. Commun., 84(3-4), 139–143.
- Javan et al., (2002) Javan, A., Kocharovskaya, O., Lee, H., and Scully, M. O., 2002, Phys. Rev. A, 66(1), 013805–+.
- Taichenachev et al., (2000) Taichenachev, A. V., Tumaikin, A. M., and Yudin, V. I., 2000, Jetp Lett., 72(3), 119–122.
- Hau et al., (1999) Hau, L. V., Harris, S. E., Dutton, Z., and Behroozi, C. H., 1999, Nature, 397(6720), 594–598.
- Kash et al., (1999) Kash, M. M., Sautenkov, V. A., Zibrov, A. S., Hollberg, L., Welch, G. R., Lukin, M. D., Rostovtsev, Y., Fry, E. S., and Scully, M. O., 1999, Phys. Rev. Lett., 82(26), 5229–5232.
- (11) Budker, D., Kimball, D. F., Rochester, S. M., and Yashchuk, V. V., 1999a, Phys. Rev. Lett., 83(9), 1767–1770.
- Knappe et al., (2001) Knappe, S., Wynands, R., Kitching, J., Robinson, H. G., and Hollberg, L., 2001, J. Opt. Soc. Am. B-Opt. Phys., 18(11), 1545–1553.
- Novikova et al., (2001) Novikova, I., Matsko, A. B., and Welch, G. R., 2001, Opt. Lett., 26, 1016–1018.
- Hakuta et al., (1991) Hakuta, K., Marmet, L., and Stoicheff, B. P., 1991, Phys. Rev. Lett., 66(5), 596–599.
- Hemmer et al., (1995) Hemmer, P. R., Katz, D. P., Donoghue, J., Croningolomb, M., Shahriar, M. S., and Kumar, P., 1995, Opt. Lett., 20(9), 982–984.
- Jain et al., (1996) Jain, M., Xia, H., Yin, G. Y., Merriam, A. J., and Harris, S. E., 1996, Phys. Rev. Lett., 77(21), 4326–4329.
- Zibrov et al., (1999) Zibrov, A. S., Lukin, M. D., and Scully, M. O., 1999, Phys. Rev. Lett., 83(20), 4049–4052.
- Phillips et al., (2001) Phillips, D. F., Fleischhauer, A., Mair, A., Walsworth, R. L., and Lukin, M. D., 2001, Phys. Rev. Lett., 86(5), 783–786.
- Liu et al., (2001) Liu, C., Dutton, Z., Behroozi, C. H., and Hau, L. V., 2001, Nature, 409, 490–493.
- Zibrov et al., (2002) Zibrov, A. S., Matsko, A. B., Kocharovskaya, O., Rostovtsev, Y. V., Welch, G. R., and Scully, M. O., 2002, Phys. Rev. Lett., 88(10), 103601.
- Kocharovskaya et al., (2001) Kocharovskaya, O., Rostovtsev, Y., and Scully, M. O., 2001, Phys. Rev. Lett., 86(4), 628–631.
- Rostovtsev et al., (2002) Rostovtsev, Y. V., Kocharovskaya, O., and Scully, M. O., 2002, Journal of Modern Optics, 49(14/15), 2637–2643.
- Wynands and Nagel, (1998) Wynands, R. and Nagel, A., 1998, Appl. Phys. B, 68, 1 –+.
- Erhard et al., (2000) Erhard, M., Nußmann, S., and Helm, H., 2000, Phys. Rev. A, 62, 061802(R)–+.
- Kanorsky et al., (1995) Kanorsky, S. I., Weis, A., and Skalla, J., 1995, Appl. Phys. B, 60, S165 –+.
- Budker et al., (1998) Budker, D., Yashchuk, V., and Zolotorev, M., 1998, Phys. Rev. Lett., 81, 5788 –+.
- (27) Budker, D., Orlando, D. J., and Yashchuk, V., 1999b, Am. J. Phys., 67, 584 –+.
- Robinson et al., (1958) Robinson, H. G., Ensberg, E. S., and Dehmelt, H. G., 1958, Bull. Am. Phys. Soc., 3, 9 –+.
- Bouchiat and Brossel, (1966) Bouchiat, M. A. and Brossel, J., 1966, Phys. Rev., 147, 41 –+.
- Alexandrov et al., (2002) Alexandrov, E. B., Balabas, M. V., Budker, D., English, D. S., Kimball, D. F., Li, C. H., and Yashchuk, V., 2002, Phys. Rev. Lett, 66, 042903 –+.
- Lipsich et al., (2001) Lipsich, A., Barreiru, S., Valente, P., and Lezama, A., 2001, Opt. Commun., 190(1-6), 185 – 191.
- Chen et al., (1998) Chen, H. X., Durrant, A. V., Marangos, J. P., and Vaccaro, J. A., 1998, Phys. Rev. A, 58(2), 1545 – 1548.
- Mikhailov et al., (2002) Mikhailov, E. E., Rostovtsev, Y., and Welch, G. R., 2002, Journal of Modern Optics, 49(14/15), 2535–2542.
- Affolderbach et al., (1999) Affolderbach, C., Nagel, A., Knappe, S., Jung, S., Wiedenmann, D., and Wynands, R., 1999, Applied Physics B, 70(3), 407 – 413.