Dispersion Compensation for Atom Interferometry
Abstract
A new technique for maintaining high contrast in an atom interferometer is used to measure large de Broglie wave phase shifts. Dependence of an interaction induced phase on the atoms’ velocity is compensated by applying an engineered counter phase. The counter phase is equivalent to a rotation and precisely determined by a frequency, and can be used to measure phase shifts due to interactions of unknown strength. Phase shifts of 150 radians (5 times larger than previously possible) have now been measured in an atom beam interferometer and we suggest that this technique can enable comparisons of atomic polarizability with precision of one part in 10,000.
pacs:
03.75.Dg, 39.20.+qAtom interferometers are now precision tools for measuring interactions that cause a differential phase shift between atom waves in two separated paths. For example, measurements of platform rotation Lenef et al. (1997); Gustavson et al. (1997) and acceleration Peters et al. (1999, 2001), gravity gradients McGuirk and Kasevich (2002), and atomic polarizability Ekstrom et al. (1995) have each been made using atom interferometers to directly measure a corresponding atomic de Broglie wave phase shift. The precision of these measurements made with cw atom beams can be improved by compensating for dispersion. Dispersion, i.e. a correlation between atom wavelength and phase shift, has limited the interferometer in Lenef et al. (1997); Ekstrom et al. (1995) to a maximum of 35 radians of interaction induced phase shift before contrast is reduced by . In ref Gustavson et al. (1997) a rotation induced phase of 10 radians could reduce the contrast by . Here we present a new technique to maintain high contrast while studying large de Broglie wave phase shifts without reducing atom flux. It consists of two separated regions that induce time-dependant phases in a way that the net applied phase depends on the atom’s velocity. We shall describe this technique and show that it is equivalent to rotation at an accurately known angular frequency.
The source of contrast loss addressed here comes from the experimental spread in atomic velocity combined with dispersion. Most interactions are dispersive because the interaction induced phase shift, or interaction phase, depends on velocity to some power: . The factor equals for interactions with phase shifts that depend on transit time, such as platform rotation or uniform fields applied to one arm of an interferometer. The factor equals for gravitationally induced phase shifts and also for electric or magnetic field gradients across an interferometer made with gratings. For , a spread in velocity leads to an inhomogeneous phase and hence a loss of contrast. Under such circumstances the statistical power in a measurement of interaction strength is optimized at a rather small interaction phase. For a Gaussian atomic velocity distribution, this phase is: , where is the average and is the r.m.s. width of the velocity distribution. The supersonic atom beam in ref Lenef et al. (1997); Peters et al. (2001) has , which limits the most sensitive measurements to an interaction phase of 25 radians.
Dispersion compensation enables measurements of much larger interaction induced phase shifts. We demonstrate this by using an engineered counter phase to cancel dispersion, and regain high contrast. The technique has many advantages for precision measurements of an interaction strength—a very large interaction phase can now be measured, all the atom flux is used, and the need to precisely measure the velocity of the atoms is eliminated. It is a quantum extension of the classical velocity multiplexing technique that used mechanical choppers to modify the velocity distribution of the beam Hammond et al. (1995).
In an earlier proposal, Clauser Clauser (1988) noted that a magnetic field gradient can compensate for gravitationally induced phase shifts. This idea in essence measures one interaction in terms of another, the overall error being a combination of the two errors separately. In contrast, the counter phase used here is determined by a frequency that can be set to a precisely known and stable value. Our technique is more closely related to methods developed in Kasevich and Chu (1992) and used in Gustavson et al. (1997); Peters et al. (1999, 2001); McGuirk and Kasevich (2002) where dispersion compensation is achieved by moving the gratings to simulate platform rotation or acceleration.
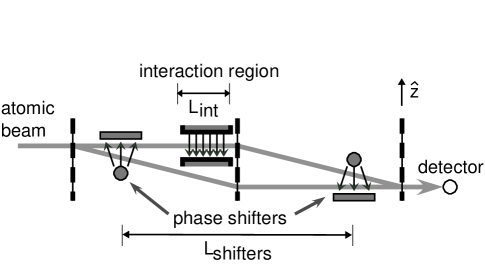
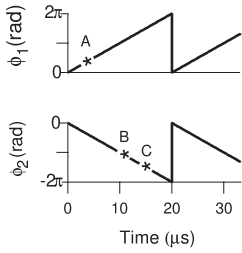
To create the counter phase, two phase shift regions spaced a distance apart are used to produce differential phase shifts between the arms of the interferometer (Fig. 1). They apply a saw-tooth ramp — increasing the applied phase linearly from zero to and then abruptly returning to zero—with frequency . The phase shifts must be opposite in sign, as shown in Figure 2 and can be represented, modulo , as
| (1) |
The sum of these phase shifts makes the counter phase (modulo ):
| (2) |
Importantly the total counter phase depends on the atom’s time of flight between the two phase shifters, i.e. it has dispersion, but is independent of time. The dispersion scales with ramp frequency, hence it can compensate for a dispersive interaction of any strength. Fidelity of the two phase shifts to Eq. 1 becomes less critical when the ramp frequency is large as is discussed later.
The cancellation of dispersive effects in principle works perfectly if the interaction phase is proportional to . One type of interaction is a region of uniformly different potential of length on one interferometer arm. The change in energy, , for an atom inside the field is the same for atoms of all velocities, but the phase shift caused by the interaction depends on the transit time of the atom passing through the region:
| (3) |
With this interaction alone, a spread in velocity from the atom source creates a spread in that destroys the contrast of the interference fringe and limits the size of that can be measured. By adding the counter phase, the total phase shift is:
| (4) |
At the rephasing frequency, the total phase shift is zero for all velocities. There is no net dispersion, and the fringe contrast should be ideal.
This method of rephasing the interference pattern can dramatically improve a precision measurement of atomic polarizability such as was made with the MIT interferometer Ekstrom et al. (1995). We can now apply an interaction phase shift exceeding 150 radians for best signal to noise, compared with 25 radians previously. Furthermore, instead of measuring the atom beam velocity (and velocity distribution) and then modelling the phase shift, we need to measure only the ramp frequency and the distance . In this proof-of-principle experiment, these advantages make it possible to determine the polarizability of sodium atoms with the same statistical precision as Ekstrom et al. (1995) in the time.
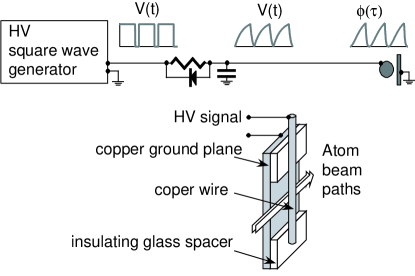
We have implemented the phase shifters by using small regions of electric field gradient that create a phase shift by exposing each path of the interferometer to a different field. The gradient field is produced by a charged cylinder with radius mm at a voltage of kV. The paths of the interferometer pass between the cylinder and a ground plane, which is a distance mm from the cylinder axis (Fig. 3). The phase difference between the paths (separated by distance m) is
| (5) |
where is the average distance of the two paths from the cylinder axis and is the polarizability of the atoms. The two cylinders are oriented on opposite sides of the interferometer so that they can apply opposite relative phases as required by Eq. 1. To create a linear ramp in phase, a voltage must be applied to the cylinders with time dependence . We approximate this ideal square-root shape in time by filtering a rectangle-wave high voltage (with duty cycle ) using an circuit. During the off-cycle a diode drains the capacitor, quickly returning the voltage to zero. Using this voltage waveform, the phase produced by the gradient fields ramps approximately linearly from 0 to during the on cycle:
| (6) |
The parameter , proportional to the strength of the gradient field, can be changed by adjusting the amplitude of the square wave or the position of each cylinder. Setting to rad and best approximates the perfect ramp defined by Eq. 1. High fidelity to Eq. 1 is not required if the ramp frequency is much larger than the inverse time of flight between the two phase shifters, since the deviation in phase is small compared to the additional phase of corresponding to ramp cycles.
Applied to the measurement of polarizability Ekstrom et al. (1995), the phase shifters are used in conjunction with an interaction phase produced by a parallel plate capacitor (with voltage difference and plate separation ) that makes a constant electric field surrounding one path of the interferometer for a length . The change in energy of an atom in the electric field (with magnitude ) is given by the polarizability :
| (7) |
To determine , the phase-shifted interference pattern is measured as oscillating atom beam intensity versus the transverse position of one grating. For atoms of velocity , the interference pattern without a counter phase is
| (8) |
where is the average intensity, is the amplitude of the fringe, and is the grating wavevector. The measured interference pattern is a weighted average over the velocity distribution (which is approximately Gaussian with , where is the average velocity (1-2 km/s) and is the rms velocity width):
| (9) |
where the phase and contrast are
| (10) |
With the phase shifters and the interaction region both on, the phase and contrast of the resulting interference pattern are:
| (11) |
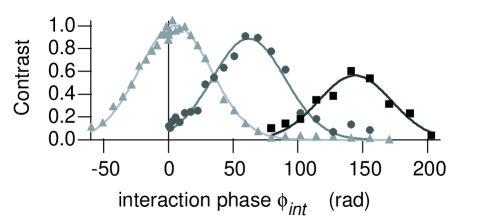
Note this is merely a shifted Gaussian that has the same width independent of ramp frequency. In principle the peak contrast remains .
Measurements of contrast vs. interaction phase (Fig. 4) were made with the phase shifters ramping at fixed frequencies: 0, 17.0, and kHz. A revival in contrast occurs when . However, the maximum rephased contrast is less than the ideal 100% because of imperfections in the phase shifters such as non-linearity of the implemented phase ramp Eq. 6. The rightmost curve () in Fig. 4 demonstrates that polarizability can now be measured at an interaction phase as large as 150 rad.
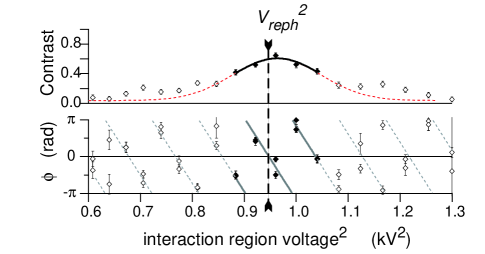
Polarizability can be determined using this technique by finding the parameters at which the total phase is exactly zero. Then, there is high contrast, and no explicit dependance on velocity:
| (12) |
Phase measurements are shown in Fig. 5 and are fit to a line whose zero crossing determines . Then the polarizability is:
| (13) |
The precision of the polarizability measurement depends on the precision with which the interaction phase can be measured, and also on :
| (14) |
While the statistical uncertainty in phase grows as the contrast is lost, , the fractional error in polarizability is reduced by making the interaction phase larger.
Without the counter phase (e.g. in the leftmost curve () of Fig. 4) the best signal-to-noise ratio occurs at an interaction phase of radians. Precision in here is 800 mrad, which makes us require roughly 300 sec of measurement time to achieve a fractional precision in polarizability of .
With the counter phase we achieve the same 0.2% statistical precision in with only 20 sec of measurement. The ten phase measurements used in the linear fit ( data points in Fig. 5 constitute a total of 20 sec of measurement, and the resulting uncertainty in the interaction phase is mrad, while the interaction phase itself is rad. Thus, the fractional uncertainty in polarizability is . Using the contrast revival demonstrated at rad, it should be possible to measure the interaction phase to statistical precision with 50 minutes of data.
Sources of systematic error include uncertainty in , the calibration of the phase shifts , and the dimensions of the interaction region. (The frequency can be determined essentially without errors.) The distance is on the order of m and can be measured to one part in with a ruler, or much better if measured interferometrically. The most difficult new systematic errors to analyze stem from deviations in the ramped phase from the ideal form in Eq. 1. If the ramp maxima deviate from by but are at least symmetric, i.e. , the corresponding error in is smaller than by a factor equal to . This is because each time returns to zero during an atom’s time of flight, it is equivalent to adding a precise integer times to the counter phase. However, if the error in phase will be:
| (15) |
where represents an average over one period of the ramp signal Roberts (2002). To correct for this, was measured in steady state, i.e. with , and both phase shifters on.
The dispersion compensation technique presented here eliminates two of the three major sources of uncertainty that limited the precision in obtained in Ekstrom et al. (1995) (i.e. contrast loss and uncertainty in the velocity distribution). However a measurement of sodium’s polarizability at the level will still be difficult due to uncertainty in the geometry of the interaction region. To attain precision in the parameter in Eq. 13, the dimensions must be measured to within meters and the electric field modelled very accurately. New techniques can meet these requirements Roberts (2002). However, by measuring the the ratio of polarizabily of two alkali atoms using the same interaction region and phase shifters, uncertainties in all the geometrical lengths (, , and ) will be common to both so the resulting ratio of polarizabilities will be limited only by statistical errors if the atoms traverse the same path through the interaction region.
Used as a Sagnac gyroscope the interferometer is also sensitive to rotations which create a -dependent phase shift:
| (16) |
where is the rotation rate and is the distance between the interferometer’s gratings, and is the wave number of the gratings Lenef et al. (1997); Gustavson et al. (1997). Our technique exactly cancels such dispersion and may therefore be regarded as equivalent to physically rotating the interferometer. Thus, one could servo the engineered phase and use the integral of the rephasing frequency as a measurement of accumulated angular displacement.
The rephasing technique will also work to some extent for interactions with any velocity dependence, . For example, the interaction phase with optimum signal to noise can be increased by the factor since
| (17) |
is allowed by using the counter phase presented here.
In conclusion, we have demonstrated a new method to maintain high contrast of the interference pattern while studying large de Broglie wave phase shifts in an atom interferometer. The method will be of immediate benefit to new precision measurements of atomic polarizability. In addition, the technique should serve to restore contrast in any experiment where the path length difference grows larger than the atomic coherence length.
References
- Lenef et al. (1997) A. Lenef, T. D. Hammond, E. T. Smith, M. S. Chapman, R. A. Rubenstein, and D. E. Pritchard, Phys. Rev. Lett. 78, 760 (1997).
- Gustavson et al. (1997) T. Gustavson, P. Bouyer, and M. Kasevich, Phys. Rev. Lett. 78, 2046 (1997).
- Peters et al. (1999) A. Peters, K. Chung, and S. Chu, Nature 400, 849 (1999).
- Peters et al. (2001) A. Peters, K. Chung, and S. Chu, Metrologia 38, 25 (2001).
- McGuirk and Kasevich (2002) F. J. S. M. McGuirk, J.M. and M. Kasevich, Phys. Rev. A 65, 033608 (2002).
- Ekstrom et al. (1995) C. R. Ekstrom, J. Schmiedmayer, M. S. Chapman, T. D. Hammond, and D. E. Pritchard, Phys. Rev. A 51, 3883 (1995).
- Hammond et al. (1995) T. D. Hammond, D. E. Pritchard, M. S. Chapman, A. Lenef, and J. Schmiedmayer, Appl. Phys. B-Lasers Opt. 60, 193 (1995).
- Clauser (1988) F. Clauser, Physica B 151, 262 (1988).
- Kasevich and Chu (1992) M. Kasevich and S. Chu, Appl Phys B 54, 321 (1992).
- Roberts (2002) T. D. Roberts, PhD thesis, MIT (2002).