Photostable single-photon emission from self-assembled nanocrystals of polycyclic aromatic hydrocarbons
Abstract
Quantum technologies could largely benefit from the control of quantum emitters in sub-micrometric size crystals. These are naturally prone to the integration in hybrid devices, including heterostructures and complex photonic devices. Currently available quantum emitters sculpted in nanocrystals suffer from spectral instability, preventing their use as single photon sources e.g., for most quantum optics operations. In this work we report on unprecedented performances of single-photon emission from organic nanocrystals (average size of hundreds ), made of anthracene (Ac) and doped with dibenzoterrylene (DBT) molecules. The source has hours-long photostability with respect to frequency and intensity, both at room and at cryogenic temperature. When cooled down to , the 00-zero phonon line shows linewidth values () close to the lifetime-limit. Such optical properties in a nanocrystalline environment make the proposed organic nanocrystals a unique single-photon source for integrated photonic quantum technologies.
keywords:
nanocrystals, single-photon sources, quantum emitters, single molecule spectroscopy, organic moleculesCNR-INO, Istituto Nazionale di Ottica, Via Carrara 1, 50019 Sesto F.no, Firenze, Italy \alsoaffiliationLENS and Università di Firenze, Via Carrara 1, 50019 Sesto F.no, Firenze, Italy \alsoaffiliationCNR-INO, Istituto Nazionale di Ottica, Via Carrara 1, 50019 Sesto F.no, Firenze, Italy \alsoaffiliationLENS and Università di Firenze, Via Carrara 1, 50019 Sesto F.no, Firenze, Italy \alsoaffiliationQSTAR, Largo Fermi 2, I-50125 Firenze, Italy \alsoaffiliationLENS and Università di Firenze, Via Carrara 1, 50019 Sesto F.no, Firenze, Italy \alsoaffiliationQSTAR, Largo Fermi 2, I-50125 Firenze, Italy \abbreviationsIR,UV
![[Uncaptioned image]](/html/quant-ph/0303005/assets/Fig/toc9X3.png)
The ubiquitous deployment of nanocrystals (NCs) in photonics stems from the impressive tunability of their physical and chemical properties, combined with the nano-positioning opportunities offered by support-free colloids and from the possibility of mass-production at low costs 1. These features have also promoted NCs as efficient biological markers for imaging 2, 3, color filters in liquid crystal displays 4, as well as functionalizing elements in light emitting and light harvesting devices 5. On the other hand, advanced nanophotonic applications are emerging based on the generation, manipulation and detection of single photons 6, 7. Indeed, leveraging single-photon statistics and quantum coherence for sub-diffraction imaging 8, quantum cryptography9, simulation 10, enhanced precision measurements and information processing 11 have become roadmap targets for the next 10-20 years 12. Single-photon sources based on quantum emitters hold promise for these applications because of their on-demand operation 13, 14, 15, 16, 17. However, despite great efforts in the last years to attain controllable sources by coupling solid-state emitters to nanophotonic structures, each platform privileges either the freedom in the device design 18, 19, 20, 21, 22, 23 or the quality of single-photon emission 24, 25. Deterministic positioning and control of quantum emitters remains elusive for epitaxial quantum dots 26, 27, 28, 29, color centers in bulk diamond 30, 31 and organic molecules in crystalline matrices 32, 33, 34, 35. On the other hand, versatile approaches based on today-available NCs present important shortcomings with respect to single-photon applications. Photoinduced charge rearrangements in the passivation layer and in the environment of inorganic semiconductors quantum-dot NCs 36, 37 lead to spectral instability of the exciton line 38, hindering basic quantum optics operations with the emitted photons. Moreover, intermittence in the photoluminescence 39, named blinking, seriously affects the average fluorescence quantum yield and hence the photon state purity. Although important results have been obtained by improving synthesis protocols 40 or introducing perovskite materials 41, 42, the emitter photostability in time or frequency is still below expectations. Notably, similar issues characterize the emission of color centres in nanodiamonds, including those which possess superb optical properties in bulk such as the widely studied negatively charged silicon vacancy 43, 16, or chromium-related defects 44. Hence, despite the wealth of materials and protocols, there still are fundamental limitations for the use of NCs in single-photon applications.
We here propose and report on self-assembled and support-free organic NCs (hundreds in size) of anthracene doped with single fluorescent dibenzoterrylene molecules (DBT:Ac). We demonstrate that the remarkable features of the bulk system 45, 46, 47, belonging to the family of Polycyclic Aromatic Hydrocarbons (PAH), are preserved in a nanocrystalline environment. In particular, DBT:Ac NCs exhibit bright and photostable single-photon emission at room temperature that is spectrally stable and almost lifetime-limited () at cryogenic temperatures. The combination of such properties is unique and opens the way to the use of organic NCs for quantum technologies and for single-photon applications in general.
1 Results and discussion
We adapted a simple, cost-effective and well-established reprecipitation method 48, 49, 50, 51 to grow Ac NCs doped with controlled concentration of DBT molecules (for details see the Experimental Section). In this procedure, a dilute solution of the compounds prepared with a water-soluble solvent (acetone, in our case) is injected into sonicating water where it divides into many droplets. The solvent gradually dissolves and correspondingly the concentration in the micro-doplets becomes super-saturated until the compounds, which instead are not water-soluble, are reprecipitated in the form of NCs. The size and shape of the resulting NCs can ideally be controlled by varying the thermodynamic conditions 52.
For morphological and optical characterization, a drop of the suspension of NCs in water is deposited on a coverglass substrate and dried in desiccator. Typical scanning electron microscopy (SEM) and atomic force microscopy (AFM) images are displayed in Figures 1a and 1b, respectively. For some NCs it is possible to identify peculiar features of crystalline Ac - such as the hexagonal-like morphology - while others exhibit a round-like shape, possibly due to a few acetone-rich solvent cage. By analysing the AFM images of 92 NCs (Figure 1d), we deduce an average equivalent diameter of () and an average thickness of () , compatible with a platelet-like shape. Such values and shape are particularly promising for the coupling to evanescent fields in proximity to surfaces 35.
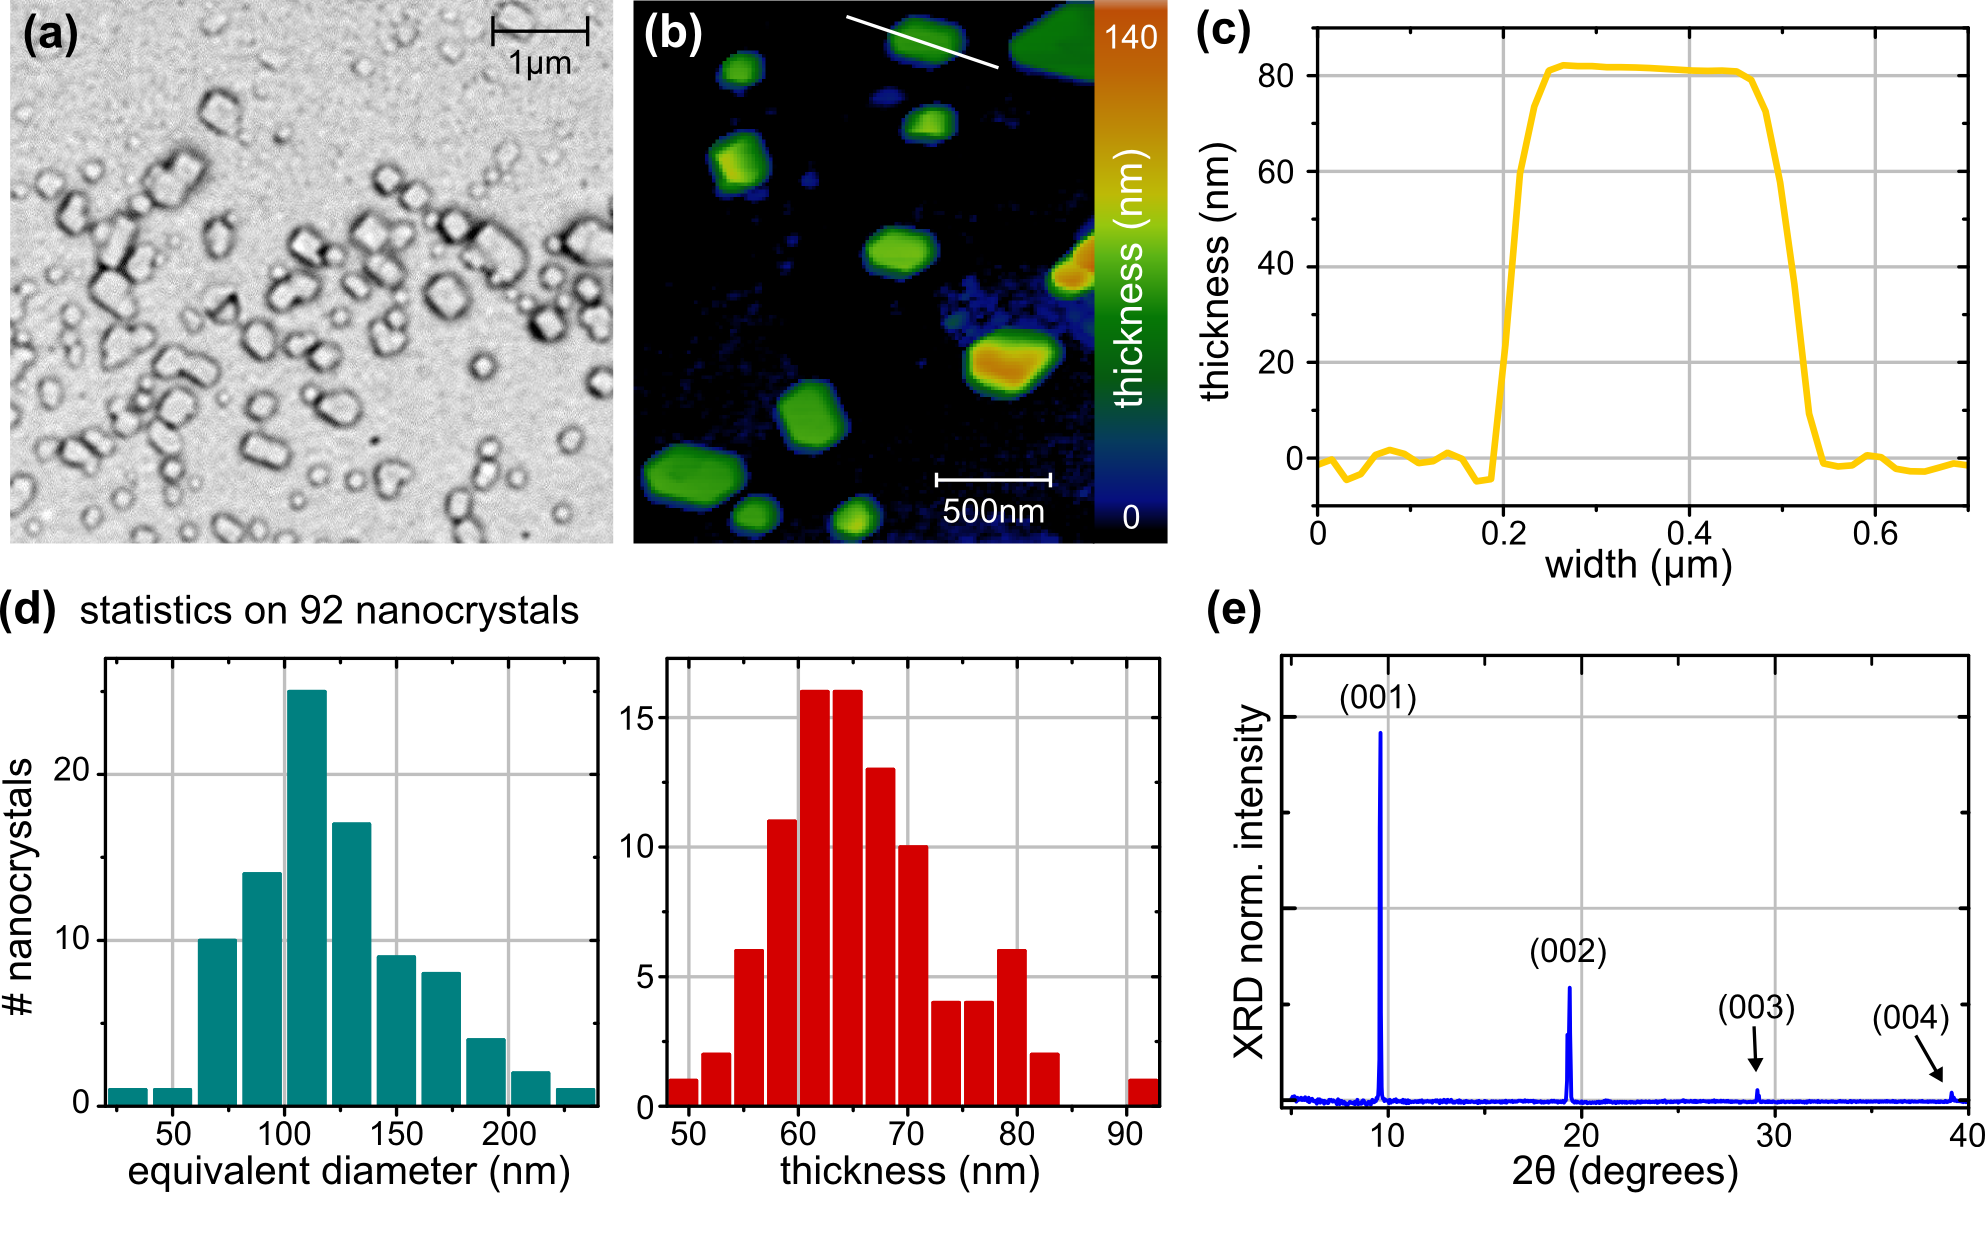
The crystalline nature suggested by the clear-cut edges and flat surfaces (see Figure 1c) is verified by X-ray diffraction (XRD) measurements. The XRD pattern shown in Figure 1e exhibits a strong diffracted peak at - that corresponds to the (001) plane - and other equivalent periodic peaks corresponding to the (002), (003), and (004) planes, matching the crystallographic data for an anthracene monoclinic system 53. This also reveals that the Ac NCs, once deposited on the substrate, are mainly iso-oriented with the c-axis perpendicular to the substrate. Let us note that the transition dipole moment of a DBT molecule in the main insertion site of an Ac crystals is mostly oriented along the b-axis 54, and thus results parallel to the substrate.
The sub-micrometric size of the crystalline matrix may compromise the optical properties of DBT molecules embedded therein, due to strain within the crystal and imperfections at the interfaces. Indeed, besides the case of quantum dots, it was reported for other nanocrystalline systems that such effects determine fluorescence instability and linewidth broadening55, 43. We thus perform single molecules microscopy and spectroscopy on DBT:Ac NCs with a home-built epifluorescence scanning confocal microscope - described in details in the Experimental Section 3 - that allows for both room and cryogenic temperature investigation.
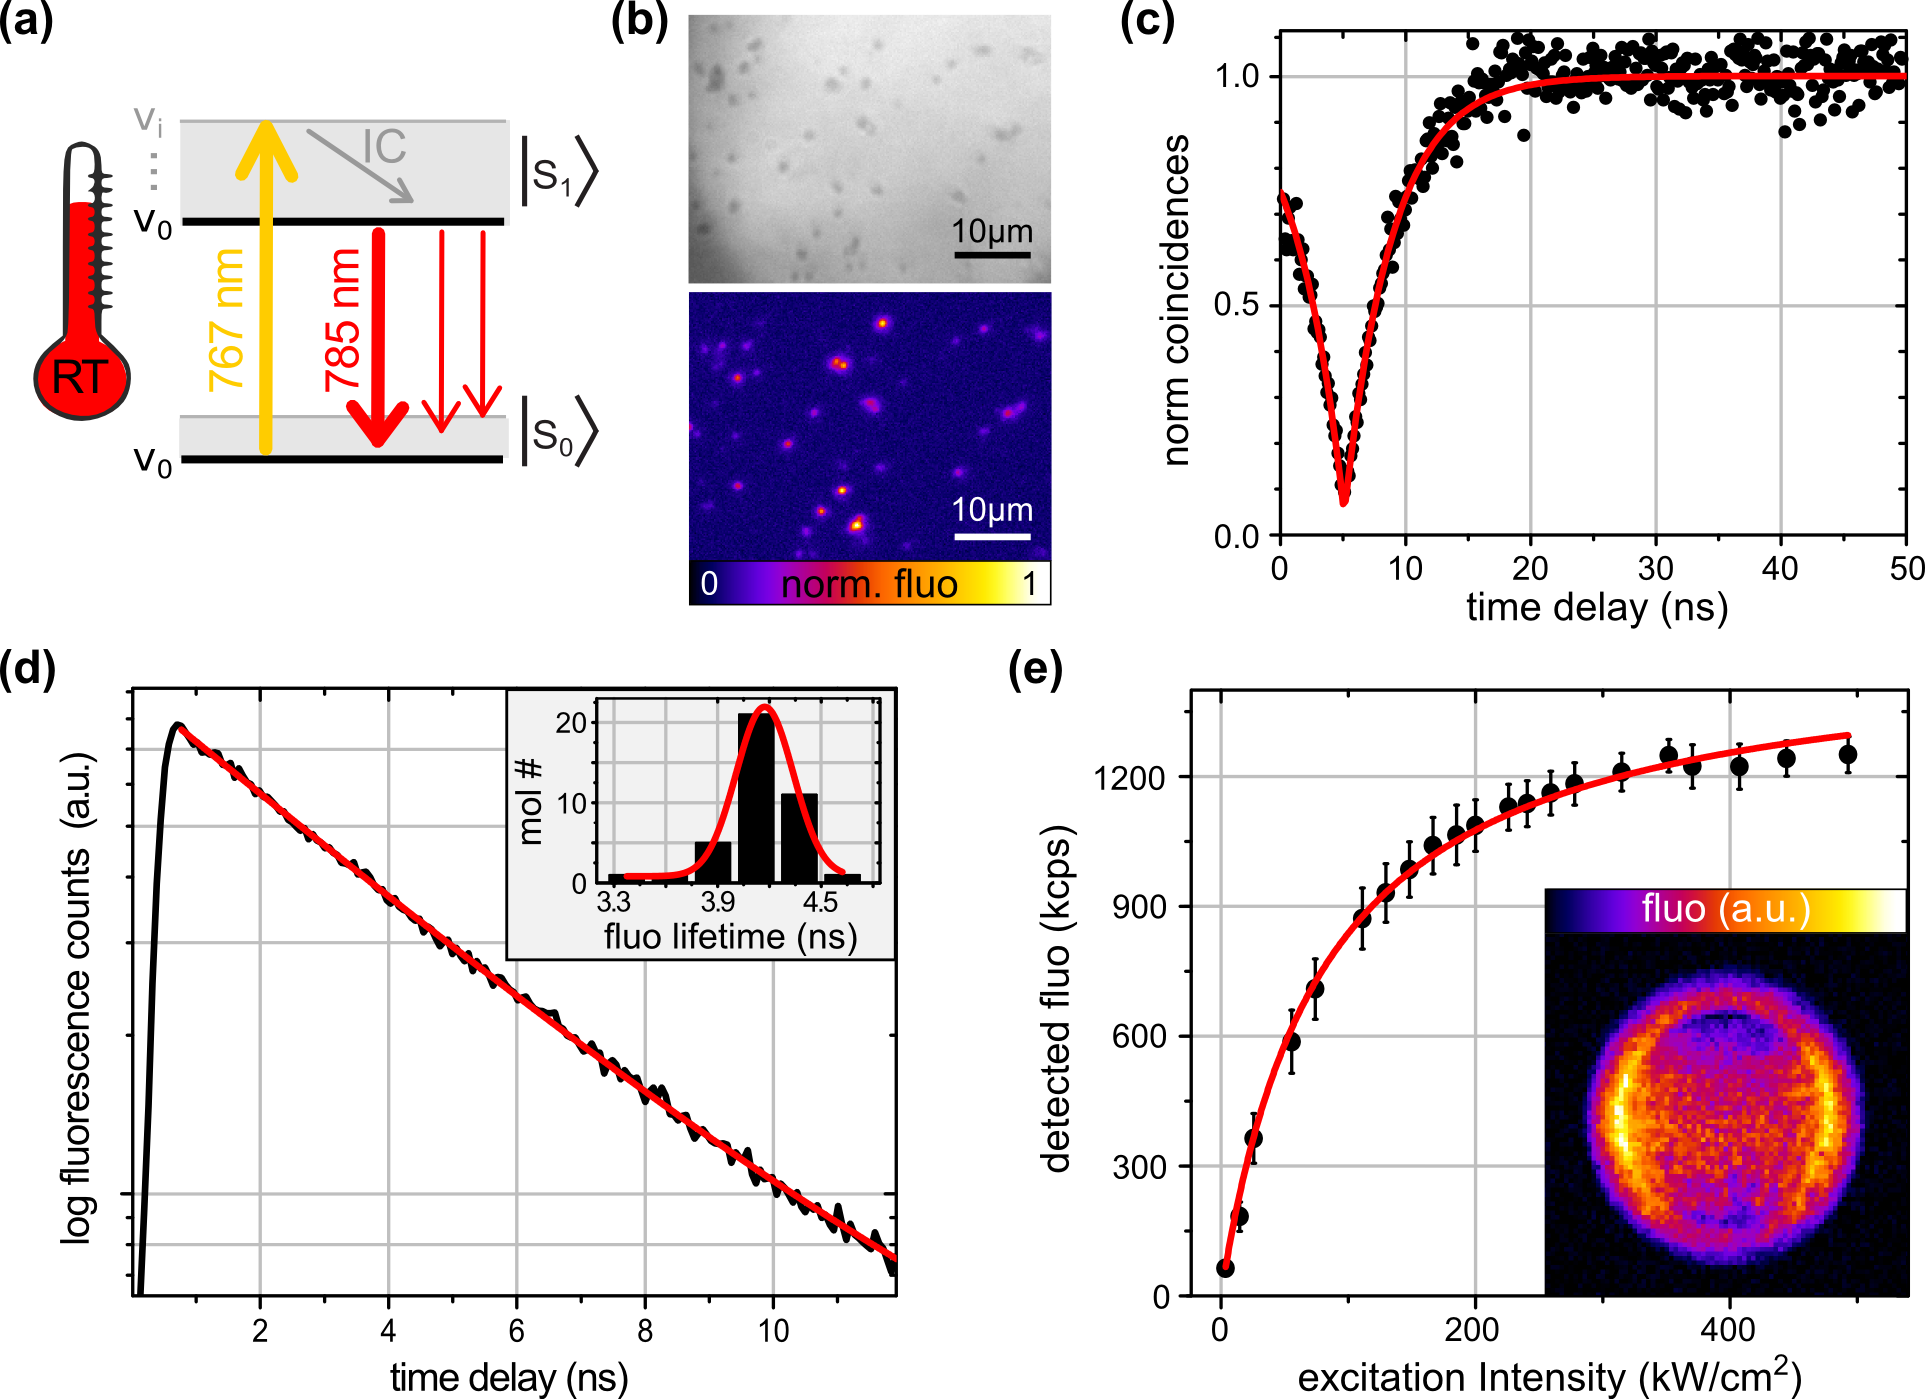
At room temperature (RT), the sample is illuminated with a continuous wave (CW) diode laser to pump DBT molecules into the vibrational band of the first singlet electronic excited state (see the simplified Jablonski diagram in Figure 2a). After a fast (ps-timescale) non radiative relaxation process to the lowest level of the vibrational manifold, molecules decay to the electronic ground state (singlet). The resulting red-shifted fluorescence light around is detected with an electron multiplied charge couple device (EMCCD). Typical white light and wide-field fluorescence images are compared in Figure 2b, showing that more than 90% of the Ac NCs are successfully doped with DBT. To prove that the detected fluorescence stems from individual DBT molecules, single isolated crystals are illuminated in confocal mode with an excitation intensity of (well below saturation) and the correlation between photon arrival times is measured with the Hanbury Brown-Twiss (HBT) setup (see the Experimental Section). Figure 2c shows the histogram of the observed coincidences from a single NC, featuring a strong antibunching dip. The experimental data is fitted at short time delays with the function , where accounts for the excitation and spontaneous emission rates 47 and , the dip depth, is found to be %. Among 40 analyzed NCs, 73% of them displays an antibunching dip larger than 50%, demonstrating that the proposed recipe is reliable to grow individual Ac NCs in 2/3 of cases doped with single DBT molecules. The purity of this system, i.e. the second-order correlation function at zero time delay , can be as low as without any background correction.
To gain further information on the emitter properties, we study the relaxation dynamics by means of time-correlated single-photon counting (TCSPC) measurements, collecting photons emitted after Ti:Sa-pulsed excitation (average intensity equal to ) with a single-photon avalanche diode (SPAD). Figure 2d shows a typical measured fluorescence decay curve from which the lifetime of the excited state can be derived via a single exponential fit in the presence of a constant background. The fit (red curve) yields an excited state lifetime of . Repeating the measurement on 40 NCs we obtain the distribution for the excited-state lifetime shown in the inset of Figure 2d, which can be fitted with a Gaussian centered at with full width at half maximum (FWHM) of , in agreement with previous studies on the bulk system 45, 56, 57.
The brightness of the NC-based single-photon source is quantified by studying the saturation behavior of the system, non-resonantly pumped with the -CW laser. Measurements are performed at different excitation intensities, scanning the sample under the confocal laser spot in the small region where the NC is located and detecting the red-shifted fluorescence with a single SPAD. From the obtained fluorescence maps the mean value within an area around the brightest pixel is extracted and corrected for the background counts, which is the mean value within an area out of the NC and is linear with the laser power. Data are plotted as a function of the laser intensity (black dots in Figure 2e) and fitted with the function describing the saturation of the photon detection rate 58:
| (1) |
with the saturation intensity and the maximum detected count rate. For the molecule reported in Figure 2e the fit-procedure yields as free fitting parameters with the relative standard errors and a maximum detected count rate Mcps. These can be considered as typical values. Accounting for the quantum efficiency of the SPAD, , the measured corresponds to a collected photon rate of at the detector. Moreover, comparing this value with the theoretical one of related to the measured lifetime through the relation and assuming unitary quantum yield, we estimate a total collection efficiency of our setup at RT to be around 1%, ascribed to the limited numerical aperture of the optics and their transmission combined with the molecule emission profile 34.
In order to determine the alignment of DBT molecules within the Ac NCs, the emission from single molecules is detected by imaging the objective back focal plane (BFP) from which the angular radiation pattern can be deduced 59. A typical BFP image is shown in the inset of Figure 2e, where the emission pattern features two side lobes facing each other beyond the critical angle, corresponding to the coupling between the evanescent wave in air with the propagative wave in the coverglass. The geometry and the direction of the two lobes confirms a horizontally aligned molecule, compatible with the XRD observations.
To conclude on the observed photophysical properties of the DBT:Ac NCs at RT, let us note that the repeated excitation of the same molecule to study its saturation behavior is a qualitative proof of the stability of its fluorescence. After several hours of measurements at RT, though, some molecules start exhibiting fluorescence blinking behavior, typically before they stop to fluoresce completely. This so-called photobleaching is most probably due to chemical reactions of the dye molecule with ambient oxygen 60, a process that is more likely to occur in conjunction with the sublimation of Ac at RT. For sub-micrometric crystals we observe that sublimation at RT takes place on a time-scale of about one day but it is completely suppressed when covering the sample with a thin layer of a water-soluble polymer, such as poly(vinyl alcohol).
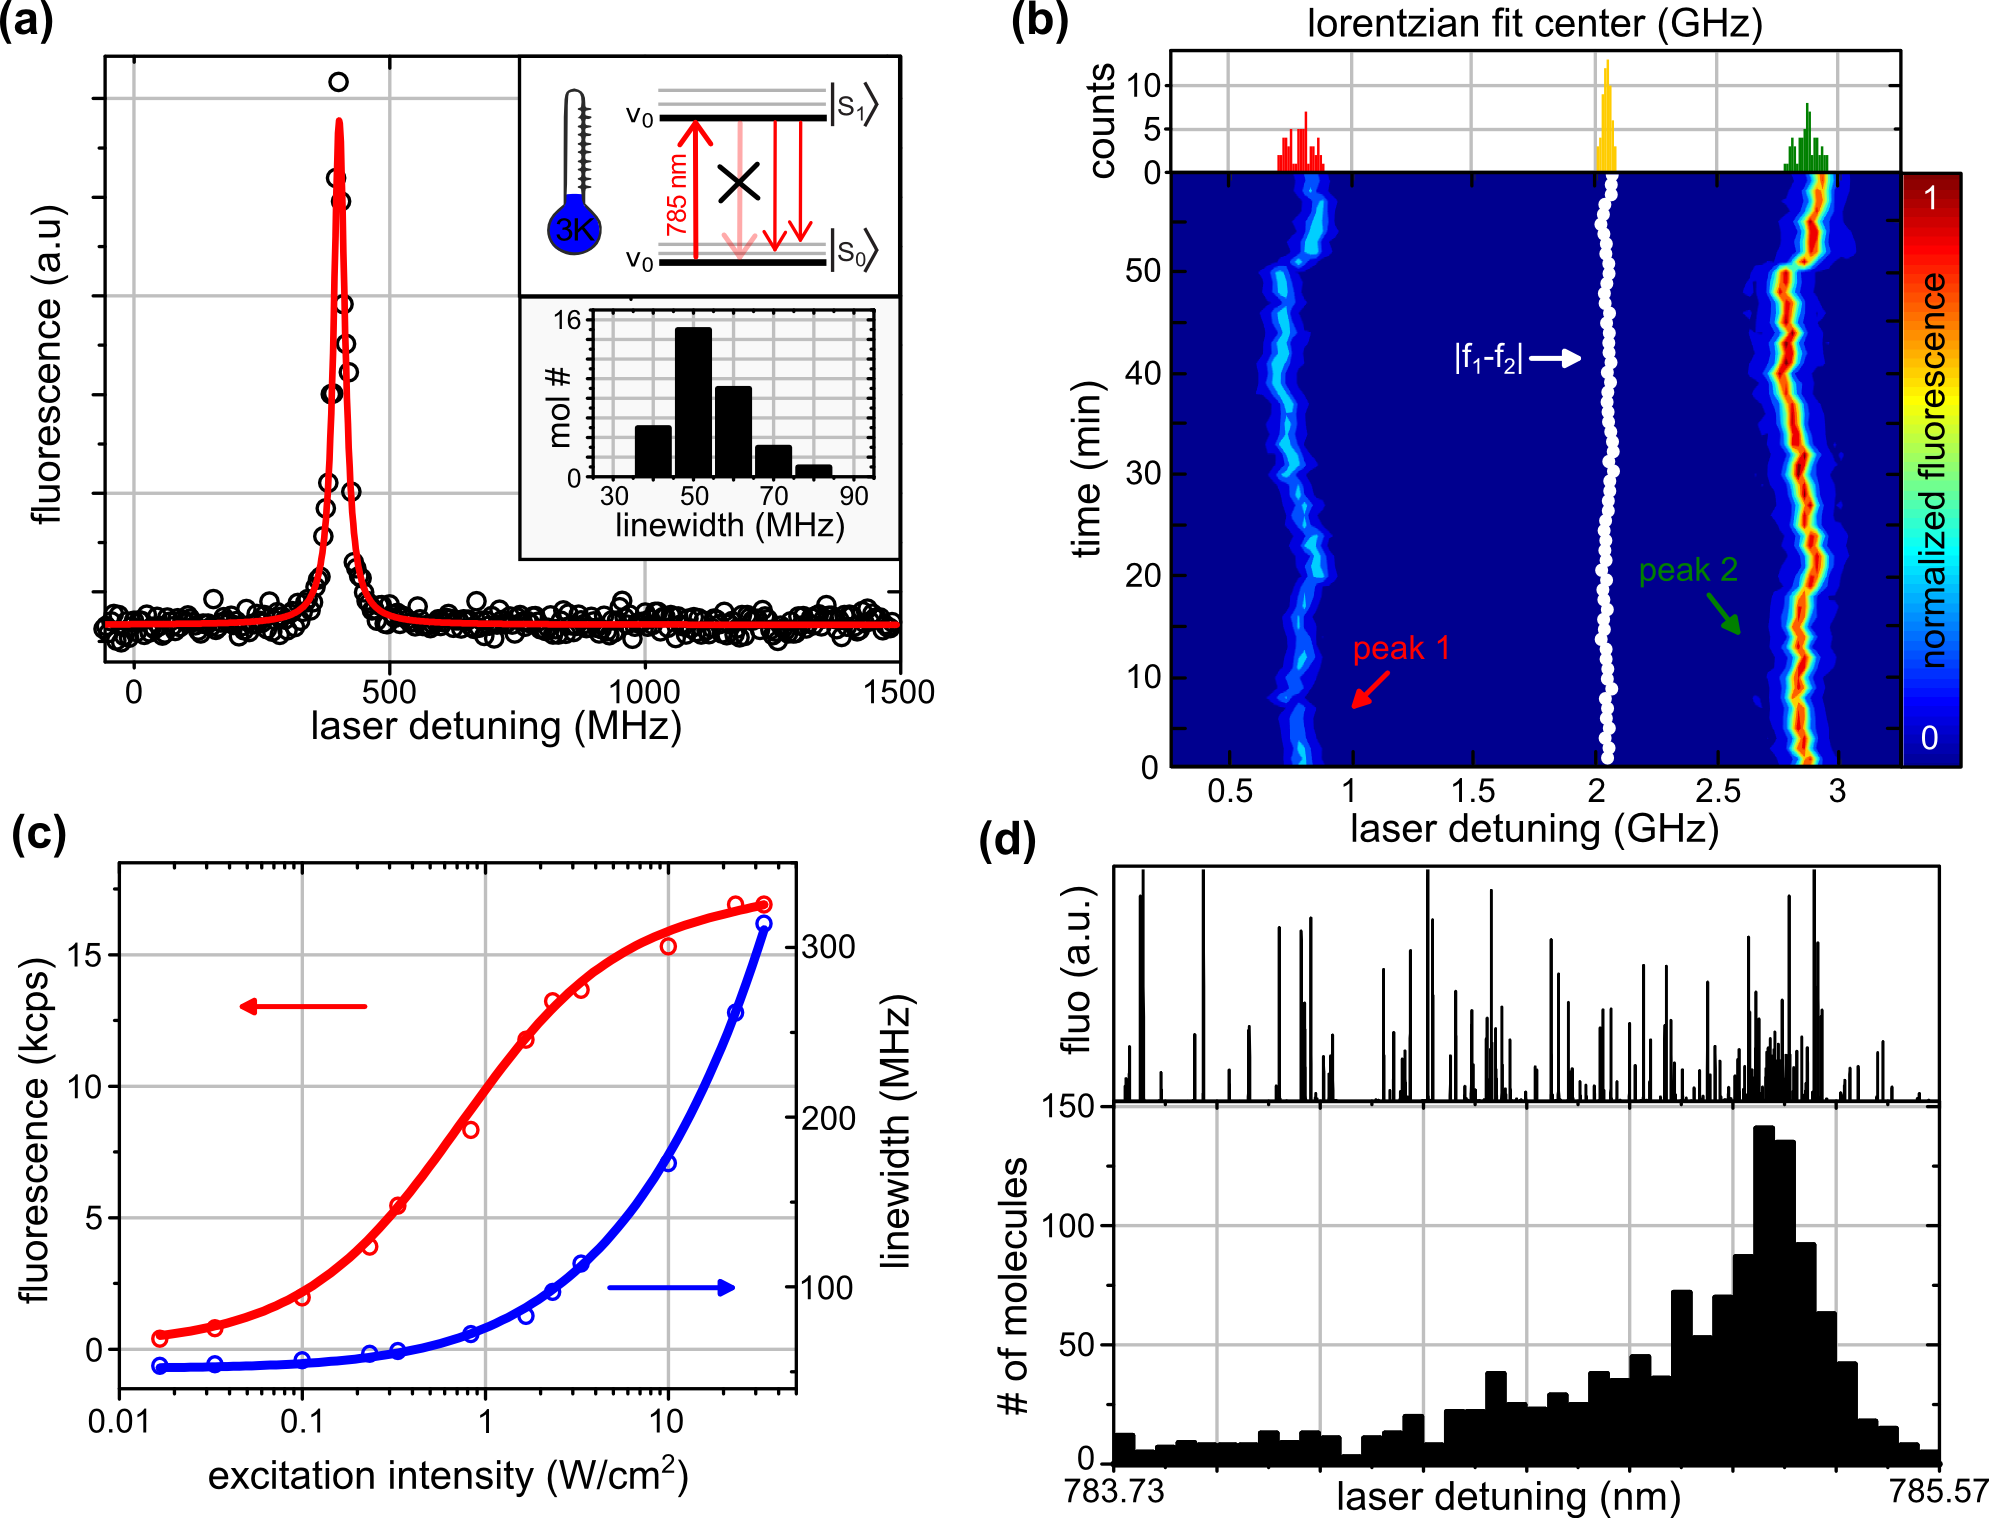
At cryogenic temperatures, highly doped DBT:Ac NCs are studied under resonant excitation of the so-called 00-Zero Phonon Line (ZPL) (). In this pumping scheme, sketched as an inset of Figure 3a, single DBT molecules can be addressed spectrally one at a time by tuning the frequency of a narrow-band laser and exploiting the inhomogeneous distribution of the molecular resonances. In fact, depending on the host matrix, the ZPLs of PAH molecules can be distributed over a frequency range that can be smaller than in unstressed sublimated crystals and as high as in polymers or amorphous materials 61, 62, 63. We found that a DBT concentration about six orders of magnitude higher than the one proposed for RT characterization allows to spectrally select single molecules within our experimental full range of about around . This will be discussed further on in the manuscript.
Figure 3a shows the excitation spectrum of a single DBT molecule illuminated in confocal mode at (below saturation), recording the red-shifted fluorescence as a function of the laser frequency (black circles). The spectral line is fitted with a Lorentzian profile (red curve) yielding a FWHM of , with an uncertainty of given by the standard deviation of four consecutive measurements of the same spectrum. Repeating this procedure on 35 molecules in different NCs leads to the distribution displayed in the inset of Figure 3a, with a low-width cutoff consistent with the lifetime-limited value of . The presence of molecules with broader linewidth can be explained in terms of the reduced size of the NC, which provides a less homogeneous environment for DBT molecules than that of bulk Ac. Moreover, interface effects on fluorescence stability and linewidth broadening are more likely to occur. However, let us note that the observed linewidth distribution is narrower than that measured by Gmeiner et al. 64, confirming the high crystallinity of the Ac NC grown via reprecipitation.
Spectral diffusion has so far hindered the deployment of traditional (inorganic) NCs for narrow-band applications, such as single-photon sources for quantum technologies. We hence carefully analyze the spectral stability of the molecule transition frequency. In Figure 3b, the NC fluorescence counts detected from a SPAD are displayed in a 2D color map, obtained repeatedly scanning for 1 hour the excitation frequency of the pump laser over . The excitation of two different molecules can be recognized. The mean values and standard deviations for the two molecule ZPL frequencies over all measurements are for peak 1 and for peak 2. However, the common-mode fluctuation of the peak central frequencies is a clear indication of the non-negligible contribution given by the pump laser instability (the laser diode is thermally stabilized but not referred to any absolute frequency standard). To get rid of this contribution and highlight possible spectral diffusion we analyze the distribution of the the two peak central frequencies difference (see the top panel in Figure 3b), plotted as white circles in the map. The maximum variation of such differential value is , which is well within the molecule linewidth and suggests negligible spectral diffusion for DBT:Ac NCs at . The same analysis has been carried out on couples of molecules in 8 different NCs. We observed sizable fluctuations only in one case where the ZPL central frequency over time exhibited a standard deviation of . As a term for comparison, we remind here that aromatic molecules in polymers or other amorphous hosts present linewidths as large as few GHz, accompanied by large spectral jumps (of the order of tens of ) 65, 63, 66. Also, when molecules are embedded in a poor crystalline environment, a broadening of both linewidth and inhomogeneous distributions is observed, and spectral jumps, even if in a narrow frequency range of tens of , are more likely to occur 64.
Figure 3c shows in logarithmic scale a typical saturation profile of a single molecule and its line broadening at low temperatures, obtained by measuring the excitation spectrum for several pump powers and plotting the detected count rates at resonance (blue circles) and the FWHMs (red circles) as a function of the excitation intensity. Detected counts are fitted with equation 1, providing a saturation intensity and a maximum number of detected photons kcps (free fitting parameters with the relative standard errors), or equivalently cps accounting for the detection efficiency . This count rate is compatible with the collection efficiency of our experimental setup for low temperature measurements of about mainly due to the the orientation of the emissive dipole and the low numerical aperture of the collecting optics. The power broadening of the homogeneous spectral line fits perfectly with the expected saturation law (blue line in Figure 3c) given by the equation 67:
| (2) |
which assumes negligible spectral diffusion, as previously demonstrated.
The inhomogeneous broadening of DBT molecules in Ac NCs is studied tuning the excitation laser over the available frequency range of about . In the top of Figure 3d a typical excitation spectrum collected at from a single NC is displayed, where we can distinguish about 80 peaks, each corresponding to a single molecule. The same measurement performed simultaneously on 20 NCs illuminated in wide-field for two orthogonal polarization of the laser pump allows to estimate the inhomogeneous distribution of the ZPLs of DBT molecules in Ac NCs. The result of this analysis is plotted in the histogram on the bottom of Figure 3d. We deduce a mean value of the transition frequency equal to with a standard deviation of , which is in agreement with the inhomogeneous broadening measured for other dyes in crystalline systems 58. Finally, we observe that DBT:Ac NCs are ideal for the deterministic integratation into nanophotonic devices, opening new perspectives on the use of molecules in the development of real-world quantum technologies.
2 Conclusions
In this work we demonstrate organic nanocrystals doped with quantum emitters, performing as efficient, photostable and scalable single-photon sources, at both room and cryogenic temperatures. In particular DBT:Ac crystals are presented, with an average size of few-hundreds nanometer. The growth procedure is based on reprecipitation, an inexpensive method that is adapted for a precise tuning of DBT concentration. Atomic force microscopy shows that the crystals grown under our experimental conditions present an average thickness of about and an average size of . The reported values can be controlled and reduced by varying the reprecipitation conditions, such as water temperature, droplet size, injected solution concentration and addition of surfactants. X-ray diffraction confirms the crystallinity of the nanoparticles and their platelet-like morphology. At room temperature, single DBT molecules in NCs show a maximum detected count rate of , a multi-photon probability lower than 5% and a well defined dipole orientation. At , the vast majority of molecules exhibits linewidths close to the lifetime-limited value and a relative narrow inhomogeneous distribution of around . Accurate investigation on their photostability demonstrates that each NC embeds several molecules with stable fluorescence lines, with no signs of blinking or spectral diffusion on time scales of hours. These results may be extended to different molecular host-guest systems, functionalization protocols and purposes, making active organic nanocrystals a new toolbox for the integration of quantum emitters in photonic and optoelectronic circuits, as well as in complex hybrid devices.
3 Experimental Section
DBT:Ac NCs growth protocol. The DBT:Ac NCs growth procedure consists in injecting of a mixture of 1mM DBT-toluene and 5mM Ac-acetone solutions into water. While continuously sonicating the system for , solvents dissolved in water and DBT:Ac crystals are formed in aqueous suspension. Solvents and Ac are purchased from Sigma Aldrich, water is deionized by a Milli-Q Advantage A10 System ( at ) and DBT is purchased from Mercachem.
Morphological characterization. Crystals size is evaluated by scanning electron microscopy (SEM, Phenom Pro, PhenomWorld) and atomic force microscopy (AFM, Pico SPM from Molecular Imaging in AC mode equipped with a silicon probe NSG01 (NT-MDT) with resonant frequency). XRD measurements were performed at CRIST, the Crystallographic Centre of the University of Florence (Italy), with a XRD Bruker New D8 on a sample made of few of suspension desiccated on a silicon-low background sample holder (Bruker AXS).
Optical setup. The optical characterization of DBT molecules within the sub-um Ac crystalline matrix was performed with a versatile home-built scanning fluorescence confocal microscope. The setup is equipped with a closed cycle Helium cryostat (Cryostation by Montana Instruments), capable of cooling samples down to . Molecules can be excited at either by a continuous wave laser (CW, Toptica DL110-DFB) and a pulsed Ti:Sapphire ( pulse width, repetition rate) laser. Alternatively, at cryogenic temperature, resonant excitation is performed with a narrowband fiber-coupled CW laser (Toptica, LD-0785-0080-DFB-1) centered at , whose frequency can be scanned continuously over a range of . All laser sources are linearly polarized to allow optimal coupling to single DBT transition by means of a half-wave plate in the excitation path. The laser intensities reported in the main text are calculated from the power measured at the objective entrance divided by the area of the confocal spot measured on the bare substrate (in both cases larger than the diffraction limited spot).
For low temperature measurements, the excitation light is focused onto the sample by a long working distance air objective (Mitutoyo Plan Apochromat, NA , WD = ) and can be scanned over the sample through a telecentric system and a dual axis galvo-mirror.
For room temperature measurements, a high-NA oil immersion objective (Zeiss Plan Apochromat, , NA) is used to focus light on the sample which is mounted on a piezoelectric nanopositioner (NanoCube by Physik Instrumente).
The Stokes-shifted fluorescence is collected by the same microscope objective used in excitation, separated from the excitation light through a dichroic mirror (Semrock FF776-Di01) and a longpass filter (Semrock RazorEdge 785RS-25) and detected by either an EM-CCD camera (Andor iXon 885, pixels, pixel size )
or two single-photon avalanche diodes (-SPAD-50 Single Photon Counting Modules by PicoQuant). SPADs can be used independently or in a Hanbury Brown-Twiss (HBT) configuration, using a time-correlated single-photon counting (TCSPC) card (PicoHarp, PicoQuant). A converging lens can be inserted in the excitation path to switch between confocal and wide-field illumination while a converging lens is added in the detection path before the EMCCD camera to study the wave-vector distribution of the light emitted by single DBT molecules via BFP imaging.
4 Notes
The authors declare no competing financial interest.
The authors would like to thank S. Ciattini, L. Chelazzi (CRIST) for helping with XRD measurements, M. Mamusa for dynamic light scattering experiments, F. Intonti for the microinfiltration setup, D. S. Wiersma for access to clean room facilities, M. Bellini and C. Corsi for Ti:sapphire operation, K.G. Schädler and F.H.L. Koppens for helpful feedback on the NCs properties and useful discussions about integration in hybrid devices. This work benefited from the COST Action MP1403 (Nanoscale Quantum Optics). The authors acknowledge financial support from the Fondazione Cassa di Risparmio di Firenze (GRANCASSA) and MIUR program Q-Sec Ground Space Communications.
References
- Kovalenko et al. 2015 Kovalenko, M. V. et al. Prospects of Nanoscience with Nanocrystals. ACS Nano 2015, 9, 1012–1057
- Zheng et al. 2015 Zheng, X. T.; Ananthanarayanan, A.; Luo, K. Q.; Chen, P. Glowing graphene quantum dots and carbon dots: properties, syntheses, and biological applications. Small 2015, 11, 1620–1636
- Lyu et al. 2016 Lyu, Y.; Xie, C.; Chechetka, S. A.; Miyako, E.; Pu, K. Semiconducting polymer nanobioconjugates for targeted photothermal activation of neurons. Journal of the American Chemical Society 2016, 138, 9049–9052
- Kim et al. 2013 Kim, T.-H.; Jun, S.; Cho, K.-S.; Choi, B. L.; Jang, E. Bright and stable quantum dots and their applications in full-color displays. MRS Bulletin 2013, 38, 712–720
- Talapin et al. 2010 Talapin, D. V.; Lee, J.-S.; Kovalenko, M. V.; Shevchenko, E. V. Prospects of Colloidal Nanocrystals for Electronic and Optoelectronic Applications. Chemical Reviews 2010, 110, 389–458
- O’Brien et al. 2009 O’Brien, J. L.; Furusawa, A.; Vučković, J. Photonic quantum technologies. Nature Photonics 2009, 3, 687–695
- Aharonovich et al. 2016 Aharonovich, I.; Englund, D.; Toth, M. Solid-state single-photon emitters. Nature Photonics 2016, 10, 631–641
- Gatto Monticone et al. 2014 Gatto Monticone, D.; Katamadze, K.; Traina, P.; Moreva, E.; Forneris, J.; Ruo-Berchera, I.; Olivero, P.; Degiovanni, I. P.; Brida, G.; Genovese, M. Beating the Abbe Diffraction Limit in Confocal Microscopy via Nonclassical Photon Statistics. Phys. Rev. Lett. 2014, 113, 143602
- Sangouard and Zbinden 2012 Sangouard, N.; Zbinden, H. What are single photons good for? Journal of Modern Optics 2012, 59, 1458–1464
- Tillmann et al. 2015 Tillmann, M.; Tan, S.-H.; Stoeckl, S. E.; Sanders, B. C.; de Guise, H.; Heilmann, R.; Nolte, S.; Szameit, A.; Walther, P. Generalized Multiphoton Quantum Interference. Phys. Rev. X 2015, 5, 041015
- Knill et al. 2001 Knill, E.; Laflamme, R.; Milburn, G. J. A scheme for efficient quantum computation with linear optics. nature 2001, 409, 46–52
- 12 QuantumManifesto, available at http://qurope.eu/manifesto, 2016.
- Lounis and Orrit 2005 Lounis, B.; Orrit, M. Single-photon sources. Reports On Progress In Physics 2005, 68, 1129–1179
- Chu et al. 2017 Chu, X.-L.; Götzinger, S.; Sandoghdar, V. A single molecule as a high-fidelity photon gun for producing intensity-squeezed light. Nat Photon 2017, 11, 58–62
- Loredo et al. 2017 Loredo, J. C.; Broome, M. A.; Hilaire, P.; Gazzano, O.; Sagnes, I.; Lemaitre, A.; Almeida, M. P.; Senellart, P.; White, A. G. Boson Sampling with Single-Photon Fock States from a Bright Solid-State Source. Physical Review Letters 2017, 118, 130503
- Sipahigil et al. 2014 Sipahigil, A.; Jahnke, K. D.; Rogers, L. J.; Teraji, T.; Isoya, J.; Zibrov, A. S.; Jelezko, F.; Lukin, M. D. Indistinguishable photons from separated silicon-vacancy centers in diamond. Physical Review Letters 2014, 113, 113602
- Lettow et al. 2010 Lettow, R.; Rezus, Y. L. A.; Renn, A.; Zumofen, G.; Ikonen, E.; Götzinger, S.; Sandoghdar, V. Quantum Interference of Tunably Indistinguishable Photons from Remote Organic Molecules. Phys. Rev. Lett. 2010, 104, 123605
- Bermudez-Urena et al. 2015 Bermudez-Urena, E.; Gonzalez-Ballestero, C.; Geiselmann, M.; Marty, R.; Radko, I. P.; Holmgaard, T.; Alaverdyan, Y.; Moreno, E.; Garcia-Vidal, F. J.; Bozhevolnyi, S. I.; Quidant, R. Coupling of individual quantum emitters to channel plasmons. Nat Commun 2015, 6
- Schroeder et al. 2011 Schroeder, T.; Schell, A. W.; Kewes, G.; Aichele, T.; Benson, O. Fiber-Integrated Diamond-Based Single Photon Source. Nano Lett. 2011, 11, 198–202
- Liebermeister et al. 2014 Liebermeister, L.; Petersen, F.; Münchow, A. v.; Burchardt, D.; Hermelbracht, J.; Tashima, T.; Schell, A. W.; Benson, O.; Meinhardt, T.; Krueger, A.; Stiebeiner, A.; Rauschenbeutel, A.; Weinfurter, H.; Weber, M. Tapered fiber coupling of single photons emitted by a deterministically positioned single nitrogen vacancy center. Applied Physics Letters 2014, 104, 031101
- Riedrich-Möller et al. 2014 Riedrich-Möller, J.; Arend, C.; Pauly, C.; Mücklich, F.; Fischer, M.; Gsell, S.; Schreck, M.; Becher, C. Deterministic Coupling of a Single Silicon-Vacancy Color Center to a Photonic Crystal Cavity in Diamond. Nano Letters 2014, 14, 5281–5287
- Schell et al. 2013 Schell, A. W.; Kaschke, J.; Fischer, J.; Henze, R.; Wolters, J.; Wegener, M.; Benson, O. Three-dimensional quantum photonic elements based on single nitrogen vacancy-centres in laser-written microstructures. Scientific reports 2013, 3
- Shi et al. 2016 Shi, Q.; Sontheimer, B.; Nikolay, N.; Schell, A. W.; Fischer, J.; Naber, A.; Benson, O.; Wegener, M. Wiring up pre-characterized single-photon emitters by laser lithography. Scientific Reports 2016, 6, 31135
- Somaschi et al. 2016 Somaschi, N.; Giesz, V.; De Santis, L.; Loredo, J.; Almeida, M. P.; Hornecker, G.; Portalupi, S. L.; Grange, T.; Antón, C.; Demory, J. Near-optimal single-photon sources in the solid state. Nature Photonics 2016, 10, 340–345
- Sapienza et al. 2015 Sapienza, L.; Davanço, M.; Badolato, A.; Srinivasan, K. Nanoscale optical positxioning of single quantum dots for bright and pure single-photon emission. Nature Communications 2015, 6, 7833
- Arcari et al. 2014 Arcari, M.; Söllner, I.; Javadi, A.; Lindskov Hansen, S.; Mahmoodian, S.; Liu, J.; Thyrrestrup, H.; Lee, E.; Song, J.; Stobbe, S.; Lodahl, P. Near-Unity Coupling Efficiency of a Quantum Emitter to a Photonic Crystal Waveguide. Physical Review Letters 2014, 113, 093603
- Daveau et al. 2017 Daveau, R. S.; Balram, K. C.; Pregnolato, T.; Liu, J.; Lee, E. H.; Song, J. D.; Verma, V.; Mirin, R.; Nam, S. W.; Midolo, L.; Stobbe, S.; Srinivasan, K.; Lodahl, P. Efficient fiber-coupled single-photon source based on quantum dots in a photonic-crystal waveguide. Optica 2017, 4, 178–184
- Zadeh et al. 2016 Zadeh, I. E.; Elshaari, A. W.; Jöns, K. D.; Fognini, A.; Dalacu, D.; Poole, P. J.; Reimer, M. E.; Zwiller, V. Deterministic Integration of Single Photon Sources in Silicon Based Photonic Circuits. Nano Letters 2016, 16, 2289–2294
- Davanço et al. 2017 Davanço, M.; Liu, J.; Sapienza, L.; Zhang, C.-Z.; De Miranda Cardoso, J. V. c.; Verma, V.; Mirin, R.; Nam, S. W.; Liu, L.; Srinivasan, K. Heterogeneous integration for on-chip quantum photonic circuits with single quantum dot devices. Nature Communications 2017, 8, 889
- Hausmann et al. 2012 Hausmann, B. J. M.; Shields, B.; Quan, Q.; Maletinsky, P.; McCutcheon, M.; Choy, J. T.; Babinec, T. M.; Kubanek, A.; Yacoby, A.; Lukin, M. D.; Lončar, M. Integrated Diamond Networks for Quantum Nanophotonics. Nano Letters 2012, 12, 1578–1582
- Mouradian et al. 2015 Mouradian, S. L.; Schröder, T.; Poitras, C. B.; Li, L.; Goldstein, J.; Chen, E. H.; Walsh, M.; Cardenas, J.; Markham, M. L.; Twitchen, D. J.; Lipson, M.; Englund, D. Scalable Integration of Long-Lived Quantum Memories into a Photonic Circuit. Phys. Rev. X 2015, 5, 031009
- Türschmann et al. 2017 Türschmann, P.; Rotenberg, N.; Renger, J.; Harder, I.; Lohse, O.; Utikal, T.; Götzinger, S.; Sandoghdar, V. Chip-Based All-Optical Control of Single Molecules Coherently Coupled to a Nanoguide. Nano Letters 2017, 17, 4941–4945
- Lombardi et al. 2017 Lombardi, P.; Ovvyan, A.; Pazzagli, S.; Mazzamuto, G.; Kewes, G.; Neitzke, O.; Gruhler, N.; Benson, O.; Pernice, W.; Cataliotti, F. Photostable molecules on chip: integrated single photon sources for quantum technologies. ACS Photonics 2017,
- Checcucci et al. 2016 Checcucci, S.; Lombardi, P.; Rizvi, S.; Sgrignuoli, F.; Gruhler, N.; Dieleman, F. B.; Cataliotti, F. S.; Pernice, W. H.; Agio, M.; Toninelli, C. Beaming light from a quantum emitter with a planar optical antenna. Light: Science & Applications 2016, 6, e16245
- Skoff et al. 2016 Skoff, S. M.; Papencordt, D.; Schauffert, H.; Bayer, B. C.; Rauschenbeutel, A. An optical nanofiber-based interface for single molecules. arXiv preprint arXiv:1604.04259 2016,
- Pisanello et al. 2013 Pisanello, F.; Leménager, G.; Martiradonna, L.; Carbone, L.; Vezzoli, S.; Desfonds, P.; Cozzoli, P. D.; Hermier, J.-P.; Giacobino, E.; Cingolani, R.; De Vittorio, M.; Bramati, A. Non-Blinking Single-Photon Generation with Anisotropic Colloidal Nanocrystals: Towards Room-Temperature, Efficient, Colloidal Quantum Sources. Adv. Mater. 2013, 25, 1974–1980
- Liu et al. 2017 Liu, J.; Konthasinghe, K.; Davanço, M.; Lawall, J.; Anant, V.; Verma, V.; Mirin, R.; Nam, S. W.; Song, J. D.; Ma, B. Direct observation of nanofabrication influence on the optical properties of single self-assembled InAs/GaAs quantum dots. arXiv preprint arXiv:1710.09667 2017,
- Empedocles and Bawendi 1997 Empedocles, S. A.; Bawendi, M. G. Quantum-confined stark effect in single CdSe nanocrystallite quantum dots. Science 1997, 278, 2114–2117
- Efros and Nesbitt 2016 Efros, A. L.; Nesbitt, D. J. Origin and control of blinking in quantum dots. Nat Nano 2016, 11, 661–671
- Chandrasekaran et al. 2017 Chandrasekaran, V.; Tessier, M. D.; Dupont, D.; Geiregat, P.; Hens, Z.; Brainis, E. Nearly Blinking-Free, High-Purity Single-Photon Emission by Colloidal InP/ZnSe Quantum Dots. Nano Lett. 2017, –
- Park et al. 2015 Park, Y.-S.; Guo, S.; Makarov, N. S.; Klimov, V. I. Room Temperature Single-Photon Emission from Individual Perovskite Quantum Dots. ACS Nano 2015, 9, 10386–10393
- Raino et al. 2016 Raino, G.; Nedelcu, G.; Protesescu, L.; Bodnarchuk, M. I.; Kovalenko, M. V.; Mahrt, R. F.; Stöferle, T. Single Cesium Lead Halide Perovskite Nanocrystals at Low Temperature: Fast Single-Photon Emission, Reduced Blinking, and Exciton Fine Structure. ACS Nano 2016, 10, 2485–2490
- Jantzen et al. 2016 Jantzen, U.; Kurz, A. B.; Rudnicki, D. S.; Schäfermeier, C.; Jahnke, K. D.; Andersen, U. L.; Davydov, V. A.; Agafonov, V. N.; Kubanek, A.; Rogers, L. J.; Jelezko, F. Nanodiamonds carrying silicon-vacancy quantum emitters with almost lifetime-limited linewidths. New Journal of Physics 2016, 18, 073036
- Tran et al. 2017 Tran, T. T.; Kianinia, M.; Bray, K.; Kim, S.; Xu, Z.-Q.; Gentle, A.; Sontheimer, B.; Bradac, C.; Aharanovich, I. Nanodiamonds with photostable, sub-gigahertz linewidths quantum emitters. arXiv preprint arXiv:1705.06810 2017,
- Toninelli et al. 2010 Toninelli, C.; Early, K.; Bremi, J.; Renn, A.; Sandoghdar, V. Near-infrared single-photons from aligned molecules in ultrathin crystalline films at room temperature. Optics Express 2010, 18, 6577–6582
- Nicolet et al. 2007 Nicolet, A. A.; Hofmann, C.; Kol’chenko, M. A.; Kozankiewicz, B.; Orrit, M. Single dibenzoterrylene molecules in an anthracene crystal: Spectroscopy and photophysics. ChemPhysChem 2007, 8, 1215–1220
- Trebbia et al. 2009 Trebbia, J.-B.; Ruf, H.; Tamarat, P.; Lounis, B. Efficient generation of near infra-red single photons from the zero-phonon line of a single molecule. Optics Express 2009, 17, 23986–23991
- Horn and Rieger 2001 Horn, D.; Rieger, J. Organic nanoparticles in the aqueous phase - Theory, experiment, and use. Angewandte Chemie International Edition 2001, 40, 4330–4361
- Kasai et al. 1992 Kasai, H.; Nalwa, H. S.; Oikawa, H.; Okada, S.; Matsuda, H.; Minami, N.; Kakuta, A.; Ono, K.; Mukoh, A.; Nakanishi, H. A novel preparation method of organic microcrystals. Japanese Journal of Applied Physics 1992, 31, L1132
- Kang et al. 2004 Kang, P.; Chen, C.; Hao, L.; Zhu, C.; Hu, Y.; Chen, Z. A novel sonication route to prepare anthracene nanoparticles. Materials Research Bulletin 2004, 39, 545–551
- Baba et al. 2011 Baba, K.; Kasai, H.; Nishida, K.; Nakanishi, H. Nanocrystal; InTech, 2011
- Chung et al. 2006 Chung, H.-R.; Kwon, E.; Oikawa, H.; Kasai, H.; Nakanishi, H. Effect of solvent on organic nanocrystal growth using the reprecipitation method. Journal of crystal growth 2006, 294, 459–463
- Brock and Dunitz 1990 Brock, C. P.; Dunitz, J. Temperature dependence of thermal motion in crystalline anthracene. Acta Crystallographica Section B: Structural Science 1990, 46, 795–806
- Nicolet et al. 2007 Nicolet, A. A.; Hofmann, C.; Kol’chenko, M. A.; Kozankiewicz, B.; Orrit, M. Single dibenzoterrylene molecules in an anthracene crystal: Main insertion sites. ChemPhysChem 2007, 8, 1929–1936
- Meltzer et al. 2001 Meltzer, R.; Yen, W.; Zheng, H.; Feofilov, S.; Dejneka, M.; Tissue, B.; Yuan, H. Evidence for long-range interactions between rare-earth impurity ions in nanocrystals embedded in amorphous matrices with the two-level systems of the matrix. Physical Review B 2001, 64, 100201
- Mazzamuto et al. 2014 Mazzamuto, G.; Tabani, A.; Pazzagli, S.; Rizvi, S.; Reserbat-Plantey, A.; Schädler, K.; Navickaite, G.; Gaudreau, L.; Cataliotti, F.; Koppens, F. Single-molecule study for a graphene-based nano-position sensor. New Journal of Physics 2014, 16, 113007
- Polisseni et al. 2016 Polisseni, C.; Major, K. D.; Boissier, S.; Grandi, S.; Clark, A. S.; Hinds, E. Stable, single-photon emitter in a thin organic crystal for application to quantum-photonic devices. Optics Express 2016, 24, 5615–5627
- Moerner and Fromm 2003 Moerner, W. E.; Fromm, D. P. Methods of single-molecule fluorescence spectroscopy and microscopy. Review of Scientific Instruments 2003, 74, 3597–3619
- Lieb et al. 2004 Lieb, M. A.; Zavislan, J. M.; Novotny, L. Single-molecule orientations determined by direct emission pattern imaging. JOSA B 2004, 21, 1210–1215
- Kozankiewicz and Orrit 2014 Kozankiewicz, B.; Orrit, M. Single-molecule photophysics, from cryogenic to ambient conditions. Chem. Soc. Rev. 2014, 43, 1029–1043
- Veerman et al. 1999 Veerman, J.; Garcia-Parajo, M.; Kuipers, L.; Van Hulst, N. Single molecule mapping of the optical field distribution of probes for near-field microscopy. Journal of Microscopy 1999, 194, 477–482
- Kramer et al. 2002 Kramer, A.; Segura, J.-M.; Hunkeler, A.; Renn, A.; Hecht, B. A cryogenic scanning near-field optical microscope with shear-force gapwidth control. Review of scientific instruments 2002, 73, 2937–2941
- Kozankiewicz et al. 1994 Kozankiewicz, B.; Bernard, J.; Orrit, M. Single molecule lines and spectral hole burning of terrylene in different matrices. The Journal of chemical physics 1994, 101, 9377–9383
- Gmeiner et al. 2016 Gmeiner, B.; Maser, A.; Utikal, T.; Götzinger, S.; Sandoghdar, V. Spectroscopy and microscopy of single molecules in nanoscopic channels: spectral behavior vs. confinement depth. Physical Chemistry Chemical Physics 2016, 18, 19588–19594
- Walser et al. 2009 Walser, A.; Zumofen, G.; Renn, A.; Götzinger, S.; Sandoghdar, V. Spectral dynamics and spatial localization of single molecules in a polymer. Molecular Physics 2009, 107, 1897–1909
- Boiron et al. 1999 Boiron, A.-M.; Tamarat, P.; Lounis, B.; Brown, R.; Orrit, M. Are the spectral trails of single molecules consistent with the standard two-level system model of glasses at low temperatures? Chemical physics 1999, 247, 119–132
- Ambrose et al. 1991 Ambrose, W.; Basché, T.; Moerner, W. Detection and spectroscopy of single pentacene molecules in ap-terphenyl crystal by means of fluorescence excitation. The Journal of Chemical Physics 1991, 95, 7150–7163