Decoherence in a Josephson junction qubit
Abstract
The zero-voltage state of a Josephson junction biased with constant current consists of a set of metastable quantum energy levels. We probe the spacings of these levels by using microwave spectroscopy to enhance the escape rate to the voltage state. The widths of the resonances give a measurement of the coherence time of the two metastable states involved in the transitions. We observe a decoherence time shorter than that expected from dissipation alone in resonantly isolated 20x5 area Al/AlOx/Al junctions at 60 mK. The data is well fit by a model that includes the dephasing effects of both low-frequency current noise and the escape rate to the voltage state. We discuss implications for quantum computation using current-biased Josephson junction qubits, including limits on the minimum number of levels needed in the well to obtain an acceptable error limit per gate.
pacs:
03.65.Yz,03.67.Lx,85.25.C,78.70.GqResearch in the 1980s definitively showed that the phase difference across a single current-biased Josephson junction can behave quantum-mechanically Voss and Webb (1981); Martinis et al. (1985). The recent proposal that an isolated current-biased Josephson junction could serve as a qubit Ramos et al. (2001) in a quantum computer has preceeded a resurgence of interest in this simple system Martinis et al. (2002); Yu et al. (2002); Blais et al. (2002); Johnson et al. (2003).
Designing a quantum computer based on isolated Josephson junctions raises many issues. Isolation of the junction from its bias leads must be achieved by controlling the high frequency electromagnetic environment that the junction couples to Martinis et al. (1985). At the very least, this isolation must be effective around the resonant frequency of the junction. In addition, at lower frequencies, current noise will tend to cause decoherence in the junction state. Also, during typical gate operations the junction must operate in a strongly anharmonic regime that can be reached by applying a large bias current through the junction. In this high bias regime however, there is an increased escape rate from the upper qubit state. In this Letter, we describe how both the escape rate and low frequency current noise cause decoherence and report results on measurements of these effects in Al/AlOx/Al Josephson junctions.
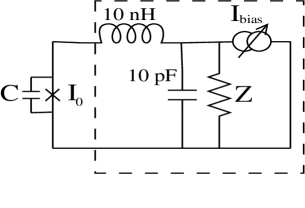
Consider a Josephson junction shunted by capacitance , having a critical current , and a parallel shunting impedance due to the external wiring (see Fig. 1). The supercurrent through the junction is given by the Josephson relation , and the voltage by , where is the gauge-invariant phase difference between the superconducting wavefunctions on each side of the junction. For , the phase may be trapped in a metastable well of the Josephson washboard potential, , or it may be in a running state with a non-zero average dc voltage see eg. M. Tinkham (1996).
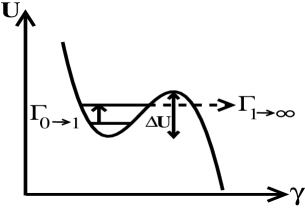
Quantizing the single junction system in the absence of dissipation leads to metastable states that are localized in the wells (see Fig. 2) and adds the possibility of escape to the continuum running states by quantum tunneling from the th level with a rate . The energy barrier to the continuum decreases as the bias current is increased, leading to a rapid increase in the tunneling rate with bias current Alvarez (1988):
| (1) |
where is the classical oscillation frequency and is approximately the number of levels in the well. As the energy barrier is lowered, the energy of the states in the well move closer together and the well becomes more anharmonic until, at , the energy barrier disappears.
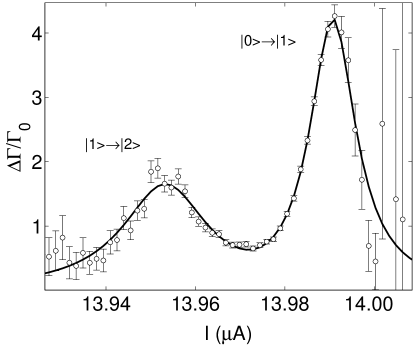
The observed escape rate of the system from the zero-voltage state to the finite voltage state at a given bias point is , where is the probability of the junction being in the th state. An ac current, (either external or thermally generated) can induce transitions between levels and in the well with a rate . Since for typical junction parameters, one expects to see a large enhancement in the escape rate if a microwave source is used to resonantly excite the system from the ground state to the first excited state (see Fig. 3).Martinis et al. (1985)
Each microwave resonance in this system will be broadened due to the interaction of the junction with noise transmitted via the wiring and described by the interaction Hamiltonian . Thermal noise and dissipation at the transition frequencies will cause changes in the populations of the states. At low frequencies, the resonant terms are insignificant and the noise only causes dephasing.
Considering just the ground state and the first excited state , transitions arise from thermal excitation from to , a decay rate from to , and tunneling to the continuum, for and . At temperature , the combined thermal and dissipative transition rates are:Chow et al. (1988)
| (2) |
| (3) |
where is the difference in energy between the two levels. For , the upward thermal transition rate is much smaller than the downward rate. From Eqn. 1 the tunneling to the continuum is much smaller for the ground state than the excited state in the anharmonic region of interest where .Alvarez (1988) Thus we expect that the spectroscopic width of the transition is
| (4) |
Equations 1 and Decoherence in a Josephson junction qubit imply that the level broadening, , depends on bias through the term and should exceed as the bias current approaches .
To understand results on a real junction we must also take into account the dephasing effects of any current noise in the system. For sufficiently low frequencies, we can model this non-resonant decoherence mechanism as a simple smearing of the response with bias. This should result in a broadening of the spectroscopic width that depends on how sensitive the resonant frequency, , is to changes in current, . An rms current noise should produce an additional contribution to the spectroscopic width of . Including this current noise contribution in the previous form for the spectroscopic width gives:
| (5) |
Both the second and third terms in Eq. (5) depend on bias, so that care must be taken in disentangling the two effects.
Using double angle evaporation, we fabricated Al/AlOx/Al Josephson junctions with . Direct measurements of the junction current-voltage characteristics showed a subgap resistance of more than at 20 mK. Escape rate measurements were made in an Oxford Instruments Model 200 dilution refrigerator with a 20 mK base temperature. We were able to tune the critical current of the junction by means of a superconducting magnet. The junctions were partially isolated from the bias leads by a 10 nH surface mount series inductor and a 10 pF capacitive shunt across the dissipative transmission line leads (see Fig. 1). This isolation scheme was designed so that at the plasma frequency, the effective shunt resistance due to the leads would be stepped up from to much more than , increasing the intrinsic Q of the system. To perform escape rate measurements, we start a timer and then ramp the current slowly (5 mA/s) using an HP 33120A function generator through a k resistor and monitor the junction voltage with a 2SK170 FET followed by an SRS560 amplifier. This output voltage is used to trigger the stop of timing, which is handled by a 20 MHz clock. Escape events were binned in time with width to create a histogram . The escape rate is then . We convert the time axis to current by calibrating the ramp current as a function of time.
We determine the spacing of the energy levels by comparing escape rate curves with and without a small microwave drive current applied. Figure 3 shows for a 5.5 GHz microwave signal. We chose the power so that on resonance to ensure the occupancy of is small. Two Lorentzian peaks are apparent, corresponding to the and transitions. By measuring for different applied microwave frequency, we can measure how the bias current changes the energy level spacing of the transition (see Fig. 4a).
The data in Fig. 4a also allows us to compute and convert the full width at half-maximum measured at each frequency (see Fig. 4b) to a width in frequency, , or the spectroscopic coherence time associated with the two levels, .
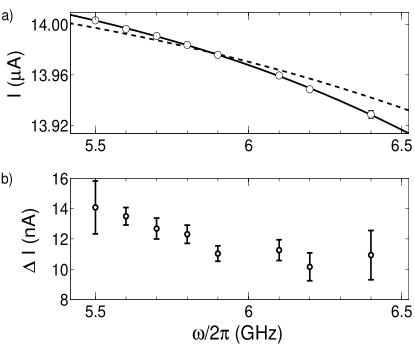
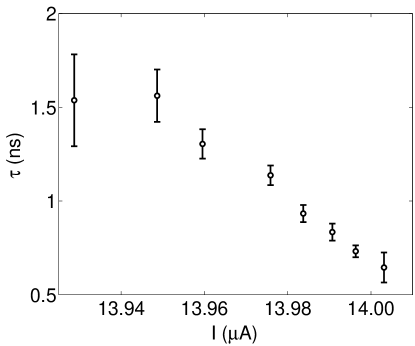
Figure 5 shows the coherence time as a function of the center current of each peak. We note that the coherence time decreases markedly as approaches , consistent with escape rate limiting of the lifetime of the upper state and excess low frequency current noise as in Eq. 5.
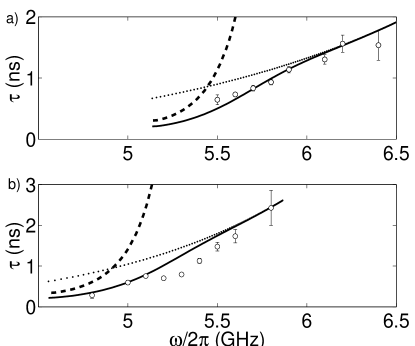
In principle, it is possible for the effective shunting impedance to vary with frequency in such a way as to generate the changes in seen in Fig. 5. We can rule out this explanation for the overall behavior of by changing the critical current of the junction and remeasuring at the same frequency. Such a process changes but not in Eq. 5. Results for two different ’s are plotted in Fig. 6a and 6b. Comparison of Figs. 6a and 6b reveals that the coherence time at fixed frequency is lower for larger . Since this measurement is at fixed frequency, the effect can not be due to varying with frequency.
To distinguish the effects of current noise and escape-rate broadening in Eq. 5, we need to obtain an independent measure of the junction parameters. For the low critical current data, we fit the escape rate curves without microwaves Büttiker et al. (1983) and find , , and . The 60 mK temperature was 40 mK above the base temperature, probably due to self-heating. We also numerically solved Schrödinger’s equation (with hard wall boundary conditions) and chose and to fit the data in Fig. 4a (dashed line). This yielded and . The same analysis for the high case gives and . The quantitative disagreement in Fig. 4 may come from not including corrections to the center peak locations due to current noise Berkley et al. (2002), the energy level shifting due to damping, or a frequency dependent impedance (such as is suggested at 5.2 GHz in Fig. 6b).
We now fit the coherence time data in Fig. 6 by varying and and comparing the results with the previously determined parameters. We find by solving Schrödinger’s equation numerically. To estimate the rms current noise, , we note that the full current width at half maximum shown in Fig. 4b never drops below 10 nA. We thus assign nA. To get a unique fit, we also assume . The solid lines in Fig. 6 show the results of this procedure. The dashed lines show the contribution to the broadening due to the escape rate alone, while the dotted lines represent the current noise contribution. The parameters for the lifetime fits, and , agree with the parameters obtained from Fig. 4, verifying the inclusion of current noise and escape-rate-limited coherence in the model of Eqn. 5. We note that as the bias current approaches (low frequency), the escape rate term begins to dominate the lifetime, while for lower currents (high frequency), the noise broadening dominates.
To conclude, we have measured the resonance width of the transition between the lowest two quantum states in a Josephson junction qubit as a function of bias current, and found that the lifetime of the excited state falls rapidly as the bias current approaches . A model including continuous dephasing from tunneling as well as from current noise explains quantitatively the reduced coherence time. This ability to predict and calculate such junction behavior is crucial to the use of junctions in quantum computers and one of the reasons junctions are a good candidate qubit.
For designs where low-frequency current noise is not a significant issue Martinis et al. (2002), consideration of the above results in conjunction with Eqn. 1 suggests the following qubit design criterion. To obtain at least gate operations before decoherence occurs from tunneling alone, with each gate operation taking approximately time, requires at least levels in the well. For and , we find . In the opposite limit, where current noise dominates, the junction must be biased at low currents during gate operations.
Acknowledgements.
We acknowledge support from DOD and the Center for Superconductivity Research and thank J.M. Martinis, F. Strauch, P. Johnson, and A. Dragt for many useful discussions about this system.References
- Voss and Webb (1981) R. F. Voss and R. A. Webb, Phys. Rev. Lett. 47, 265 (1981).
- Martinis et al. (1985) J. M. Martinis, M. H. Devoret, and J. Clarke, Phys. Rev. Lett. 55, 1543 (1985).
- Ramos et al. (2001) R. C. Ramos, M. A. Gubrud, A. J. Berkley, J. R. Anderson, C. J. Lobb, and F. C. Wellstood, IEEE Transactions on Applied Superconductivity 11, 998 (2001).
- Martinis et al. (2002) J. M. Martinis, S. Nam, J. Aumentado, and C. Urbina, Phys. Rev. Lett. 89, 117901 (2002).
- Yu et al. (2002) Y. Yu, S. Han, X. Chu, S. Chu, and Z. Wang, Science 296, 886 (2002).
- Blais et al. (2002) A. Blais, A. M. van den Brink, and A. Zagoskin (2002), cond-mat/0207112.
- Johnson et al. (2003) P. R. Johnson, F. W. Strauch, A. J. Dragt, R. C. Ramos, J. R. Anderson, C. J. Lobb, and F. C. Wellstood, Phys. Rev. B 67, 020509 (2003).
- see eg. M. Tinkham (1996) see eg. M. Tinkham, Introduction to Superconductivity (McGraw Hill, New York, 1996), 2nd ed.
- Alvarez (1988) G. Alvarez, Phys. Rev. A. 37, 4079 (1988).
- Chow et al. (1988) K. S. Chow, D. A. Browne, and V. Ambegaokar, Phys. Rev. B. 37, 1624 (1988).
- Büttiker et al. (1983) M. Büttiker, E. P. Harris, and R. Landauer, Phys. Rev. B. 28, 1268 (1983).
- Berkley et al. (2002) A. J. Berkley, H. Xu, M. A. Gubrud, R. C. Ramos, J. R. Anderson, C. J. Lobb, and F. C. Wellstood (2002), submitted to IEEE Transactions on Applied Superconductivity.