Coherence of qubits based on single Ca+ ions
Abstract
Two-level ionic systems, where quantum information is encoded in long lived states (qubits), are discussed extensively for quantum information processing. We present a collection of measurements which characterize the stability of a qubit based on the – transition of single 40Ca+ ions in a linear Paul trap. We find coherence times of 1 ms, discuss the main technical limitations and outline possible improvements.
pacs:
03.67.L, 42.50.Ct, 32.80.Qk1 Introduction
The concept of quantum computing is based on the coherent manipulation of quantum bits (qubits), which carry the information in a superposition of two quantum mechanical states , [1, 2, 3]. A quantum register is composed out of qubits. Prior to the computation, the state of all qubits is set to a well defined initial value. During the following computation process, a large number of quantum gate operations is performed on these qubits. This sequence of logic gate operations is determined by the specific task, following the desired quantum algorithm. Ideally, during the course of this algorithm the quantum state of the system follows a fully unitarian, thus time-reversible path in the -dimensional Hilbert space, free of any decoherence. Finally, the qubits are projected in the computational basis and the outcome of the algorithm is measured.
However, different from this ideal situation, decoherence will occur and cause errors during the computation process. Thus, highly-entangled quantum states generated during the computation are destroyed and the operation of the quantum computer is affected [4, 5]. Any coupling of the quantum computer to the environment causes decoherence and it seems an impossible task to construct a quantum computer working in an entirely coherent way. Is quantum computing impossible? In order to overcome the problem of decoherence, quantum-error-correction schemes have been proposed [6, 7] which lift the constraint on coherence to an acceptable error rate of about 1 in 105 computational steps [8, 2]. Under this condition, error correction schemes predict the stabilization of any quantum computation process.
Presently, a number of proposals are discussed for a future realization of quantum computation, emanating from various fields of physics. We expect that a future quantum computer has to fulfill the following list of requirements [3] and any proposal for a future quantum computer should address them. Each system which is proposed for an implementation of a quantum computer will have to provide
-
•
a scalable physical system with well characterized qubits,
-
•
the ability to initialize the state of the qubits,
-
•
a coherence time much longer than operation time,
-
•
an universal set of quantum gates: single bit and two bit gates,
-
•
a qubit-specific measurement.
In this paper we discuss strings of ions for quantum computation [9]: Ion strings can be stored in linear Paul traps such that they arrange in string, representing a quantum register [1]. They can be optically pumped and optically cooled, such that the register is initialized. Ions are kept under ultra-high vaccum conditions, thus we expect a long coherence time. Initiated by the proposal by Cirac and Zoller [10], other procedures for quantum gate operations have been developed [11] and realized [12]. Single qubit operations performed by Rabi oszillations have been shown as well [13, 14]. For the qubit specific measurement, the 100% efficient electron shelving technique is employed [15, 16]. Thus, ion trap quantum computing has already left the status of a theoretical concept in so far as experiments with a small number of qubits have been perfomed and the properties of the system have been studied in some detail [14, 16, 17].
Here, we focus the discussion to the third item of the above list of requirements: What are the sources of decoherence and how can we investigate them quantitatively? Under the conditions set by the actual experiments [18, 19], we find that the time required for a single logic operation is on the order of s [20]. Thus, if we demand that the error probability due to decoherence is smaller than 1 in 105 we find that a coherence time of at least 1..10 s is required for a successful application of quantum error correction. In this paper we try to give a deeper insight into the present, mostly technical, limitations of the qubit coherence.
Typically, with trapped ions, a qubit is encoded in atomic transitions involving levels with extremely low radiative decay: Hyperfine ground states are used as qubit-bases and manipulated via a far off-resonant Raman transition [21]. Optionally, the qubit is encoded in a superposition of a ground state and a long lived metastable state [16, 22], and manipulated on an optical quadrupole transition. For two-bit gate operations [10, 11], the excitation of motional quantum states [23] in a string of ions [24] is used.
In this paper we consider the qubit transition in 40Ca+, from the S1/2 ground state to the metastable D5/2 state (lifetime ), and recent experimental investigations of the Innsbruck group [19]. The paper is organized as follows: The first section contains a brief description of the experimental set-up and the experimental techniques which are used for trapping, cooling and observing ion strings. In the second section we discuss the coherence of the internal, electronic qubit state , and in a third section we investigate coherence properties of the lowest motional states . The final section sketches a proposal which possibly allows more than quantum logic operation and coherence times exceeding 1 s, using trapped 43Ca+ ions.
2 Experimental setup
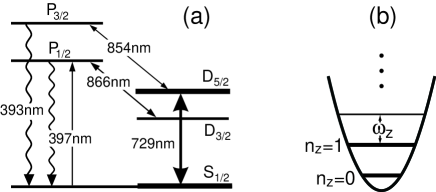
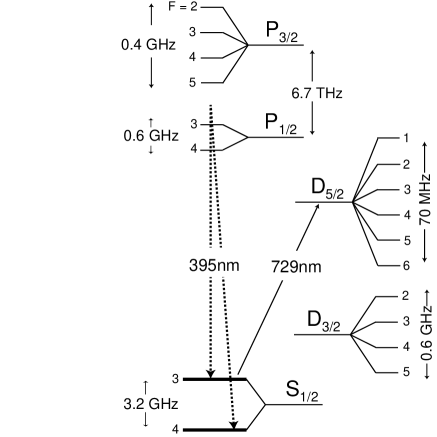
For the experiments, a single 40Ca+ ion is, or a string of a few ions are, stored in a linear Paul trap. The trapped 40Ca+ ion has a single valence electron and no hyperfine structure (see Fig. 1a). We perform Doppler-cooling on the transition at 397 nm. Diode lasers at 866 nm and 854 nm prevent optical pumping into the D states. For sideband cooling and for quantum information processing [16], we excite the S1/2 to D5/2 transition with a Ti:Sapphire laser near 729 nm (linewidth Hz). A constant magnetic field of 2.4 G splits the 10 Zeeman components of the S D5/2 multiplet. Depending on the chosen geometry and polarization, the excitation of and transitions is allowed. We detect whether a transition to D5/2 has occurred by applying the laser beams at 397 nm and 866 nm and monitoring the fluorescence of the ion on a photomultiplier (electron shelving technique [15]). The internal state of the ion is discriminated with an efficiency close to 100 within 3 ms [16]. The Paul trap is built with four blades separated by 2 mm for radial confinement and two tips separated by 5 mm for axial confinement. Under typical operating conditions we observe axial and radial motional frequencies (1.7, 5.0) MHz.
2.1 Measurement cycle
The measurement cycle (total duration 20 ms) consists of four consecutive steps: (I) Doppler cooling (laser 397 nm, 866 nm and 854 nm on) leads to low thermal vibrational states of axial and radial modes with and phonons. (II) Sideband cooling of the axial motion is performed on the transition, leading to more than 99 ground state population. Pumping into is counteracted by several short pulses of radiation at 397 nm. (III) Manipulation of the qubit state with radiation near 729 nm. (IV) Final state analysis: The ion’s fluorescence is collected under excitation with laser light at 397 nm and 866 nm and thus the internal state is detected. This sequence is repeated 100 times to measure the D5/2 state excitation probability . All experiments, described in the following, are performed using this sequence. To investigate different sources for and sorts of decoherence, we only modify step (III) of the sequence according to the specific task.
3 Coherence of the internal qubit state
Qubits are represented by the electronic state of each ion in the linear string where . Decoherence leads to the decay of the quantum mechanical phase relations transforming the above state into an incoherent mixture. Various possible reasons for decoherence on the qubit transition S1/2 – D5/2 can be expected:
-
•
Qubit energy levels fluctuate via the Zeeman effect caused by ambient magnetic field fluctuations in the ion trap,
-
•
the laser light driving the qubit transition fluctuates in frequency and light intensity,
-
•
the upper qubit basis state D5/2 decays spontaneously (1 s lifetime).
While the first items are due to technical shortcomings, only the third item is a physical limit for the coherence time. In the following sections, we present a variety of experiments which investigate (and discriminate between) different sources of decoherence as listed above.
3.1 Noise components at 50 Hz
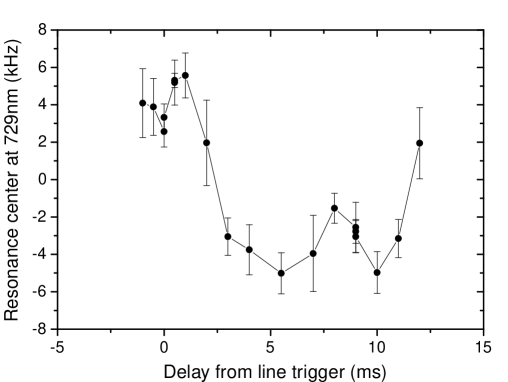
To test the influence of the frequency noise components at Hz, e.g. caused by ambient magnetic field fluctuations in the ion trap, we trigger the experimental sequence synchronized to the Hz frequency from the power line. If the 50 Hz noise components are dominant, the laser will excite the qubit transition at an instant of time when the ion is exposed to about the same ambient magnetic field. The magnitude of the magnetic field variation is examined by shifting the excitation pulse in time with respect to the 50 Hz line trigger and measuring the resonance frequency of the S – D with a laser detuning near =0 (”carrier transition”). The linear Zeeman shift depends on the magnetic -factors for both states which are involved, =2 and =6/5, and the magnetic quantum numbers for initial and final state. Therefore, Zeeman shifts are most sensitively measured via the Zeeman component (=2) where a field of 1 mGauss corresponds to 4.2 kHz shift of the resonance center.
For this, the laser frequency is varied over the resonance of the S – D resonance. We record the excitation probability to the upper state, after a 1 ms laser pulse (step III of the experimental sequence). The line center position is determined from a fit to the data. We thus observe, that the center of the resonance line fluctuates within a bandwidth 5 kHz (Fig. 2). Even though the details of these fluctuations are not reproduced from day to day, its amplitude remains fairly constant with approximately one mGauss.
To avoid the qubits’s dephasing due to 50 Hz noise, all experiments described below are triggered to the power line frequency. Secondly, to avoid the disturbing influence of the linear Zeeman effect as much as possible, we use the S – D transition (=0) for quantum gate operations, with a five times smaller susceptibility for magnetic field fluctuations.
3.2 Rabi oscillations
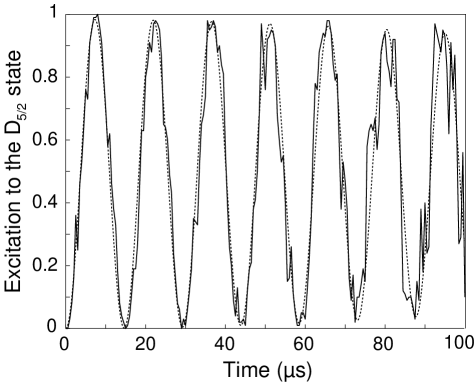
The most simple manipulation consists of a single laser pulse in step (III). While the laser detuning is kept fixed, the pulse length is varied. The excitation probability to the D5/2 state is plotted versus the duration , and we observe Rabi oscillations as shown in Fig. 3. This way single bit rotations are realized. From the measured contrast of the oscillations we derermine the quality of qubit rotations. For the given laser intensity here, a rotation is achieved after about 7 s, to implement the logic NOT operation. Even for a rotation we observe a contrast of better than 94% at times near 75 s. We identify two reasons which limit the contrast: i) Laser intensity fluctuations cause slightly different Rabi frequencies from shot to shot. As each data point in Fig. 3 is taken as the average over 100 experimental realizations of the sequence (sect. 2.1) the contrast is reduced. ii) A second limitation of the quality of single qubit operations is caused by residual small phonon numbers in thermally occupied vibrational modes. Other than the vibrational mode used for the quantum gate operations, typically not all modes are cooled to the vibrational ground state . As the Rabi frequency on the carrier (=0) transition depends weakly on the phonon occupation number in all those modes (”spectator modes”), averaging over their thermal distributions leads to a reduced contrast [21]. However, this problem can be solved using newly developed cooling techniques [25], which have been demonstrated recently [27]. It can be shown that these cooling techniques will reduce the thermal occupation of all spectator modes of an ion string well below one [26], where their effect on the contrast of Rabi oscillations becomes negligible.
3.3 Ramsey spectroscopy on the S1/2 to D5/2 transition
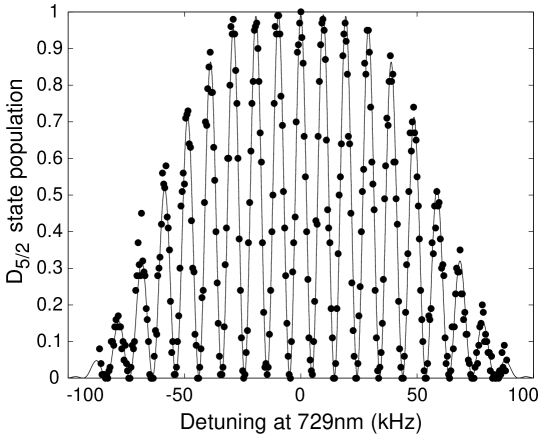
Ramsey spectroscopy is perfectly suited for a test of the qubit’s decoherence. A first pulse on the carrier () excites the state and to a coherent superposition. After a second pulse, applied after a waiting time of , the resulting state is projected into the basis by the final state analysis. Varying the laser frequency detuning yields a Ramsey pattern. Ideally, the excitation to the D5/2 state should exhibit a modulation between zero and one when the detuning of the laser frequency is slightly varied.
Experimentally observed Ramsey fringes show contrast (Fig. 4). For the theoretical prediction, two-level-Bloch equations are solved, keeping the length of the -pulses and the waiting time fixed at the experimental values. Free parameters for the theoretical curve are the pulse area of the -pulses of = 0.515 (instead of 0.5 ) and the coherence time, accounting for an effective laser linewidth of =150 Hz.
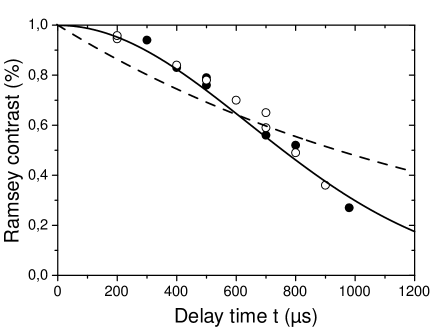
If the superposition of the and the states is exposed to the influence of any decoherence for a long time duration , causing a dephasing of the qubit levels, this shows up as a loss of contrast in the observed Ramsey pattern. Systematically we have varied the waiting time between both Ramsey pulses between 100 and 1000 s. The observed contrast of the central fringes is plotted versus the waiting time in Fig. 5. Assuming a white noise model for the spectral density of frequency fluctuations, one would expect an exponential to describe the decrease of contrast, and to yield the Lorentzian linewidth [28]. However, the exponential fit to our data is very poor, instead we find that a Gaussian, with a width of 170(10) Hz describes our data correctly. Compared to the Lorentzian noise model, the observed noise shows an excess of modulation frequencies 1.5kHz.
We use an optical fiber to transport the light from the Ti:Sapphire laser to the ion trap setup. This fibre was identified as a source of frequency noise with about 20 Hz [29]. If the fibre induced noise will dominate the frequency noise, we will apply cancellation techniques as described in [30, 31].
3.4 Active compensation of ambient magnetic field fluctuations
Since ambient magnetic fluctuations affect the coherence, we have set up an active magnetic field compensation system [32]. This system consists of a flux gate sensor and a control unit which supplies three orthogonal coils for the cancellation. The specifications of the compensation device claim a bandwidth of 0.5 Hz to 5 kHz. With the aid of an independent flux gate sensor we find that the 1 mGauss ambient field fluctuations (rms) at 50 Hz are reduced by a factor of 20.
However, no effect of the cancellation system on the Ramsey contrast is observable as is indicated by Fig. 5, by the solid circles. As we measure that the bandwidth of the cancellation system is sufficient to suppress noise from 50 Hz to 1 kHz, we assume that the remaining sources of magnetic field fluctuations are localized in the direct vicinity of the trap and not picked up by the sensor of the cancellation system. In future, we plan to passively shield the trap from magnetic fluctuations.
3.5 Raman transitions
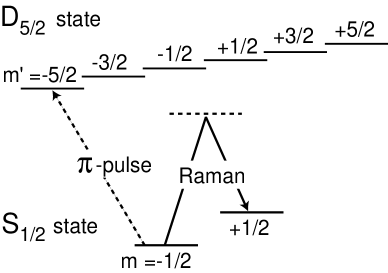
Further investigations of the magnetic field fluctuations are performed driving Raman transitions between Zeeman substates . For the principle see Fig. 6.
After the preparation steps I and II in the experimental sequence, in step III we drive the Raman transition. Both laser fields R1 and R2 are generated from the output of the same Ti:Sapphire laser by means of an acousto-optical modulator (in double pass configuration), driven with two frequencies. Both beams propagate in the same optical mode, within the same optical fiber [30, 31] and illuminate the ion with a resulting Lamb-Dicke factor of 0). The Raman detuning is = 500 kHz. The detuning of R1 is kept fixed, and the frequency of R2 is varied over the resonance. Both light fields are switched on and off together. After this Raman pulse, we use a pulse on the S for shelving the Zeeman component. Finally, in step IV, the excitation probability to the D5/2 state is detected.
The obvious advantage is that the Raman excitation technique is sensitive only to the fluctuations of the ground state Zeeman levels, but it remains immune to laser frequency fluctuations. Its second advantage is a potentially higher susceptibility for magnetic fluctuations, S +1/2 with 2.8 kHz/mGauss and D with 6.72 kHz/mGauss for the transition as compared with the SD resonance of 4.2 kHz/mGauss.
We observed Raman spectra and use a 1 ms pulse length for the excitation. The spectra of show a linewidth of about 2 kHz. As the width is not given by the Fourier limit, according to the pulse duration, we conclude that the of magnetic field fluctuations are important within 1 ms.
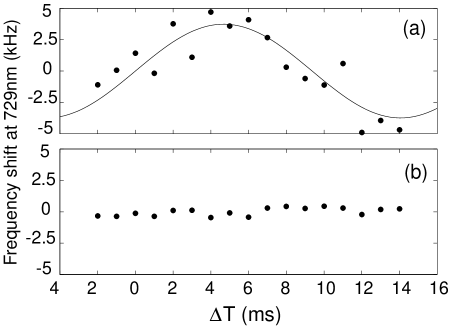
Caused by the dominant 50 Hz component of the ambient magnetic field fluctuations, the Raman resonance is shifted, depending on the delay time from the 50 Hz trigger pulse 3.1. We take Raman spectra for different delays of the excitation time with respect to the line-trigger, and plot their center frequency versus the delay time in Fig. 7a. We observe a modulation with the amplitude of a few kHz at a frequency of 50 Hz corresponding to a mGauss (rms) magnetic field fluctuation. The active cancellation system reduces this 50 Hz component to about 10% of its initial value, Fig. 7b.
3.6 Lifetime of the D5/2 state
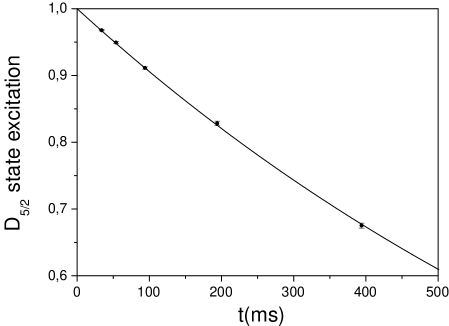
The natural lifetime of about 1 s of the D5/2 state sets a coherence limit for the single qubit. In order to test the experiment, a single ion is excited to the D5/2 state. We record the probability to find the ion in still in the D5/2 state after a waiting time , see Fig. 8. The resulting value of 1011 ms is slightly below the reported value, see ref. [33] Fig. 1. As discussed in [33, 35], the D5/2 decay is increased by optical pumping to the ground state via the P3/2 state with residual light near 854 nm (see Fig. 1), thus explaining the observation of a shorter lifetime [33, 34, 36].
In the experiment, the laser light near 854 nm was switched off using a acousto-optical modulator in double pass configuration with a measured attenuation of . Since residual light near 854 nm still affects the observed lifetime, we reduced the light power before the acousto-optical modulator for the measurement in Fig. 8. As a second reason for a reduction of the spontaneously emitted broadband background radiation from the diode laser near 866 nm could have contributed [33].
We do not claim to add another value to the literature for the D5/2 state lifetime, since this would require a profound investigation of all systematic errors. However, from the above measurements it becomes evident that any light resonant with dipole transitions has to be suppressed. Note, that the coherence of a superposition of the and states would be affected also by an insufficient switching of the laser field near 397 nm. For the light near 397 nm we use two acousto-optical switches and an optical single mode fiber to avoid scattered light (total isolation ).
4 Coherence of the motional qubit state
To test the coherence of the motional qubit state, we excite the ”motional qubit”, represented by the vibrational states . For this , the laser frequency detuning is set to , the motional sideband frequency, from the S-D resonance.
4.1 Heating rate
If the ion’s vibrational state increases without laser light interaction, we denote this as a heating rate. Systematic studies of heating rates have been performed in a three-dimensional Paul trap [16] and in linear traps [14] for single ions and two-ion crystals. To measure the heating rate, the ion(s) are first cooled to the vibrational ground state. Then the system is left alone for a certain delay time to interact with the environment, i.e. with the surrounding electrodes and any possible perturbations acting on the motion of the ions. Finally the resulting vibrational state is analyzed.
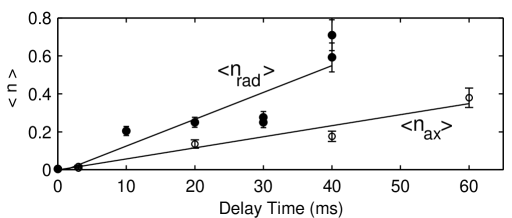
For all traps we find that on the average it takes about 100 ms to pick up a single phonon. We measure the increasing phonon number by observing the Rabi–flopping signal on the blue sideband. The results of such measurements, axial phonon number is as a function of the delay time are shown in Fig. 9. Here, the data obtained for a single ion in the three-dimensional Paul trap, result in a heating rate of ms-1 (i.e. 1 phonon in 190 ms) at the trap frequency of = 4 MHz. For the radial y direction the heating rate is determined to be 1 phonon in 70 ms at = 1.9 MHz.
While the determination of the heating rate corresponds to the measurement of the -time, the following section is dedicated to a measurement of the -time, quantifying the dephasing of superposition states.
4.2 Decoherence of motional superpositions
To successfully perform two-ion gate operations it is necessary that the motional superpositions do not decohere. Similar to the electronic (internal) coherence, we test this with a Ramsey experiment. Therefore we prepare a superposition of two motional states with identical electronic state. To achieve this we apply a -pulse on the carrier to obtain . Secondly we apply a -pulse on the blue sideband. This pulse moves the -part of the superposition into the -state and leaves the -part unaffected and we obtain the desired superposition . We now wait for a time before we apply the two laser pulses in the time reversed order. If no dephasing has occured during , this inverse pulse sequence leads to the initial state , or , depending on the phase of the last laser pulse. Motional decoherence, however, would scramble the phase relation between the and state and thus reduce the contrast.
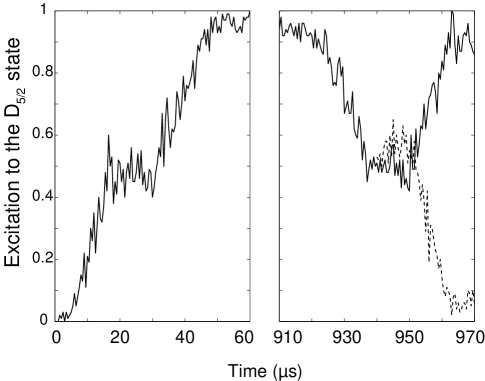
Fig. 10 shows the evolution of the D5/2 state population of the excited state as a function of the time. For this measurement we repeated the experimental cycle 100 times for each data point, however, we cut off the pulse sequence at the time indicated on the -axis. The first pulse is complete at s, the second one takes place from s to s. All laser interaction is interrupted for the interval . Then the pulses are repeated in reversed order. Depending on the relative phases of the first and the fourth pulse we detect the atom in either the (solid curve) or the state (dashed). For a waiting time s we measure a contrast of 80%, mainly limited by the electronic decoherence which takes place within each pair of pulses. Observing the contrast for various interval times yields a coherence time of approximately 100 ms for the motional superposition state, about equal to the motional heating time.
5 Future
With a systematic investigation of decoherence sources, improvements of a future setup can be devised. We have found for the qubit based on the S1/2 to D5/2 transition in that magnetic field fluctuations and laser frequency fluctuations are the major limitations of the present setup. The electronic qubit coherence time is about 1 ms. We measure a coherence time of the motional qubit of about 100 ms.
Major progress is expected from switching from to , an isotope with nuclear spin 7/2 which posesses (i) a hyperfine-split ground state and thus long-lived states which may be coupled by Raman transitions, and (ii) magnetic-field insensitive Zeeman substates which are ideally suited as qubit levels. Both these properties contribute to potentially much longer coherence times of , since ambient magnetic fields affect the qubit phase only through the much smaller quadratic Zeeman effect, since spontaneous emission is practically absent, and since the laser phase on the Raman transition is controlled by radio frequency technology and is therefore less susceptible to laser noise. iii) By appropriately choosing the directions of the Raman beams with respect to the trap axes, the Lamb-Dicke factor can be optimized such that only the axial, but no radial vibrational modes are excited. Therefore, radial spectator modes do not affect the gate operation at all. In addition, the use of Raman transition speeds up quantum gate operations since the two Raman photons transfer a higher recoil to that mode used for the quantum gate [20].
Therefore, we plan to use for quantum computing [37] and to encode the qubit in hyperfine ground states and . Qubits can be manipulated on the Raman transition, as is indicated in Fig. 6. Doppler cooling may be performed similarly as in on the dipole transitions S1/2–P1/2. For reaching the vibrational ground state, either sideband cooling either on the S1/2–D5/2 transition, or on the Raman transition between both hyperfine levels can be employed. For the quantum state detection we will transfer one of the qubit levels, e.g. , to the D5/2 state by a resonant carrier pulse, similar to the scheme presented in Fig. 6. Eventually, the final state analysis is performed similarly as in the case of by detecting the fluorescence emitted when the ion is illuminated by resonant radiation near 397 nm and 866 nm.
With strings of we may be able to demonstrate, at the proof-of-concept level, an ion trap quantum computer, using the best features of today’s existing experiments thus merging advantages of experiments on ions with individual addressing and optical qubits, and on ions with hyperfine encoding of qubits [18].
5.1 Acknowledgments
We gratefully acknowledge support by the European Commission (QSTRUCT and QI networks, ERB-FMRX-CT96-0077 and -0087, QUEST network, HPRN-CT-2000-00121, QUBITS network, IST-1999-13021), by the Austrian Science Fund (FWF, SFB15), and by the Institut f r Quanteninformation GmbH.
References
- [1] The Physics of Quantum Information, Springer (2000), Berlin. ed. D. Bouwmeester, A. Ekert, and A. Zeilinger.
- [2] Quantum Computation and Quantum Information, M. A. Nielsen and I. L. Chuang, Cambridge (2000).
- [3] D. P. DiVincenzo, Quant. Inf. Comp. 1 (Special), 1 (2001).
- [4] S. Haroche, J. M. Raimond, Physics Today 51 (1996).
- [5] N. D. Mermin, Physics Today 11 (2001).
- [6] P. Shor, Phys. Rev. A 52, 2493 (1995).
- [7] A. Steane, Phys. Rev. Lett. 77, 793 (1996).
- [8] J. Preskill, Proc. R. Soc. Lond. A 434, 385 (1998).
- [9] M. Sarura and V. Buzek, Journal of Mod. Opt. 49, 1593 (2002).
- [10] I. Cirac and P. Zoller, Phys. Rev. Lett. 74, 4714(1995).
- [11] A. Sörensen and K. Mölmer, Phys. Rev. Lett. 82, 1971 (1999).
- [12] C. A. Sackett, et al., Nature 404, 256 (2000).
- [13] H. C. Nägerl, et al., Phys. Rev. A 60, 145 (1999).
- [14] H. Rohde, et al., J. Opt. B 3, S34 (2001).
-
[15]
W. Nagourney, J. Sandberg, and H. Dehmelt, Phys. Rev. Lett. 56, 2797 (1986);
Th. Sauter, W. Neuhauser, R. Blatt, and P. E. Toschek, Phys. Rev. Lett. 57, 1696 (1986);
J. C. Bergquist, R. G. Hulet, W. M. Itano, D. J. Wineland, Phys. Rev. Lett. 57, 1699 (1986). - [16] Ch. Roos, et al., Phys. Rev. Lett. 83, 4713 (1999).
- [17] Q. Turchette, et al., Phys. Rev. A, 61, 063418 (2000).
- [18] http://www.boulder.nist.gov/timefreq/ion/
- [19] http://heart-c704.uibk.ac.at/
- [20] A. Steane, et al., Phys. Rev. A 62, 042305 (2000).
- [21] D. Wineland, et al., J. Res. Natl. Inst. Stand. Technol. 103, 259 (1998).
- [22] H. C. Nägerl, et al., Phys. Rev. A 61, 023405 (2000).
- [23] D. F. V. James, Appl. Phys. B 66, 181 (1998).
- [24] H.C. Nägerl, D. Leibfried, F. Schmidt-Kaler, J. Eschner, R. Blatt, Optics Express 3, 89 (1998).
- [25] G. Morigi, J. Eschner, C. H. Keitel, Phys. Rev. Lett. 85, 4458 (2000).
- [26] F. Schmidt-Kaler, et al., Appl. Phys. B 73, 807-814 (2001).
- [27] C. F. Roos, et al., Phys. Rev. Lett. 85, 5547 (2000).
- [28] K. Sengstock, et al., Appl. Phys. B 59, 99 (1994).
- [29] H. Rohde, PhD-Thesis, Innsbruck, Austria (2001), unpublished.
- [30] L.S. Ma, P. Junger, J. Ye, J. Hall, Opt. Lett. 19, 1777, (1994).
- [31] B. C. Young, et al., Laser Spectroscopy XIV Int. Conf., World Scientific, p.61 (1999).
- [32] FCS-12 Field Cancelling System, Oxford Instruments.
- [33] P. Barton, et al., Phys. Rev. A 62, 032503 (2000).
- [34] T. Gudjons, B. Hilbert, P. Seibert, and G. Werth, Europhys. Lett. 33, 595 (1996).
- [35] M. Block, P. Seibert, O. Rehm and G. Werth Eur. Phys. Journ. D 7, 461 (1999).
- [36] M. Knoop, M. Vedel, and F. Vedel, Phys. Rev. A 52, 3763 (1995).
- [37] A. Steane, Appl. Phys. B. 64, 623 (1997).