Entanglement between an electron and a nuclear spin
Abstract
We report on the preparation and detection of entangled states between an electron spin 1/2 and a nuclear spin 1/2 in a molecular single crystal. These were created by applying pulses at ESR (9.5 GHz) and NMR (28 MHz) frequencies. Entanglement was detected by using a special entanglement detector sequence based on a unitary back transformation including phase rotation.
pacs:
03.67.-a, 03.65.Ud, 33.35.+r, 76.30.-vThe entanglement between two spins 1/2 is at the heart of quantum mechanics. Ever since a so-called ”paradox” was formulated by Einstein, Podolsky and Rosen (EPR) Einstein et al. (1935), referring to local measurements performed on the individual spins of a delocalized entangled pair, properties of entanglement and its consequences for quantum physics has been discussed in great detail Greenberger et al. (1989). In the context of quantum information processing (QIP) entanglement has been considered as a resource for quantum parallelism (speedup of quantum computing) Deutsch (1985); Deutsch and Josza (1992); Grover (1997) and quantum cryptography Bennet and G.Brassard (1984); Bennet et al. (1992). A number of these quantum algorithms have been demonstrated in NMR (nuclear magnetic resonance) quantum computing Cory et al. (1997); Gershenfeld and Chuang (1997); Knill et al. (1998).
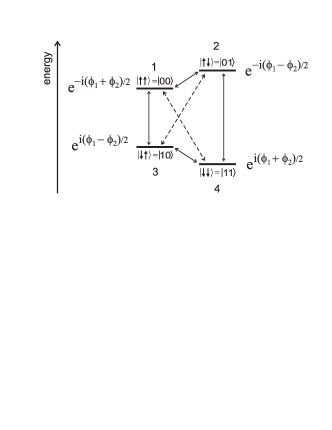
In this contribution we report on the experimental preparation and observation of the entangled states of an electron spin and a nuclear spin in a crystalline solid. The spins considered here are a proton and a radical (unpaired electron spin) produced by x-ray irradiation of a malonic acid single crystal McConnell et al. (1960). This leads to the partial conversion of the CH2 group of the malonic acid molecule to the radical ∙CH where the dot marks the electron spin. In a strong magnetic field the following four Zeeman product states exist where the arrows label the states of the electron and the nuclear spin. Equivalently we will use a qubit labelling as . The energy level diagram corresponding to the electron-proton spin system is shown in fig. 1, where we have also indicated the possible ESR () and NMR transitions () of the individual spins by solid arrows.
What we are aiming at are states of the type
| (1) |
These represent all four possible entangled states of a two qubit system, also called the Bell states of two spins 1/2. They correspond to a superposition of the states in fig. 1 connected by dashed arrows.
Electron spin resonance (ESR) was performed at X-band (9.49 GHz) at K. The low temperature was chosen only for reasons of signal-to-noise ratio. The two well resolved ESR lines due to the ∙CH proton depend on the orientation of the single crystal and were observed at magnetic fields of 338.2 mT and 339.2 mT with a linewidth of 0.5 mT for the ESR and about 1 MHz for the ENDOR (electron nuclear double resonance) line. This orientation corresponds to a principal axis of the hyperfine tensor. There are two different proton NMR transitions. We applied pulsed ENDOR techniques to one of them at the frequency of 28.05 MHz.
In the high temperature approximation we express the Boltzmann spin density matrix as with (for ) and where the pseudo Boltzmann density matrix is defined as which corresponds to an equal polulation of the states and () and equivalently and () with . We used here the assumption that the Larmor frequency of the nuclear spin is much smaller than the Larmor frequency of the electron spin . Note that the pseudo-pure density matrix can be expressed as corresponding to the pure state .
In what follows we will prepare density matrices corresponding to the Bell states according to eqn. (1). Since we will apply selective transitions we need to consider only a three level subsystem for each of the Bell states. In order to prepare all four states and we only need to apply transition selective excitations to either of the three level subsystems 1,2,3; 1,2,4; 1,3,4 or 2,3,4. Here we restrict ourselves to the sublevels 1,2,4 for creating the states and 1,2,3 to create the states. As an example we treat the state in detail. It corresponds to the well known Einstein Podolsky Rosen (EPR) state Einstein et al. (1935). The preparation of proceeds by first applying a selective -pulse to the transition to create the following pseudo pure populations: , , of the 1,2,3 three level subsystem. The corresponding pseudo pure density matrix of the three-level subsystem (1,2,3) represents the pseudo pure state . The creation of the states can now be achieved by the pulse sequence followed by where the plus sign in creates the state. Here we use the abbreviation for a selective pulse at the transition with rotation angle . The label refers to an electrons spin transition, whereas the label stands for a nuclear spin transition. The corresponding unitary transformation results in
| (2) |
In order to create the plus sign in must be chosen. For completeness we note that the states can be created by following the same line of reasoning when starting from the sublevels 1,2,4 with a preparatory -pulse at the transition. Next the pulse sequence followed by is applied creating the state except an overall minus sign. Other scenarios using the other sublevels are possible and will be presented in a more extensive publication.
In order to prove that the state has indeed been created we apply a density matrix tomography which is based on the phase dependence of the entangled state as already sketched in fig. 1. The phase factors noted there represent the phase dependence of the corresponding states under rotation about the quantization axis (z-axis). This corresponds to the unitary transformations and leading to . A single ESR transition () will have a phase dependence under z-axis rotation, whereas a single NMR transition () will have a phase dependence . Each of the entangled states and is characterized by a linear combination of both phases. This is another manifestation of the fact, that these states are global states and no local measurement on the single qubits reveals any information about the entangled state.
Since the entangled state is not directly observable we need to transform it to an observable state. Our entangled state detector therefore corresponds to a unitary back transformation comprised of e.g. followed by applied to the state . In order to distinguish entangled states from other superposition states we encode their characters in the phase dependence under z-rotation as discussed before. Therefore we apply phase shifted pulses of the type and which corresponds to a rotation about the z-axis by the angles and . The complete detector sequence now reads
| (3) |
Since our observable is the ESR transition intensity, detected via an electron spin echo, the entangled state tomography corresponds to the evaluation of the following signal strength for
| (4) |
where is the fictitious spin 1/2 of the transition. With the current definitions we obtain the expression
| (5) |
Alternatively we have used for the detection of the states the sequence
| (6) |
leading to a detector signal for
| (7) |
with
| (8) |
A more detailed discussion of the phase dependence of the detector signal will be presented in a more extended publication.
The phase shifts were implemented by incrementing the phase of the individual detection pulses in consecutive experiments according to with . The artificial phase frequencies were arbitrary chosen as MHz and MHz. Examples of different phase increments are shown in fig. 2.

Four different sets of phase variations were chosen to demonstrate the individual and combined phase frequencies. In fig. 2 a, b we have set (a) or (b) in order to demonstrate the and dependence as a reference. The corresponding spectra (see fig. 3 a, b) are obtained after Fourier transformation. These would also be observed for non-entangled superposition states of either ESR () or NMR transitions (). The characteristics of the entangled states shows up in the combined phase dependence (see eqns. 5 and 8). This is demonstrated for the state in fig. 2 c where the interferogram already shows the phase difference behavior which is even more clearly evident from the spectral representation of fig. 3c showing a line at the difference frequency . In a similar way the states were created which under the corresponding tomography sequence show a phase dependence as which is evident from the interferogram (fig. 2d) and more clearly from the phase spectrum (fig. 3d) leading to a spectral line at .

Here we have used an ensemble of electron-nuclear spin pairs with a mixed state density matrix. Like in all so far published NMR quantum computing experiments the corresponding entangled state would be better termed pseudo entangled states Cory et al. (1997); Gershenfeld and Chuang (1997); Knill et al. (1998). However, we point out that the same pulse sequences could be applied to a pure state electron-nuclear spin pair in order to create the discussed entangled states. Also the same Bell state detection sequences proposed here would apply. In fact the same phase dependence would be observed for pure states. Moreover, the experiments presented here would reach the quantum limit (see Warren et al. Warren et al. (1997)) according to the PPT (positive partial transpose) criterion Peres (1996); Horodecki et al. (1996) at which corresponds to a temperature = 2.576 K for an ESR frequency of 95 GHz.
Theoretically the scenario reported here might seem to be obvious, however, experimentally this type of experiment is rather demanding because of the extreme difference of the ESR and NMR linewidth and the duration of the microwave and radio-frequency pulses. We have used the following typical values: ns for the ESR and s for the NMR -pulses. Entanglement is achieved with these in ns. However, because of the broad ESR and NMR lines a complete excitation of the transitions could not be obtained with these pulses. This leads to errors in the effective rotation angles of the corresponding pulses. As a consequence of this an incomplete creation of the entangled states results, leading to residual separable states. These are expected to vary as and . In order to estimate this effect we calculate the resulting phase dependence of the detector signal (electron spin echo) for the deviation of the -pulses at ESR () and NMR () frequencies which results in
| (9) | |||||
with , and up to fourth order.
We note that the pulse errors introduce (j=1,2) dependencies in addition to the expected dependence of the entangled state. In order to reduce the dependencies in the detector signal we have applied a phase cycling procedure where the two signals and were added. This eliminates the dependencies but retains the dependence of the entangled state. This procedure was applied to the data presented in figs. 2 and 3.
We acknowledge a financial support by the German Bundesministerium für Bildung und Forschung (BMBF).
References
- Einstein et al. (1935) A. Einstein, B. Podolski, and N. Rosen, Phys. Rev. 47, 777 (1935).
- Greenberger et al. (1989) D. M. Greenberger, M. A. Horne, and A. Zeilinger, in Bell’s Theorem, Quantum Theory and Conceptions of the Universe (Kluwer Academic Publishers, Dordrecht, 1989), p. 69.
- Deutsch (1985) D. Deutsch, Proc. R. Soc. London A 400, 97 (1985).
- Deutsch and Josza (1992) D. Deutsch and R. Josza, Proc. R. Soc. London A 439, 553 (1992).
- Grover (1997) L. K. Grover, Phys. Rev. Lett. 79, 325 (1997).
- Bennet and G.Brassard (1984) C. H. Bennet and G.Brassard, in Proc. IEEE Int. Congerence on Computers, Systems and Signal Processing (IEEE, New York, 1984).
- Bennet et al. (1992) C. H. Bennet, F. Besette, G. Brassard, L. Salvail, and J. Smolin, J. Cryptol 5, 3 (1992).
- Cory et al. (1997) D. G. Cory, A. F. Fahmy, and T. F. Havel, Proc. Natl. Acad. Sci. USA 94, 1634 (1997).
- Gershenfeld and Chuang (1997) N. A. Gershenfeld and I. L. Chuang, Science 275, 350 (1997).
- Knill et al. (1998) E. Knill, I. Chuang, and R. Laflamme, Phys. Rev. A 57, 3348 (1998).
- McConnell et al. (1960) H. M. McConnell, C. Heller, T. Cole, and R. W. Fessenden, J. Am. Chem. Soc. 82, 766 (1960).
- Warren et al. (1997) W. S. Warren, N. Gershenfeld, and I. Chuang, Science 277, 1688 (1997).
- Peres (1996) A. Peres, Phys. Rev. Lett. 77, 1413 (1996).
- Horodecki et al. (1996) M. Horodecki, P. Horodecki, and R. Horodecki, Phys. Lett. A 223, 1 (1996).