Experimental demonstration of quantum state tomography and qubit-qubit interactions for rare-earth-ion based solid state qubits
Abstract
We report on the implementation of quantum state tomography for an ensemble of Eu3+ dopant ions in a Y2SiO5 crystal. The tomography was applied to a qubit based on one of the ion’s optical transitions. The qubit was manipulated using optical pulses and measurements were made by observing the optical free induction in a phase sensitive manner. Fidelities of % for the combined preparation and measurement process were achieved. Interactions between the ions due to the change in the ions’ permanent electric dipole moment when excited optically were also measured. In light of these results, the ability to do multi-qubit quantum computation using this system is discussed.
pacs:
3.67.Lx,82.53.Kp,78.90.+tI Introduction
Rare earth ions doped into inorganic crystals are promising candidates for demonstrating quantum computing operations Pryde et al. (2000); Ichimura (2001); Ohlsson et al. (2002). In such a computer it is envisioned that the quantum information would be stored in the nuclear states of the ions. These can have life times of many hours Yano et al. (1991) and coherence times have been observed as long as 80 ms ell . However, the single and multi-qubit operations would be carried out optically. The single qubit operations are possible because of long coherence times for the optical transitions Equall et al. (1997). These long coherence times result in homogeneous linewidths which are much smaller than both the hyperfine splitting and the available Rabi frequencies at which the transitions can be driven. Further to this the large ratio of inhomogeneous (typically GHz) to homogeneous (sub kHz) linewidths allow many different qubits to be addressed. The multi-qubit operations would be carried out using the strong electric dipole-dipole interaction between the ions’ optical transitions. This interaction is due to the fact that the ions have a permanent electric dipole moment which is different for the ground and excited states Huang et al. (1989); Graf et al. (1998). This interaction has the advantage that quantum information transferred to the nuclear transitions is insensitive to such interactions Alexander
The nuclear state of the ions can be initialised to very high fidelity using optical pumping.
Here we demonstrate the ability to address a spectrally narrow subset of the ions. We place their states at any given point on the Bloch sphere and then read out their states using a sequence of optical pulses, thus demonstrating their utility as qubits. The interaction between these qubits due to the electric dipole-dipole interactions Huang et al. (1989); Graf et al. (1998) between the ions is measured. From measurements of these interactions we determine the conditions required to demonstrate two qubit operations.
II Experimental
The setup used was similar to that used in Pryde et al. (2000). A highly stabilized dye laser was used with an established stability of better than 200 Hz over timescales of 0.2 s. The light incident on the sample was gated with two acousto-optic modulators (AOMs) in series. These allowed pulses with an arbitrary amplitude and phase envelope to be applied to the sample. The overall frequency shift introduced by the AOMs was 10 MHz. The transmitted light was combined with a laser beam unshifted in frequency in a Mach-Zehnder interferometer. The beat signal detected with a photo-diode was combined in phase and quadrature with a 10 MHz reference to allow phase sensitive detection. In addition to the setup of Pryde et al. (2000) an auxiliary optical beam and radio frequency (RF) fields were used to repump the ground state hyperfine levels. The measurements were carried out with the crystal in the temperature range 3-5 K.
The Y2SiO5 sample had 0.5 at.% europium, which occupies the yttrium sites in the lattice. There are two stable isotopes of europium of near equal abundance and there are two different crystallographic sites for yttrium in the lattice. The experiment was performed on the 151Eu ions that substituted for yttrium at “site 1” Yano et al. (1991).
Applying optical pulses of definite area requires that all the ions experience the same generalized Rabi frequency. This requirement is problematic for a number of reasons. It requires the spread in resonance frequencies of the ions (c. 10 GHz for the whole sample) to be much smaller than the on-resonance Rabi frequency (c. 500 kHz available with 200 mW of laser power). It also requires that all ions have the same oscillator strength, which means that the resonant transition must be from the same ground state hyperfine level to the same excited state hyperfine level for all the ions. Further to these it also requires illuminating all the ions with the same intensity of light rather than the normal Gaussian laser beam profile.
Optical holeburning techniques similar to those introduced by Pryde et. al.Pryde et al. (2000) were used to isolate a subset of ions to which accurate area pulses could be applied. All the ions that were not wanted in the subset of ions and that had a resonance close to the laser were optically pumped to another hyperfine level and thus far from resonance with the laser. The procedure was as follows: First all ions with a resonance close to the laser frequency were optically pumped to another hyperfine level. Then one RF field and the auxiliary optical beam was applied to the sample. The RF field was swept in frequency MHz and the auxiliary optical beam was shifted from the laser frequency by 95.9 MHz. The effect was to repump the 151Eu ions with the transition frequency close to that of the laser into the ground state. These transitions are shown on the energy level diagram, FIG. 1, the hyperfine splittings given are those measured by Yano et al. Yano et al. (1991) and from such splittings one would calculate a offset for the auxiliary beam of 96.3 MHz rather than 95.9 MHz. The reason for this discrepancy is the MHz uncertainty in the excited state hyperfine splittings. The value of 95.9 MHz was obtained by adjusting the offset until the absorbative feature that it created was centered on the laser frequency.

This resulted in a 300 kHz wide feature with a Lorentzian-like lineshape. This was then narrowed to a 50 kHz feature with a rectangular lineshape by applying ‘zero area pulses’ to the ions. The laser beam is modulated with an envelope given by the difference of two sinc () functions. The lengths and amplitudes of the two sinc functions were chosen to so that the resulting pulse excited all the ions with a transition frequency within 500 kHz of the laser except those within 25 kHz of the laser.
The spread in the optical frequencies of the resulting subset was then narrow compared to the available resonant Rabi frequencies, however because of the spatial distribution of intensity across the laser beam we do not yet have an ensemble to which we can apply precise area pulses.
To select out ions in a particular region of the laser beam, a series of 4 s long pulses were applied to the sample. Some of the ions experienced a pulse and were left in the ground state while ions that saw a different intensity were pumped to a different hyperfine level. Ten pulses were applied with an 8 ms delay between them to allow the excited ions to decay. Afterwards it could be concluded from the free induction decays for various pulse lengths that the Rabi frequency spread of the ensemble was of the order of 10%.
For pedagogical reasons it is helpful to define an explicit phase reference. The phase reference for the experiment was given by the light that would hit the sample if there was no phase shift applied in the RF drives. The pulse sequence used for the tomography consisted of three pulses each separated by 70 s. First a pulse of an arbitrary length and with arbitrary phase relative to the phase reference. This was followed by a 2 s long pulse in phase with the phase reference, to rephase the inhomogeneous broadening in the sample. At s a 1 s long pulse was applied that was also in phase with the phase reference. The axes for the Bloch vectors were chosen such that the ground state () was along the negative axis and laser pulses that were in phase with the phase reference caused rotations about the axis.
The first pulse was used to create an arbitrary state, and the coherent emission resulting from this and the rest of the sequence constituted a measurement of this state. The first pulse was therefore viewed as causing a rotation of the state vector on the Bloch sphere and the following two pulses viewed as a rotation of both the state vector and the Bloch sphere itself. At each point the coherent emission measures the projection of the state onto the horizontal plane. Thus the amplitude of the component of the emission after the first pulse that was in phase (in quadrature) with the phase reference was proportional to () for the initial state. This coherent emission decayed over (1/(50 kHz)) due to the inhomogeneous linewidth of the ensemble. The ensemble rephased at 140 s and at that time a 1 s long pulse was applied. As the ensemble was rephasing before the pulse the amplitude of the emission in phase (in quadrature) with the phase reference was proportional to () for the initial state. After the pulse the amplitude of the emission in phase (in quadrature) with the phase reference was proportional to () for the initial state. These measurements over-determine the initial Bloch vector, and linear least squares was used to extract the measured Bloch vector. The length of the Bloch vector was calibrated using two particular input states: prepared using a pulse with zero phase shift and the state which required no preparation.


The fidelity is given by , where is the input state and is the measured density matrix. A significant contribution to the error in the tomography process was the shot to shot variation in the number of ions to which the process was applied. The requirement of phase coherence for the 200 s of the tomography sequence was easily satisfied by the laser. However the preparation of the spike took approximately 10 s, leading to the possibility that the laser drifts a significant fraction of the 50 kHz width of the spike in this time. This caused a shot to shot variation in the number of ions to which the tomography was applied which in turn had the effect of scaling the length of the measured Bloch vector. If a state that is being measured can be assumed to be pure, the measured Bloch should be normalized. This normalization makes the tomography process insensitive to drifts in the number of ions to which the process is applied. This leaves the inhomogeneity in the Rabi frequencies as the main source of error in the process.
The fidelity of the combined state preparation and tomography are shown in table 1.
| State | Fidelity | Fidelity |
|---|---|---|
| assuming | ||
| pure state | ||
| 0.95 | 0.95 | |
| 0.95 | 0.95 | |
| 0.96 | 0.97 | |
| 0.96 | 0.97 | |
| 0.88 | 0.89 | |
| 0.88 | 0.96 | |
| 0.81 | 0.99 |
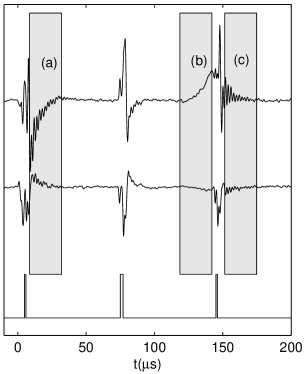
The results of one particular experimental shot are shown in FIG. 3. Here the state to be measured is created at s with a pulse unshifted in phase. This puts the Bloch vector along the axis. This gave coherent emission out of phase with the laser, which decayed as the inhomogeneous broadening dephased the ensemble. At s the pulse was applied to rephase the inhomogeneous broadening. This should have caused no polarisation of the ions and thus produced no coherent emission. As s approaches the ensemble rephased on the opposite side of the Bloch sphere producing coherent emission in phase with the laser. At s a pulse was applied which takes the ions down to the ground state, stopping the coherent emission. The high frequency ringing superimposed on the emission following the application of the pulses is due to the pulses exciting the edges of the trenches in which the spikes lie.
III The coherent interaction between two ensembles
Interactions between the europium ions were also measured. Each europium ion in Eu:Y2SiO5 has a permanent electric dipole moment which changes by a few percent when the ion is excited optically. A europium ion will see a change in electric field and hence its resonant frequency changes when a nearby ion is excited Huang et al. (1989); Graf et al. (1998).
This interaction is large for ions that are close, however when working with two ensembles each of which constitute a small fraction of the inhomogeneous line, the distance from a particular member of one ensemble to any member of the other is much larger than the crystal’s mean inter-dopant separation. Because of the random nature of the relative positions of a given pair of ions, the excitation of one ensemble causes a random shift in the resonance frequencies of each of the members of the other.
In order to measure the frequency shifts in one ensemble due to the excitation of another the approach of Huang et al. is used Huang et al. (1989). A photon echo sequence is applied to a spike. During the sequence a perturbing pulse is applied to another spike prepared 5 MHz away. When the perturbing pulse was applied just after the pulse the amplitude of the echo was reduced significantly. When the perturbing pulse was applied just after the pulse the reduction in the amplitude of the echo was much smaller. This confirms that the perturbing pulse induces a frequency shift which, if applied at the start of the sequence, is rephased. This result shows that the frequency shift caused by exciting the second qubit is constant over a time which is approximately that of the excited state lifetime.
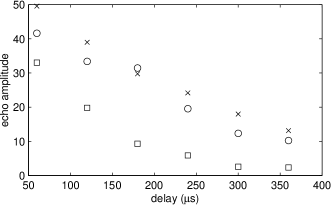
From FIG. 4 we can see that the excitation of the perturbing ensemble causes a spread of kHz ( s) in the resonant frequencies. The ensemble to which the perturbing pulses were applied was prepared by burning a trench and then burning back an antihole. This kHz wide feature has approximately of the ions. This corresponds to a mean inter-dopant separation 100 times greater than for the full ensemble or nm. As we can expect the interaction to scale as , ions separated by the mean inter-europium distance in this sample can be expected to see shifts of GHz.
In order to do multi-qubit quantum computation, in addition to the other forms of inhomogeneity that were overcome in this work, one would have to overcome the problem of inhomogeneity in ion-ion interaction strength. When working with two spikes in the inhomogeneous line the mean shift of frequencies in one ensemble is a small percentage of the other’s inhomogeneous linewidth. This makes the method of Ohlsson et. al. Ohlsson et al. (2002) for overcoming interaction strength inhomogeneity very difficult to implement as it relies on selecting ions pairs with frequency shifts greater than the inhomogeneous linewidth of the ensembles.
IV Conclusion
In conclusion we have demonstrated quantum state tomography on Eu3+ dopant ions in Y2SiO5, with fidelities of typically % achieved. We also measured the frequency shifts of one ensemble of dopant ions caused by the excitation of another group of dopant ions. The results of these measurements suggest that if we can achieve high fidelity single qubit operations on ensembles 300 kHz wide then multi-qubit operations will be possible.
We were restricted to working with Rabi frequencies of 250 kHz by the bandwidth of the modulation system used to apply the pulses and by the available laser power. Intensities of 200 W/cm2 are needed for 250 kHz Rabi frequencies. It is envisioned that the use of moderately higher laser powers, smaller spot sizes, improvements to the modulation system and perhaps the use of composite pulse sequences will allow the use of ensembles with this larger spectral width. The larger average interaction strengths associated with this should allow the demonstration of two qubit operations for ensembles of ions.
The authors would like to thank Geoff Pryde and Neil Manson for their helpful comments on the manuscript.
References
- Pryde et al. (2000) G. J. Pryde, M. J. Sellars, and N. Manson, Phys. Rev. Lett. 84, 1152 (2000).
- Ichimura (2001) K. Ichimura, Optics Comm. 196, 119 (2001).
- Ohlsson et al. (2002) N. Ohlsson, R. K. Mohan, and S. Kröll, Optics Comm. 201, 71 (2002).
- Yano et al. (1991) R. Yano, M. Mitsuanga, and N. Uesugi, Opt. Lett 16, 1884 (1991).
- (5) Elliot Fraval, Personal Communication.
- Equall et al. (1997) R. W. Equall, Y. Sun, R. L. Cone, and R. M. Macfarlane, Phys. Rev. Lett. 72, 2179 (1997).
- Graf et al. (1998) F. R. Graf, A. Renn, G. Zumofen, and U. P. Wild, Phys. Rev. B 58, 5462 (1998).
- Huang et al. (1989) J. Huang, J. M. Zhang, A. Lezama, and T. W. Mossberg, Phys. Rev. Lett. 63, 78 (1989).
- (9) A. L. Alexander, honours Thesis, Australian National University, http://eprints.anu.edu.au/archive/00000761/.