Small regulatory RNAs may sharpen spatial expression patterns
Abstract
The precise layout of gene expression patterns is a crucial step in development. Formation of a sharp boundary between high and low expression domains requires a genetic mechanism which is both sensitive and robust to fluctuations, a demand that may not be easily achieved by morphogens alone. Recently it has been demonstrated that small RNAs (and, in particular, microRNAs) play many roles in embryonic development. While some RNAs are essential for embryogenesis, others are limited to fine-tuning a predetermined gene expression pattern. Here we explore the possibility that small RNAs participate in sharpening a gene expression profile that was crudely established by a morphogen. To this end we study a model where small RNAs interact with a target gene and diffusively move from cell to cell. Though diffusion generally smears spatial expression patterns, we find that intercellular mobility of small RNAs is actually critical in sharpening the interface between target expression domains in a robust manner. We discuss the applicability of our results, as examples, to the case of leaf polarity establishment in maize and Hox patterning in the early Drosophila embryo. Our findings point out the functional significance of some mechanistic properties, such as mobility of small RNAs and the irreversibility of their interactions. These properties are yet to be established directly for most classes of small RNAs. An indirect yet simple experimental test of the proposed mechanism is suggested in some detail.
I Introduction
Morphogenesis proceeds by sequential divisions of a developing embryo into domains, each expressing a distinct set of genes. Each combination of genes is associated with a particular cell identity. At advanced stages of development, most genes that define cell identity are either highly expressed (‘on’) or strongly inhibited (‘off’) in a given cell. For example, two adjacent domains may be differentiated by a high expression of some genes in one, and low expression in the other. In such cases it is important that cells of the two populations do not intermix. Moreover, the number of cells that show intermediate levels of expression, typically found at the interface between the two sets, should be kept to a minimum. These demands are necessary in order to unambiguously define the identity of each cell. A spatial gene expression pattern that obeys these demands is said to exhibit a sharp interface.
A crucial step in setting the interfaces of gene expression patterns is often the establishment of a concentration gradient of molecules called morphogens. Some morphogens are transcription factors which regulate gene expression directly NussleinVolhard1988a ; NussleinVolhard1988b . Others are ligands that bind cell-surface receptors signaling the activation of target expression OConnor2006 . Since morphogens act in a concentration-dependent manner, a morphogen gradient may be transformed into a gradient of its target messenger RNA (mRNA).
In principle, a single morphogen interacting cooperatively with its target enhancer can generate a sharp interface in the target transcription profile, by modulating the rate of its mRNA transcription as a function of the nuclear spatial coordinate Janssens2006 . This may be done e.g. by cooperative binding to a receptor or to a promoter Lebrecht2005 or by zero-order ultrasensitivity Melen2005 . As an example, in fruit-fly early embryonic development Hunchback transcription depends on the cooperative binding of about Bicoid molecules Gregor2007b . An obvious limitation in this mechanism is the need for large cooperativity factors or cascades of reactions, which make it prone to fluctuations and slow to adapt Berg2000 ; Thattai2002 ; Gregor2007b ; Howard2007 . Recently, the role of small regulatory RNAs in establishing developmental patterning has been observed in plants Juarez04 ; Kidner04 ; Nogueira07 and animals Aboobaker2005 . In particular, it has been suggested that microRNAs (miRNAs) confer accuracy to developmental gene expression programs Stark2005 . This raises the possibility that small RNAs aid morphogen gradients in establishing sharp interfaces between ‘on’ and ‘off’ target-gene expression.
In this study we formulate a mathematical model in which small regulatory RNA help morphogens to determine cell identity by sharpening morphogen-induced expression patterns. For specificity we assume here that the small RNA belongs to the miRNA family, and consider other classes of small RNA in the Discussion. miRNAs constitute a major class of gene regulators that silence their targets by binding to target mRNAs. In metazoans primary miRNA transcripts are transcribed and then processed both inside and outside of the nucleus to form mature transcripts approximately 21 nt in length that are then loaded into the RNA-induced silencing complex (RISC) Kloosterman2006 . They are found in plants Baulcombe2004 and animals Bartel2004 , including human Lewis2005 , and are predicted to target a large fraction of all animal protein-coding genes Brennecke2005 ; Grun2005 ; Lewis2005 . In plants miRNAs are known to affect morphology Chen2004 ; Juarez04 ; Kidner04 implying that they play an important role in determining cell identity. This is underscored by the fact that the spatiotemporal accumulation of miRNAs is under tight control in plants Valoczi2006 , fly Aboobaker2005 ; Biemar2005 and zebrafish Giraldez04072006 .
Our model is constructed in one spatial dimension, namely along one spatial axis. Domains of gene expression are laid out along this axis, and we assume no significant variance along other, perpendicular axes. Two key ingredients of the model are a strong interaction between miRNA and mRNA and intercellular mobility of the miRNA. Within this framework miRNAs generate a sharp interface between those cells expressing high levels of the target mRNA and those expressing negligible levels of mRNA. We use physical arguments to understand the range of parameters where this sharpening occurs. Our model predicts that the spatial position of the interface is precisely determined: mobile miRNAs spatially average individual cellular fluctuations without compromising the interface sharpness. We use computer simulations to show that this is also true even with low copy numbers. A consequence of our model is that a local change to the transcription profiles can induce a nonlocal effect on the mRNA concentration profile; we outline an experiment to detect this nonlocal property. We also consider the special case where the miRNA and target transcription profiles coincide Mansfield2004 . We show that miRNAs preserve their sharpening function provided mobile miRNAs change irreversibly to an immobile state before interacting with their targets. By separating mobility and interaction in this way, the target is rescued from miRNA-mediated silencing in selected cells thereby generating a sharp expression pattern. Finally we consider possible applications of these ideas in plants and fruit fly.
II Model and results
II.1 Formulation of model from available biological evidence
Our theory comprises three central elements. First, miRNA and its target are taken to be transcribed in a space-dependent manner. Second, we assume that the interaction between miRNA and target irreversibly disable the target mRNA from being translated into proteins; this for example may be done by promoting the degradation of the target. Furthermore, the miRNA molecule itself may be consumed during this interaction. Last, we allow for the possibility that miRNAs move between cells. Before defining the model, let us review the available data regarding each of these processes.
microRNAs and their targets are often expressed in a coordinated manner Hornstein2006 . We consider two classes. In the first, the regulatory network is designed to express the miRNA and its targets in a mutually exclusive fashion. For example, the expression patterns of the miRNA miR-196 and its target Hoxb8 are largely non-overlapping in mouse Mansfield2004 and chick Hornstein2005 . Similarly, the nascent transcripts of Ubx, still attached to the DNA, are expressed in a stripe near the center of the early embryo, while nascent transcripts of its regulator, iab-4, are simultaneously observed in nuclei posterior to this domain Ronshaugen2005 . A recent large-scale study in fly showed that miRNAs and their target genes are preferentially expressed in neighboring tissues Stark2005 . Likewise, in mouse Farh12162005 and in human Sood2006 predicted miRNA targets were found at lower levels in tissue expressing the cognate miRNA than in other tissues.
Cases in the second class are characterized by co-transcription of the miRNA and its targets Hornstein2006 , as occurs for example in mouse cardiogenesis Zhao2005 and human cell proliferation ODonnell2005 . Likewise, microRNAs encoded within the Hox gene cluster may target co-expressed Hox genes Mansfield2004 .
Our model assumes that the synthesis rate of the miRNA and its target are smoothly varying along a spatial axis, . This, for example, may be the result of a common morphogen regulating (either directly or indirectly) the two species. The transcription profiles and of the miRNA and its target, resp., may be anti-correlated (the first class above) or highly correlated (the second class).
The detailed interaction between miRNAs and their targets is currently a topic of intense investigation ValenciaSanchez2006 ; Pillai2007 . miRNAs induce the formation of a ribonucleoprotein complex (RISC). Targeting of a specific mRNA by a RISC is done via (often imperfect) base-pair complementarity to the miRNA Bartel2004 . Upon binding, protein synthesis is suppressed by either translation inhibition or mRNA destabilization ValenciaSanchez2006 ; Pillai2007 . While it is likely that miRNA can go through a few cycles of mRNA binding Zamore2004 , the increased endonucleolytic activity conferred by the miRNA makes it plausible that the miRNA is sometimes degraded in the process. In addition, evidence suggests that mRNAs which are translationally repressed by miRNA may be co-localized to cytoplasmic foci such as processing-bodies Liu2005 ; ValenciaSanchez2006 ; Pillai2007 , which are enriched with endonucleases, or stress granules Leung2006 . Taken together, these facts make it improbable that miRNAs act in a fully catalytic manner.
A pair of mRNA-miRNA reactions that describe a spectrum of plausible scenarios is
| (1) |
where represents the mRNA concentration and represents that of the miRNA. Here, is the average number of targets degraded by a given miRNA before it is itself lost in the process. These reactions may be realized in different ways. For example, the two species may reversibly form a complex that is then subject to degradation. Another possibility is that the two species irreversibly associate to form an inert complex. Furthermore, the reaction between the species may be reversible, as long as the typical dissociation time is much longer than the relevant biological time scale. One way in which the cell may control the dissociation time is by regulating exit of the RNA pairs from P-bodies Levine2007_miRNA .
Can miRNAs move from cell to cell? siRNAs, another important class of small RNAs, are known to illicit non cell autonomous RNA silencing in plants, worms, fly and possibly mouse (reviewed in Voinnet2005 ). This may also be the case for trans-acting siRNA Nogueira07 . Evidence in favor of intercellular mobility of miRNA is found in pumpkin Yoo2004 . There, miRNAs have been found in the phloem sap which is transported throughout the plant by phloem tissue. In animals, many small RNAs, including many miRNAs, were found in exosomes from mouse and human mast cell lines, which can be delivered between cells Valadi07 .
In our model we consider the possibility that miRNA migrate from cell to cell. Mobility of the miRNA species is likely to rely on active export from the cell followed by import to neighboring cells, or perhaps on direct transport between cells. On the tissue scale, these transport processes are expected to result in effective diffusion. We therefore ignore the small-scale transport processes and model miRNA mobility as pure diffusion.
Finally, we combine these processes into a steady-state mean-field model given by
| (2a) | |||
| (2b) |
The terms describe autonomous degradation (i.e., by processes independent of the other RNA species) and the term describes coupled degradation of both RNA species. Note that the case (where miRNA may go through multiple rounds of interactions with target mRNAs) can also be brought into this form by rescaling (2a). Mobility of the miRNA is described by an effective diffusion constant . The spatial coordinate measures distance along one dimension of a tissue. All our numerical results shall be presented in units of the tissue size, i.e. .
II.2 microRNAs may sharpen domain boundaries.
As described above, a desired target protein profile comprises a domain of cells which express this protein abundantly, adjacent to a domain of cells where this protein does not accumulate. Furthermore, one requires that the number of cells with intermediate expression levels lying in between the two domains be minimized—this is our definition of a sharp interface. In this section we discuss one scenario where the mutual consumption of a diffusive miRNA and its target leads to such a sharp interface in the mRNA profile.
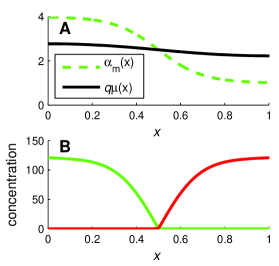
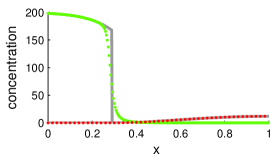
We assume that some morphogen controls the transcription rate of the target. The transcription profile—namely, the transcription rate as a function of the spatial coordinate of the nucleus—is laid down as a smooth gradient, falling from one end of the developing tissue (which, for convenience, will be called ‘left’) towards the other end (‘right’). Motivated by a recent study that showed that miRNA and their targets are preferentially expressed in neighboring tissues Stark2005 , we focus on the scenario where the miRNA transcription is controlled in a fashion opposite to that of the mRNA: miRNA transcription is peaked at one end of the tissue (where the mRNA transcription rate is minimal), and decreases towards the other end (where the mRNA transcription rate is maximal). The kind of ‘mutually exclusive’ transcription profiles we have in mind is depicted in Fig. 1A. In this figure, and hereafter, we denote the mRNA transcription profile by and the miRNA transcription profile by , explicitly noting their dependence on the spatial coordinate . We note that, in the absence of miRNA-target interaction and of miRNA diffusion, the concentration profiles of mRNA and miRNA simply follow their transcription profiles, Fig. 1A and D. Each is rather smeared and overlaps the other near the centre of the tissue.
Before studying the full model, it is instructive to consider first the interacting system in the absence of miRNA diffusion. In the context of mutually exclusive transcription profiles, we expect that each cell would be dominated by one RNA species (either the miRNA or the target mRNA), which we will call the majority species, and be depleted of the other, minority species. In other words, we are making the critical assumption that the decay of the minority species in each cell is governed by the interaction with the other species (rather than by its autonomous degradation). This assumption can be made quantitative in terms of the model parameters; see Eq. S4 of the Supporting Information. Under this assumption, which we refer to as the strong interaction limit, it is straightforward to show (Eq. S6 of the Supporting Information) that the density of the majority species in each cell is proportional to the difference between the two transcription rates in that cell, whereas the minority species is essentially absent. Consequently, in the context of mutually exclusive transcription profiles, the mRNA level becomes vanishingly small in any cell for which , namely every cell to the right of the point where the two transcription profiles are equal. The concentration profiles of the two RNA species are shown in Figs. 1B and E, where one can see that the mRNA and miRNA spatial expression domains are now complementary and more sharply defined.
The threshold response that arises when both RNA species do not diffuse from cell to cell provides insurance against the possibility that the mRNA transcription profile is not as step-like as is required for unambiguous cell differentiation. In other words, miRNA regulation acts as a failsafe mechanism whereby incorrectly transcribed low-abundance transcripts in the region are silenced, while correctly transcribed high-abundance transcripts in the region are only mildly affected Stark2005 ; Hornstein2006 . This threshold response in the target profile has been observed in the context of small RNAs—another class of post-transcriptional regulators—in bacteria Levine2007_sRNA .
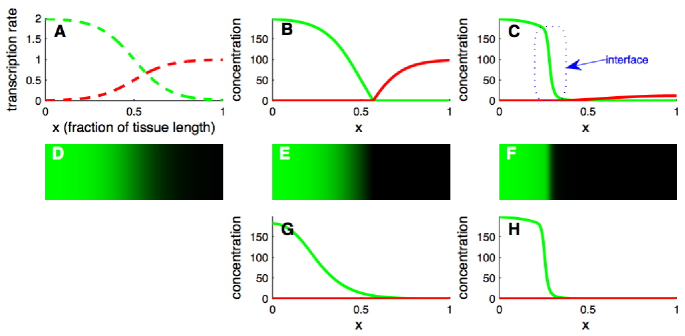
We now return to our full model, which allows for diffusion of the miRNA. To simplify the analysis let us keep the strong-interaction limit, described above (and in Eq. S4 of the Supporting Information). In general, one expects that diffusion makes the miRNA profile more homogeneous, and this is confirmed by exact numerical solution of the model, as shown in Fig. 1C. Surprisingly however, the mRNA profile does not become smoother. In fact, Figs. 1C and F show that this profile actually develops a sharper drop from high to low mRNA levels than there was in the absence of diffusion. More specifically, miRNA diffusion creates an interface between high and negligible target expression. Increasing diffusion moves the interface deeper into the mRNA-rich region and thereby accentuates the drop in mRNA level across the interface. Although some miRNA diffusion is required to establish a sharp interface in the mRNA profile, the diffusion constant cannot be too large. As Fig. 1G demonstrates, increasing the diffusion constant may result in smearing the interface. A corresponding increase in the interaction strength, , can compensate for the increased diffusion and regain the interface sharpness (Fig. 1H). We will quantify these observations below.
Diffusing miRNAs can find themselves in one of two very different regions. In the miRNA-rich region (including the region to the right of the point where the transcription profiles are equal) miRNA decay mainly via processes independent of their interaction with the target. In this region our model boils down to a simple diffusion process accompanied by linear decay. Such processes are characterized by a length scale, denoted by , which essentially measures how far a miRNA can travel (due to diffusion) before being consumed (by autonomous degradation). It is thus an increasing function of the diffusion constant , but a decreasing function of the independent decay rate . On the other hand, in the mRNA-rich region, a miRNA decays mainly via co-degradation with its target. In this region miRNAs decay faster, and one expects them to be able to travel over much shorter distances than in the miRNA-rich region. In fact, diffusion in this region is characterized by another, smaller, length scale, denoted by , which again increases with but is now a decreasing function of the interaction strength, . Explicit expressions for the two length scales are given in the Supporting Information (Eqs. S8 and S9).
To obtain a sharp interface in the mRNA profile, miRNAs should be able to travel from the miRNA-rich zone into the mRNA-rich zone. This means that the first length-scale, , should be of the same order as the tissue length. This, for example, can be achieved if the diffusion constant is large enough. On the other hand, the vicinity of the interface is governed by the other length scale . This length scale is what determines the ‘width’ of the interface, namely the number of cells which exhibit intermediate levels of mRNA expression (see blue box in Fig. 1C). A sharp interface therefore means a small value of and one way to achieve a small value of is to make the diffusion constant small enough. These two contradicting requirements on suggest that there might be an intermediate range of values for the diffusion constant that allows for a sharp interface, but also raises the suspicion that this range may be very small and require some fine tuning. This , however, is not the case: the fact that is strongly dependent on (while does not depend on at all), and that strongly depends on (while does not) means that the range of allowed values of can be set as large as needed.
In the Supporting Information we develop an approximate analytical expression for the mRNA profile in terms of the various parameters and the ‘input’ profiles and . There are two lessons to be learned from this exercise. First, the interface established by the mRNA-miRNA interaction is effectively impermeable to miRNA diffusion in the strong-interaction limit. The system thus separates into two parts which—in steady-state—do not exchange molecules between them. This property allows one to calculate the position of the sharp interface in the mRNA profile.
The second lesson comes from the resulting equation for the interface position. This equation takes the form of a weighted spatial average of the difference between the two transcription profiles (Eq. S14). In other words, in order to determine the position of the interface, one needs to sum over many nuclei. In the sum, each nucleus contributes the difference between the local transcription rates of the two RNA species. Clearly, these rates may be influenced by many factors, and in a description which is somewhat closer to reality one would expect this difference to be fluctuating around . However, the interface position is a sum of these fluctuating objects, and one might hope that the sum of these fluctuations—which are uncorrelated—would be close to zero. In this case, the interface position would be robust to fluctuations of this type. Indeed, a stochastic simulation of the model shows no change in the interface position (or structure), as compared with the deterministic model discussed so far (see Supporting Information for details of our simulations).
In passing let us note that the conditions required so far — namely, strong interaction between the miRNA and its target and small — may be reached by making the mRNA completely stable (). However, our analysis shows that in this case the system would never relax to a steady state, since target mRNAs would accumulate at the left end of the tissue without limit. Our analysis here is therefore only applicable if the mRNA molecules undergo autonomous degradation, in addition to the miRNA-dependent degradation.
II.3 microRNAs can define sharp stripes of gene expression.
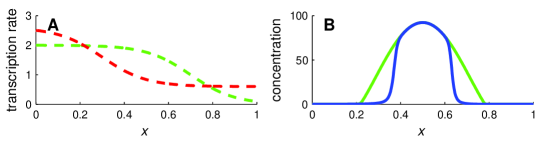
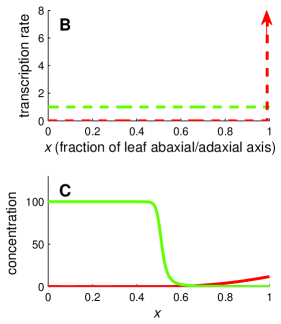
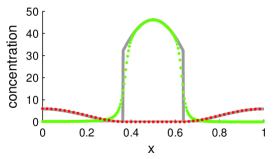
Using the insight gained in the previous section we briefly show how a stripe is formed when the miRNA transcription profile is similar to but displaced from it (Fig. 2A). Suppose, for example, that the synthesis of an miRNA and its target are activated by the same transcription factor. In any given nucleus, the two promoters experience the same concentration of this transcription factor. However, they need not react in the same way: if the binding affinity of one promoter is stronger than that of the other, there will be intermediate concentrations of the transcription factor where the first promoter will be activated while the other will not. Such a scenario is depicted in Fig. 2A, where a common transcription factor, which exhibits a spatial gradient, activates the target gene as well as the miRNA gene. In this case, the target promoter has higher affinity to the transcription factor than the miRNA promoter. Thus, some cells in the middle of the developing tissue express the target mRNA but not the miRNA.
Unlike the case studied in the previous section, where the transcription profiles crossed at one point, here the transcription profiles cross at two points. Let us retrace our steps in the previous section, by first considering the case of no diffusion. For low values of the interaction rate , the miRNA and mRNA profiles are qualitatively similar to their transcription profiles. As is increased however, miRNA deplete mRNA levels at any position where and thus confine mRNA expression to a stripe between the two crossing-points of the transcription profiles (green curve in Fig. 2B). Can diffusion make this profile sharper, as in the previous case? Indeed, diffusing miRNAs which survive annihilation on the left and right diffuse into the interval between the two crossing points, and establish sharp interfaces in the mRNA concentration profile. The resulting stripe resides within this interval, but is narrower (blue curve in Fig. 2B). It is therefore important that parameters would allow for sharp interfaces, without making the stripe too narrow (or even disappear). Therefore, to sustain a well-defined stripe of gene expression, , which determines the interface width, must be much smaller than the distance between the two crossing points of the transcription profiles.
One can use the same analytic method mentioned earlier to calculate the new positions of the stripe boundaries (see Supporting Information). This exemplifies how the method can be used to analyze geometries of increasing complexity.
II.4 Standard experimental methods may be used to probe the sharpening mechanism.
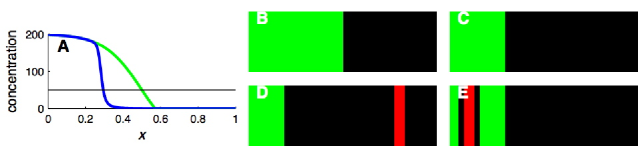
The sharp interface that we predict can be detected directly in an imaging experiment, provided the light intensity varies linearly with mRNA concentration, and that the spatial resolution is high enough. However an experimental readout is often not so faithful to the underlying concentration profile. In the worst case, the apparatus’ readout is binary: concentrations below an apparatus-dependent threshold are not detected, while concentrations larger than this illicit a concentration-independent fluorescence intensity. In such scenarios, it is impossible to tell a smooth and sharp concentration profile apart as both yield a sharp interface in the binary readout (Figs. 3A-C). In contrast, low spatial resolution may make a sharp interface appear smoother then it really is.
Fortunately, our model of miRNA-mediated morphogenic regulation possesses another signature that is visible at such coarse experimental resolution. To detect this signature, one needs to overexpress the miRNA in a small patch of cells (hereafter denoted the ‘patch’). Our model then predicts that this patch has a qualitatively different effect depending on which side of the interface it occurs. We confine ourselves in this section to the case of opposing transcription profiles of the miRNA and its target..
The technique one uses to generate the patch may differ according to the stage of development under consideration. In the early blastoderm stages of Drosophila development, for example, a Gal4 driver may be used to drive expression of the miRNA in those cells where an endogenous gene is expressed Blair2003 . Many endogenous genes are expressed in stripes along the anterior-posterior axis during these stages and some have dedicated enhancers for single stripes Small1992 ; Janssens2006 . As an example, the yeast FLP-FRT recombination system has been used to misexpress the gap gene knirps in a stripe by placing it under the control of the eve stripe 2 enhancer kosmanSmall1997 .
In later stages of Drosophila development, e.g. imaginal discs, one technique is the random generation of a mosaic of mutant clones (patches) by mitotic recombination Blair2003 ; Eldar2005 . The patches are generated at a low rate and one then screens for those embryos containing a single patch.
We model the localized overexpression of miRNA by an effective local increase of the transcription rate by an amount . This increase in transcription rate occurs in a small number of cells, which in our model is about of the tissue length. More specifically, we choose a position for the center of the patch and, for every point that resides within a distance of , we change the transcription rate from to . Here is the ‘width’ of the patch, which takes a value of the tissue length.
Consider positioning the patch first in the miRNA-rich region of the developing tissue, Fig. 3D. One sees that, even if positioned at a distance from the expression domain of the target, the effect of the additional miRNA is to push the interface toward the left. The localized patch of cells therefore has a nonlocal effect.
Intuitively, one identifies three contributors to this effect. First, of course, is the mobility of the miRNA. Diffusing miRNAs are the carriers of information from the patch to the other cells. However, these miRNAs need to be able to travel appreciable distance before they are consumed, and thus the second factor is the fact that the patch was introduced in a region where miRNAs only experience autonomous degradation, and can thus travel a distance (which we have assumed to be of the same order as the tissue length). Finally, the spreading miRNAs become localized again near the sharp interface with the mRNA-rich region. This is simply due to the fact that miRNA cannot penetrate this region over a distance that is larger than (which we have assumed to be smaller than the width of a single cell). This intuitive picture is quantified in the Supporting Information.
This experiment should be contrasted with one in which the overexpressing patch is positioned in the mRNA-rich region, as shown in Fig. 3E. Such ectopic miRNA expression has a local effect, with excess miRNA creating a hole in the mRNA expression domain. The hole edges constitute two additional interfaces in the system, the sharpness of each again determined by .
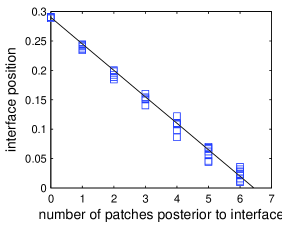
One can go further and make a quantitative prediction, relating the number of patches in a mosaic of patches with the lateral shift in the interface position. To first approximation, one needs to count the number of patches in the miRNA-rich region, and disregard completely the patches in the mRNA-rich region. The displacement of the interface position is then linearly proportional to this number; see Supporting Information for details. Simulated experimental results that would verify this prediction are shown in Fig. 4.
The distinct nonlocal effect described above does not occur when the miRNA are unable to move between cells. Also, we have checked (for the parameters used in this study) that it does not occur when the miRNA acts purely catalytically. Rather, both miRNA mobility and a strong interaction between miRNA and target are required. The presence or absence of the nonlocal effect would therefore confirm or falsify the hypotheses that miRNA are mobile and that they interact stoichiometrically with mRNA while in this mobile state.
II.5 Irreversible localization of miRNA
Finally, we consider the case where the miRNA transcription profile overlaps that of its target. This case is somewhat puzzling, as one would hardly see the point of going through this futile cycle. In particular, in the framework we have presented so far, such a coincidence of transcription profiles would reduce steady-state mRNA (and miRNA) levels to negligible amounts in all cells. It is therefore not surprising, that this scenario is very atypical Farh12162005 . Where it does occur, e,g, possibly in the Hox gene network Mansfield2004 , one explanation may be that this is only a transient state. In such a scenario, for example, the miRNAs keep the target mRNA from being expressed, until such time when their translation is required. At that time, transcription of miRNA may be stopped, or alternatively their interaction with mRNA may be inhibited. Induction of the target would then proceed rapidly. An example where miRNA expression is regulated during the course of cellular development is found in T-lymphocytes Neilson2007 ; and regulation of miRNA-target interaction has been demonstrated in neurons of Drosophila Ashraf2006 . Nevertheless, we consider here the case where the overlapping transcription profiles do represent—at least for some period of time—a steady-state, and show that with a slight change in the dynamics, this layout can still spatially separate the tissue into a region of high mRNA concentration and a region where target mRNAs do not accumulate.
The key ingredient required to rescue mRNA levels from global obliteration is the possibility that only those miRNA localized to a cell interact with their target. Moreover, miRNA localization needs to be irreversible; the case of rapid reversible localization reduces to the model studied in previous sections.
The separation of transport and interaction may occur in a number of ways. miRNA may be transported from cell to cell in a vessel that needs to be dismantled before miRNA can interact with mRNA. Alternatively, the interacting form of the RISC complex may be immobilized. Another possibility is that interaction between miRNA and mRNA is limited to specific loci in the cell, from which miRNA cannot escape. These scenarios—and others—are summarized by a model where miRNA acquire a mobile state immediately after synthesis, and can switch into an interacting localized state at later times
| (3) |
This model, a straightforward generalization of (1), is given in Eq. S17 of the Supporting Information, where we also solve it exactly.
Diffusion of the mobile miRNAs now occurs independently of the target, since mobile miRNAs do not interact with the mRNA species. Accordingly, a steady-state mobile miRNA profile is formed. This profile is smoother than the miRNA transcription profile (since this profile is formed by diffusion with no interaction). In particular, it is lower in those regions where the transcription profile was higher than average and higher in those where was lower than average; See Fig.5A.
The steady-state mobile mRNA profile is the source for localized miRNA, which are thus generated in a spatially dependent manner. Their generation rate follows this profile, up to a factor , the localization rate. This generation rate profile replaces the miRNA transcription profile of the previous sections. Thus, the role of the mobile miRNA is simply to set this profile. Left only with the localized miRNA and their mRNA targets, diffusion should not be considered any further. This problem has already been discussed in the context of opposing transcription profile, and from that discussion we realize that mRNA concentration still vanishes at any point where the miRNA generation rate profile exceeds that of the mRNA. In contrast, mRNA level is proportional to the difference between the two profiles wherever the mRNA transcription rate is larger. Fig. 5B shows how the tissue is separated into two regions. We have shown that this scenario boils down to a diffusion-free problem, so the mechanism which could sharpen the interface between the two regions is absent. As expected, the interface in Fig. 5B is smooth.
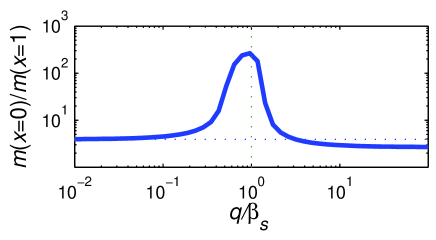
The value acquired by the localization rate is important for the success of the scheme described above. If this rate is too high, the resulting mobile-miRNA profile – and therefore, the localized miRNA generation profile – would coincide with the transcription profile, ultimately resulting in mRNA depletion in all cells. On the other hand, if the localization rate is too low, the generation rate of mobile miRNA may be lower than the mRNA synthesis rate in all cells, and have very little effect on their accumulation. Taken together, we find that for ‘optimal’ performance, should be set around the miRNA degradation rate, . However, our analysis shows, that no fine-tuning is required – in fact, setting within an order of magnitude from would still yield two distinguishable regions along the developing tissue (Fig. S4 and text in the Supporting Information).
III Discussion
In this study we have analyzed a model where miRNAs sharpen target gene expression patterns by generating an interface between high and low target expression. Such an interface can be directly detected provided the signal is not amplified to saturation and provided the threshold for detection is sufficiently low.
A necessary condition for the interface to occur is that the miRNA and target are co-degraded; a mode of miRNA-target interaction where miRNAs only promotes mRNA degradation without being affected is insufficient. One can in principle test the existence of coupled miRNA-mRNA degradation by inhibiting the transcription of mRNA and monitoring its decay rate, which in this case would be time-dependent, . We note also that a stoichiometric interaction may complicate the interpretation of sensor transgene experiments Mansfield2004 , as the transgene would then sequester miRNA and thereby alter the original expression patterns.
The interface between low and high mRNA levels is characterized by low copy numbers of both RNA species. In such cases fluctuations in the copy number of either species may have macroscopic effects. For example, a small RNA-target pair in bacteria show enhanced fluctuations when their transcription rates become comparable Elf2003 ; Levine2007_noise . These fluctuations can in turn give rise to noise-induced bistability, which manifests itself experimentally as diversity in a population of cells Levine2007_noise . We performed Monte-Carlo simulations of our model, but found that fluctuations have no macroscopic effect, even near the transition point where copy numbers of both species are low. This in-built robustness to fluctuations arises because the interface position is determined by an integrated transcriptional flux which averages out individual cellular fluxes. Thus spatial averaging results in high spatial precision without smearing the interface.
The model studied here is defined in one spatial dimension, which we identified as the axis perpendicular to the interface between domains of gene expression. A two-dimensional extension of the model where the transcription profiles are independent of the axis and diffusion occurs equally in both directions leaves the solution independent of the axis. However, we have further generalized the model to allow the mRNA transcription profile to have a slight dependence on (see Supporting Information). We find that the results described above hold also in this two-dimensional case. Furthermore, we find that fluctuations in the interface position along the -axis are considerably reduced by the miRNA regulation. A detailed analysis is deferred to a future study.
Strong cooperative activation, as often occurs in morphogenetic regulation at the transcriptional level (e.g. Bicoid has about five binding sites in target promoters of Drosophila), would seem to make pattern formation by morphogens inherently susceptible to temperature variations Houchmandzadeh2002 ; Segel1975 . Nevertheless, embryonic patterning appears to be quite robust to temperature variations, as has been documented for Hunchback Houchmandzadeh2002 and for Eve Lucchetta2005 in Drosophila. The only cooperative reaction required in the model presented in this work is coupled degradation of miRNA and mRNA, suggesting the possibility that miRNAs filter fluctuations arising from temperature variations.
Candidate systems in which to test the ideas put forth in this study include the establishment of dorsoventral (adaxial/abaxial) leaf polarity in plants, as well as the segmentation of the early Drosophila embryo. We now discuss these two systems in some detail.
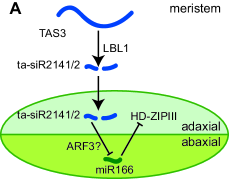
Leaf polarity in plants is established shortly after the emergence of the leaf primordium from the meristem. Specification of leaf polarity depends on the Sussex signal Sussex51 , a meristem-borne signal that specifies adaxial cell fates. Members of class III of the homeodomain-leucine zipper (HD-ZIPIII) proteins specify adaxial fate Emery03 ; Juarez04 . In Arabidopsis and in maize, the polar expression pattern of these genes results from their inhibition by two miRNAs, miR165/166, which exhibit a complementary expression pattern Juarez04 ; Kidner04 . Recently it has been shown that in maize, restriction of miR165/166 to the abaxial side of the developing leaf depends on the polarized expression of LBL-1, a protein involved in the biosynthesis of trans-acting RNAs, ta-siR2141/2 Nogueira07 . Possible targets of ta-siR2141/2 include members of the arf3 gene family (a transcription factor that is expressed abaxially) as well as members of the miR166 family Nogueira07 . While miRNAs in plants are thought to act mainly cell-autonomously Alvarez06 , DCL4-dependent siRNAs, such as ta-siR2141/2, may exhibit cell-to-cell movement Voinnet05 .
The following model is consistent with these data (Fig. 6A). The RNA transcript TAS3 is cleaved to produce ta-siR2141/2 in the meristem. These small RNAs then propagate (diffuse) into the adaxial side of the leaf, inhibiting the expression of miR166 either directly or through the ARF3 transcription factor. The target (either miR166 or ARF3) is transcribed uniformly throughout the leaf, and is localized to the cell where it is synthesized. If one further assumes that the interaction between ta-siR2141/2 and its target is non-catalytic, then this model belongs to the class of models studied in this work, and can therefore exhibit a sharp interface between the abaxial domain of high target expression and the adaxial domain of no expression; see Fig. 6. In agreement with this model is the low abundance of ta-siR2141/2 in Arabidopsis Allen05 ; Williams05 , despite their distinct phenotypic role.
Early embryonic development in Drosophila proceeds via a cascade of gene activities that progressively refine expression patterns along the anterior-posterior axis of the embryo. A recent study of the expression patterns of nascent miRNA transcripts suggests that a number of miRNAs may play a role in this process. The miRNAs miR-309clus, miR-10 and iab-4 (which all reside between annotated mRNA genes on the genome), and miR-11, miR-274 and miR-281clus (which all reside within introns of annotated genes) are all expressed in a graded fashion along the anterior-posterior axis of the blastoderm embryo Aboobaker2005 ; Kosman2004 .
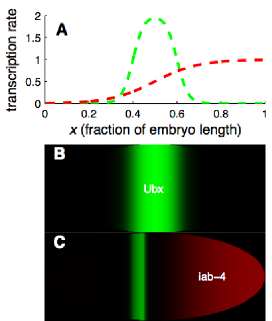
The complementary transcription profiles of iab-4 and its target Ubx at stage 5 of development make this miRNA-target system a candidate for the sharpening mechanism proposed in this study. The early Ubx transcript pattern is broadly distributed over the posterior half of the embryo, becoming localized to a stripe at the centre of the embryo by the completion of cell formation AkamMartinezArias1985 ; Ronshaugen2005 , probably as a result of transcriptional repression by Hunchback in the anterior and posterior regions of the embryo ZhangBienz1992 . The nascent transcript profile of its regulator, iab-4, is broadly distributed posterior to this stripe Ronshaugen2005 .
It may be the case that iab-4 is also expressed before cell formation and that the absence of cell walls makes iab-4 mobile. The much larger Ubx mRNA, on the other hand, may be effectively stationary on the timescales of interest Gregor2007b . Furthermore, the transcription profiles of iab-4 and Ubx at stage 5 do not seem to overlap Ronshaugen2005 , suggesting that iab-4 intercellular mobility may be crucial to allow it to interact with Ubx at this stage of development. Assuming then that only the miRNA iab-4 is mobile, the complementary expression patterns of iab-4 and its target Ubx measured in Ref. Ronshaugen2005 is consistent with our model of miRNA-induced sharpening. Sample profiles predicted by the model are shown in Fig. 7.
A possible difficulty with regard to applying our model to Ubx/iab-4 is that the system may not have reached steady state before stage 6 when cells begin to migrate. In particular, no Ubx protein was detected at stage 5, possibly because of the time needed to transcribe the large Ubx locus Ronshaugen2005 .
Like iab-4, the miRNA miR-10 is also expressed at stage 5 in a broad posterior region along the anterior-posterior axis Aboobaker2005 . The homeotic gene Scr is a predicted target of miR-10 Enright2003 and is also expressed in the blastoderm at stage 5 Gorman1995 . The miR-10 site in the Scr 3’UTR is likely to be functional because the pairing is well conserved in all drosophilid genomes and because the miRNA site is conserved in the Scr genes in mosquito, the flour beetle and the silk moth Brennecke2005 . Unlike Ubx, the protein of Scr is detected at this stage of development in a stripe of ectodermal cells about 4 cells wide in the parasegment-2 region, though it may not be functional at this time as the protein (a transcription factor) was not localized to the nucleus Gorman1995 . This spatial expression pattern is proximal to the anterior limit of miR-10 expression Gorman1995 ; Aboobaker2005 . Hence the interaction of miR-10 with Scr at stage 5 of Drosophila development is also a candidate for the sharpening mechanism.
The sharpening mechanism is most effective when the spatial transcription profiles of miRNA and target are regulated in such a way as to be mutually exclusive. The genomic locations of the miRNAs iab-4 and miR-10 are proximal to their targets, which is certainly consistent with the possibility of coordinated regulation Pearson2005 .
IV acknowledgments
It is a pleasure to thank William McGinnis, Martin F. Yanofsky and Jeffrey A. Long for useful discussions. This work has been supported in part by the NSF-sponsored Center for Theoretical Biological Physics (grant numbers PHY-0216576 and PHY-0225630).
References
- (1) Driever W, Nusslein-Volhard C (1988) Cell 54:83–93.
- (2) Driever W, Nusslein-Volhard C (1988) Cell 54:95–104.
- (3) O’Connor MB, Umulis D, Othmer HG, Blair SS (2006) Development 133:183–193.
- (4) Janssens H, Hou S, Jaeger J, Kim H, Myasnikova E, et al. (2006) Nature Gen 38:1159–1165.
- (5) Lebrecht D, Foehr M, Smith E, Lopes FJP, Vanario-Alonso CE, et al. (2005) Proc Natl Acad Sci 102:13176–13181.
- (6) Melen GJ, Levy S, Barkai N, Shilo BZ (2005) Mol Syst Biol 1:e1–e11.
- (7) Gregor T, Tank DW, Wieschaus EF, Bialek W (2007) Cell In press.
- (8) Berg OG, Paulsson J, Ehrenberg M (2000) Biophy J 79:1228–36.
- (9) Thattai M, van Oudenaarden A (2002) Biophy J 82:2943–2950.
- (10) Tostevin F, ten Wolde PR, Howard M (2007) PLoS Comput Biol 3:e78.
- (11) Juarez MT, Kui JS, Thomas J, Heller BA, Timmermans MC (2004) Nature 428:84–8.
- (12) Kidner CA, Martienssen RA .
- (13) Nogueira FT, Madi S, Chitwood DH, Juarez MT, Timmermans MC (2007) Genes Dev 21:750–5.
- (14) Aboobaker AA, Tomancak P, Patel N, Rubin GM, Lai EC (2005) Proc Natl Acad Sci 102:18017.
- (15) Stark A, Brennecke J, Bushati N, Russell RB, Cohen SM (2005) Cell 123:1133.
- (16) Kloosterman WP, Plasterk RHA (2006) Developmental Cell 11:441.
- (17) Baulcombe D (2004) Nature 431:356.
- (18) Bartel DP (2004) Cell 116:281.
- (19) Lewis BP, Burge CB, Bartel DP (2005) Cell 120:15.
- (20) Brennecke J, Stark A, Russell RB, Cohen SM (2005) PLoS Biol 3:e85.
- (21) Grün D, Wang YL, Langenberger D, Gunsalus KC, Rajewsky N (2005) PLoS Comp Biol 1:e13.
- (22) Chen X (2004) Science 303:2022.
- (23) Valoczi A, Varallyay E, Kauppinen S, Burgyan J, Havelda Z (2006) The Plant J 47:140.
- (24) Biemar F, Zinzen R, Ronshaugen M, Sementchenko V, Manak JR, et al. (2005) Proc Natl Acad Sci 102:15907.
- (25) Giraldez AJ, Mishima Y, Rihel J, Grocock RJ, Dongen SV, et al. (2006) Science 312:75–79. doi:10.1126/science.1122689.
- (26) Mansfield JH, Harfe BD, Nissen R, Obenauer J, Srineel J, et al. (2004) Nature Genetics 36:1079.
- (27) Hornstein E, Shomron N (2006) Nat Gen Supp 38:S20.
- (28) Hornstein E, Mansfield JH, Yekta S, Hu JKH, Harfe BD, et al. (2005) Nature 438:671–674.
- (29) Ronshaugen M, Biemar F, Piel J, Levine M, Lai EC (2005) Genes & Dev 19:2947.
- (30) Farh KKH, Grimson A, Jan C, Lewis BP, Johnston WK, et al. (2005) Science 310:1817–1821. doi:10.1126/science.1121158.
- (31) Sood P, Krek A, Zavolan M, Macino G, Rajewsky N (2006) Proc Natl Acad Sci 103:2746.
- (32) Zhao Y, Samal E, Srivastava D (2005) Nature 436:214–20.
- (33) O’Donnell KA, Wentzel EA, Zeller KI, Dang CV, Mendell JT (2005) Nature 435:839–43.
- (34) Valencia-Sanchez MA, Liu J, Hannon GJ, Parker R (2006) Genes & Dev 20:515.
- (35) Pillai RS, Bhattacharyya SN, Filipowicz W (2007) Trends Cell Biol In press.
- (36) Haley B, Zamore PD (2004) Nat Struct Mol Biol 11:599–606.
- (37) Liu J, Valencia-Sanchez MA, Hannon GJ, Parker R (2005) Nat Cell Biol 7:719.
- (38) Leung AKL, Calabrese JM, Sharp PA (2006) Proc Natl Acad Sci 103:18125–18130.
- (39) Levine E, Levine H, Ben-Jacob E (2007) In preparation.
- (40) Voinnet O (2005) FEBS Letters 579:5858.
- (41) Yoo BC, Kragler F, Varkonyi-Gasic E, Haywood V, Archer-Evans S, et al. (2004) Plant Cell 16:1979.
- (42) Valadi H, Ekstrom K, Bossios A, Sjostrand M, Lee JJ, et al. (2007) Nat Cell Biol .
- (43) Levine E, Kuhlman T, Zhang Z, Hwa T (2007) In preparation.
- (44) Blair SS (2003) Development 130:5065–5072.
- (45) Small S, Blair A, Levine M (1992) EMBO J 11:4047–4057.
- (46) Kosman D, Small S (1997) Development 124:1343–1354.
- (47) Eldar A, Barkai N (2005) Dev Biol 278:203–207.
- (48) Neilson JR, Zheng GXY, Burge CB, Sharp PA (2007) Genes & Dev 21:578–589.
- (49) Ashraf SI, McLoon AL, Sclarsic SM, Kunes S (2006) Cell 124:191–205.
- (50) Elf J, Paulsson J, Berg OG, Ehrenberg M (2003) Biophys J 84:154–70.
- (51) Levine E, Khulman T, Zhang Z, Hwa T (2007) In preparation.
- (52) Houchmandzadeh B, Wieschaus E, Leibler S (2002) Nature 415:798.
- (53) Segel IH (1975) Enzyme Kinetics. New York: Wiley.
- (54) Lucchetta EM, Lee JH, Fu LA, Patel NH, Ismagilov RF (2005) Nature 434:1134–1138.
- (55) Sussex IM (1951) Nature 167:651–2.
- (56) Emery JF, Floyd SK, Alvarez J, Eshed Y, Hawker NP, et al. (2003) Curr Biol 13:1768–74.
- (57) Alvarez JP, Pekker I, Goldshmidt A, Blum E, Amsellem Z, et al. (2006) Plant Cell 18:1134–51.
- (58) Voinnet O (2005) FEBS Lett 579:5858–71.
- (59) Allen E, Xie Z, Gustafson AM, Carrington JC (2005) Cell 121:207–21.
- (60) Williams L, Carles CC, Osmont KS, Fletcher JC (2005) Proc Natl Acad Sci U S A 102:9703–8.
- (61) Kosman D, Mizutani CM, Lemons D, Cox WG, McGinnis W, et al. (2004) Science 305:846.
- (62) Akam ME, Martinez-Arias A (1985) The EMBO J 4:1689–1700.
- (63) Zhang CC, Bienz M (1992) Proc Natl Acad Sci 89:7511–7515.
- (64) Enright AJ, John B, Gaul U, Tuschl T, Sander C, et al. (2003) Genome Biol 5:R1.
- (65) Gorman MJ, Kaufman TC (1995) Genetics 140:557.
- (66) Pearson JC, Lemons D, McGinnis W (2005) Nature Reviews Gen 6:893.
- (67) Gillespie DT (1977) J Phys Chem 81:2340.
V Supporting Information
V.1 Parameter Values
Throughout, , . The transcription profiles of Fig. 1 are
| (S1) | |||||
where , , and . In the stripe geometry (Fig. 2), the transcription profile for is as above, with . The transcription profile of the miRNA, is given by
| (S2) |
with and . To test our model for irreversible localization we use the same transcription profiles as in (S1), with .
In the discussion we outline possible applications in two systems: leaf polarity in maize and segmentation in the early Drosophila embryo. Here we did not aim to estimate parameters from experimental data (which, in most cases, is not quantitative enough to allow for parameter inference). Instead, parameters were chosen arbitrarily to allow clear demonstration of possible results. In the case of leaf polarity (Fig. 6) we choose with and . Here is the unit step function. In the Drosophila embryo (Fig. 7), the transcription profile of the iab-4 miRNA is the same as in (S1), while the Ubx mRNA transcription profile is given by
| (S3) |
To study a two-dimensional extension of this model, we let the mRNA transcription profile have a slight dependence on the -direction, e.g. by setting in (Eq. S1), to .
V.2 Strong-interaction limit
Here we define, for the case of no diffusion, what we mean by the strong-interaction limit, but the limit is equally valid when diffusion is present. We make the critical assumption that at any cellular position the decay of the minority species is dominated by coupled degradation; by rescaling Eq. 2 of the main text, this condition amounts to
| (S4) |
In the absence of diffusion, Eq. 2 boils down to a quadratic equation for the steady-state mRNA level , and one can immediately write the solution
| (S5) |
where , which is assumed in (S4) to be small. To zeroth order in , this expression simplifies to
| (S6) |
where , as depicted in Fig. 1C.
V.3 Analytical Approximation
To understand the origin of the length scales and , and their relation to the tissue length when the interface is sharp, consider first the region of space where miRNA are in the majority. In this region, where , we neglect the autonomous-degradation term in (2a), yielding and thus
| (S7) |
Hence miRNA are produced at an effective rate and diffuse over distances of order
| (S8) |
which, as we have argued in the main text, should be comparable to the tissue length, . On the other hand, in the mRNA-rich zone and so the only length scale available to the miRNA is
| (S9) |
where is a typical value of in the mRNA-rich zone. For the mRNA this is the only length scale that competes with the spatial layout provided by the transcription profile and so it must determine the interface width up to a constant prefactor . Hence the second condition for a sharp interface is that . In agreement with the expression in Eq. S9, derived on hueristic grounds, our numerical solutions show that the interface becomes broader when the co-degradation rate is decreased (Fig. 1G) or when the diffusion constant is increased (Fig. 1H). We note that the limit is equivalent to
| (S10) |
In other words, a sharp interface arises when the co-degradation rate of miRNA and target dominates the rate of diffusion over macroscopic distances. Since we are neglecting diffusion of miRNA in the mRNA-rich region, the mRNA profile there is given again by (S6).
Microscopically, miRNA in the miRNA-rich zone diffuse in a landscape dominated by autonomous degradation, leading to the decay length in (S8). Upon entering the mRNA-rich region, co-degradation suddenly overwhelms autonomous degradation of miRNA (), and the miRNA are faced with an effective absorbing boundary. We therefore expect the miRNA concentration to vanish as one approaches the interface from the right. In addition, our picture asserts that the miRNA concentration is vanishingly small everywhere on the left of the interface. Taken together, these two properties impose zero miRNA concentration and zero miRNA diffusive flux at the interface. These two boundary conditions on the miRNA dynamics at the interface between mRNA-rich and miRNA-rich regions, together with the zero-flux condition at , allow us to determine the position of the interface. Furthermore, the interface must lie in the region defined by because co-degradation can dominate autonomous degradation of miRNA only if there is a reservoir of mRNA to co-degrade with.
Armed with this insight into the miRNA profile we may now solve (S7), subject to the boundary conditions and , in terms of a Green’s function. Making use of the zero-flux boundary conditions, the Green’s function of (S7) is
| (S11) |
where
| (S12) |
The miRNA profile is then a weighted spatial average of the net transcriptional flux of miRNA to the right of the interface
| (S13) |
Employing the zero-concentration boundary condition , we arrive at the following implicit equation for
| (S14) |
Solving for requires knowledge only of the transcription profiles. Moreover, one immediately sees that can tolerate fluctuations in the transcription profiles which preserve the integral. This should be contrasted with the non-diffusive case in which reduces to the crossing point of the transcription profiles, , which is less robust to small-number fluctuations.
V.4 Stochastic Simulations
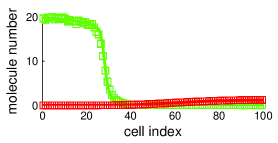
We used the Gillespie algorithm to stochastically simulate the reaction and diffusion events on a one-dimensional grid of cells Gillespie1977 . In this algorithm the next event, as well as the time to the next event, are chosen randomly. A simulation using 100 cells (the approximate anterior-posterior length of the Drosophila embryo during cycle 14) is compared with the corresponding deterministic solution in Fig. S2. Surprisingly, the deterministic solution is a good approximation for mRNA anterior abundances as low as 20 molecules per cell. As expected, in cases where the predicted interface is of the order of a single cell we find that the solution to our model underestimates the width of the interface. This, for example, is the case when the developing tissue becomes as small as 10 cells—the approximate size of the leaf-organ primordium during plant development.
V.5 Stripe Boundaries
We denote the left-most boundary of the stripe by and the right-most by . The location of these interfaces is determined analytically by solving (S7) with zero-flux boundary conditions in the interval (and then enforcing ) and in the interval (and then enforcing ). In the region between the interfaces the mRNA profile is approximately given by ; in the portion of the developing tissue complementary to this the mRNA profile is negligible. The analytic profiles for and are compared with the exact numerical solutions in Fig. S3.
V.6 Experimental Prediction
The nonlocal effect predicted when the miRNA is overexpressed in a small patch of cells can be understood with the aid of (S7). First, integrate this equation from the interface to , both with and without the patch. Then, neglecting the change in the miRNA concentration induced by the patch, one can show that
| (S15) |
In other words miRNAs from the patch diffuse across the tissue towards the region and annihilate all mRNA produced there that would otherwise have maintained the interface at .
As mentioned in the main text, we can make a quantitative testable prediction when there are a number of independent patches. To see this recall that Eq. S15 is an integral relationship. Hence, in the corresponding equation for multiple patches, the left-hand side is proportional to the number of patches, provided we make the reasonable assumption that the patches are uniform in size and transcription rate. Similarly, the right-hand side is proportional to the interface shift, , provided the mRNA transcription profile is sufficiently flat in the interval . Hence the interface position decreases linearly with the number of patches. This prediction can readily be tested using an ensemble of embryos with varying numbers of patches. Simulated experimental results that would verify this prediction are shown in Fig. 4 in the main text.
V.7 Irreversible Localization
We employ this flavor of the model for the special case that the miRNA and mRNA transcription profiles coincide. Mobile miRNA can no longer interact with their targets; only when they flip irreversibly to the localized form
| (S16) |
can they do so. This adds a new equation to our model which now takes the form
| (S17a) | |||||
| (S17b) | |||||
| (S17c) | |||||
Here is the concentration of miRNA in the localized state, and is an effective rate at which mobile miRNA switch into the interacting localized mode. The common transcription profiles of mobile miRNA and mRNA is denoted by . The mobile-miRNA profile is determined only by the third equation and, by analogy with Eq. S13, is a weighted spatial average of . As such the effective transcription profile of immobile miRNA is reduced on the left and increased on the right relative to that of the target The first two equations then reduce to the zero-dimensional case considered earlier in which miRNA clear up mRNA to the right of the point where and cross.
The value of which is most favorable for the failsafe function is . To understand why, it is helpful to consider two limits. In the first, localization dominates all other loss processes for mobile miRNA, i.e. and . Hence all mobile miRNA immediately become immobile, the transcription profiles of mRNA and immobile miRNA coincide (, Eq. S17c), and all mRNA are immediately degraded in all cells. In the second limit, localization is negligible compared with independent degradation, , and very few mobile miRNA become immobile. Consequently and there are practically no immobile miRNA available to affect the target. One measure of the efficacy of the failsafe mechanism (threshold response) is the ratio between mRNA concentration at the two ends of the tissue, . With the transcription profiles and parameters of Fig. 5, this ratio would be in the absence of miRNA regulation, and in its presence. In Fig. S4 we plot this ratio as a function of , keeping all other parameters as in Fig. 5. One sees that the failsafe mechanism is most effective in the intermediate regime where .