Mobility of Min-proteins in Escherichia coli measured by fluorescence correlation spectroscopy
Abstract
In the bacterium Escherichia coli, selection of the division site involves pole-to-pole oscillations of the proteins MinD and MinE. Different oscillation mechanisms based on cooperative effects between Min-proteins and on the exchange of Min-proteins between the cytoplasm and the cytoplasmic membrane have been proposed. The parameters characterizing the dynamics of the Min-proteins in vivo are not known. It has therefore been difficult to compare the models quantitatively with experiments. Here, we present in vivo measurements of the mobility of MinD and MinE using fluorescence correlation spectroscopy. Two distinct time-scales are clearly visible in the correlation curves. While the faster time-scale can be attributed to cytoplasmic diffusion, the slower time-scale could result from diffusion of membrane-bound proteins or from protein exchange between the cytoplasm and the membrane. We determine the diffusion constant of cytoplasmic MinD to be approximately , while for MinE we find about , independently of the processes responsible for the slower time-scale. Implications of the measured values for the oscillation mechanism are discussed.
pacs:
87.16.-b,87.15.Kg,87.15.Rn1 Introduction
The rod-shaped bacterium Escherichia coli usually divides in the center of its long axis between the two segregated copies of its chromosome. The position of the division plane is determined by the Z-ring, a structure built from the protein FtsZ, which is associated with the cytoplasmic membrane and encircles the cytoplasm [1]. Assembly of the Z-ring is targeted to the cell center by two mechansims. For one, formation of the ring around the two copies of the chromosome is inhibited by proteins binding to DNA, a mechanism termed nucleoid occlusion [2, 3]. For the other, the proteins MinC, MinD, and MinE suppress ring formation close to the cell poles [4, 5], leaving the center as the only possible site. MinC is able to depolymerize FtsZ filaments, while MinD and MinE direct MinC to the cell poles. The spatial distributions of MinD and MinE, and hence of MinC, periodically change in time: after dwelling in the vicinity of one pole for about 40s, the proteins get redistributed to the opposite pole [6, 7]. These oscillations do not require the presence of MinC.
Theoretical works have provided strong evidence that the pole-to-pole oscillations are formed by self-organization of MinD and MinE [8]. All mechanisms proposed so far rely essentially in one way or another on the formation of aggregates of membrane-bound MinD. Such aggregates have been observed in vitro and in vivo [9, 10]. The mechanisms can roughly be divided into two classes. In cooperative attachment (CA) models, MinD-aggregates are formed through collective effects during binding to the cytoplasmic membrane [11, 12, 13, 14, 15]. In aggregation current (AC) models, aggregates are formed by mutual attraction after the proteins have bound to the membrane [16, 17]. CA as well as AC models can capture the qualitative features of the Min-oscillations and there is experimental evidence for both processes in E. coli. The strongest hint for aggregation currents is provided by a study of MinD attachment to phospholipid vesicles in the presence of ATPS, a non-hydrolyzable ATP analog [9]. This work suggests a two-step mechanism for the formation of aggregates of membrane-bound MinD involving first the binding of MinD to the membrane and subsequent aggregation. Furthermore, using a yeast two-hybrid assay MinD-MinD interactions were shown to be stronger if both proteins were membrane-bound than if at least one partner was cytoplasmic [18]. On the other hand, the concentration-dependence of MinD binding to phospholipid membranes deviates from Langmuir isotherms [19]. In addition, the amount of MinD binding to liposomes as a function of the MinD-concentration in the surrounding solution could be fitted by a Hill equation with a Hill coefficient of 2 [20]. These two findings clearly suggest some cooperativity during MinD binding to the membrane.
In order to reveal whether cooperative attachment or an aggregation current is the primary cause of the Min oscillations, a quantitative comparison of the models with experiments is necessary. This requires, in particular, to fix the model parameters by measurements. There are several techniques to measure protein mobilities using fluorescence microscopy. Direct measurements of the displacement of individual proteins have been used to determine the mobility of membrane proteins in Caulobacter crescentus [21]. Fluoresence recovery after photobleaching (FRAP), where the fluorescent proteins present in a defined region are bleached and the recovery of the fluorescence is monitored, was used to measure the diffusion constants of cytoplasmic proteins [22]. Fluorescence correlation spectroscopy (FCS) exploits the fluctuations in the fluorescence intensity emanating from an illuminated region in order to assess dynamic properties [23]. To this end, the autocorrelation function is measured for fluctuations around the mean signal. Fitting this to the autocorrelation curve theoretically expected for the process under study then yields the searched-for values. In bacteria, FCS was used to measure the concentration of phosphorylated CheY involved in chemotaxis [24] and transcription activity at the RNA level [25, 26].
We have used FCS to measure the mobility of MinD and MinE tagged to Green Fluorescent Protein (GFP) in E. coli. We found that a simple diffusion process cannot account for the measured autocorrelation curves. We have analyzed the data assuming that either the mobility of membrane-bound proteins or the binding-unbinding dynamics is dominant, and thus obtained key parameters of the various models. As a control we also measured the mobility of GFP and found significant deviations to previous measurements [22].
2 Materials and Methods
2.1 Strains
EGFP and His6-EGFP were expressed in BL21(DE3)pLysS using the vectors pBAT4 and pET9d, respectively (Novagen, CN Biosciences). GFP-MinD was expressed in JS964 [27] (J. Lutkenhaus, U. Kansas, USA) and WM1255 [28] (W. Margolin, U. Texas, USA), and MinE-GFP in WM1079 [28] (W. Margolin, U. Texas, USA). Bacteria were grown overnight in 3ml LB medium at 37∘C together with a concentration of 25 Spectinomycin, 25 Kanamycin, 20 Chloramphenicol and 50 Ampicillin. Of the overnight culture 500 were put in 50 of fresh LB medium containing the same concentration of antibiotics as above, and grown at 37∘C until the optical density (OD) at 600 reached 0.2. Expression of GFP-MinD in JS964 and His6-EGFP in BL21(DE3)pLysS was induced by adding 20 isopropyl--D-thiogalactopyranoside (IPTG). Expression of MinE-GFP in WM 1079 was induced by adding 0.005 L-arabinose. No inducer was used for GFP-MinD expression in WM1255. Then the bacteria were grown at 30∘C for 1-2 hours, usually sufficient to produce visible fluorescence and to see Min oscillations. To reduce background fluorescence from the buffer, LB medium was prepared with 1g of yeast extract per liter. For microscopy an approximatelty mm thick solid slab of agarose (Invitrogene, 15510-027) in LB medium was prepared between a 25mm75mm glass slide and a 18mm18mm cover slide. For sample preparation the cover slide was removed and 3l of cell culture were spread on the agarose pad, which was then recovered with the slide. For each slide, data collection did not last for longer than 2h. Data were acquired at room temperature and none of the bacteria was dividing during a measurement.
2.2 Optical setup
Fluorescence correlations spectroscopy (FCS) measurements were performed on a LSM Meta 510 system (Carl Zeiss, Jena, Germany) using a 40 NA 1.2 UV-VIS-IR C-Apochromat water immersion objective and a home-built detection unit at the fiber output channel: A bandpass filter (AHF Analyse Technik, Tübingen, Germany) was used behind a collimating achromat to reject the residual laser and background light. Another achromat (LINOS Photonics, Göttingen, Germany) with a shorter focal length was used to image the internal pinhole onto the aperture of the fiber of the single photon counting avalanche photo diode (SPCM-CD 3017, PerkinElmer, Boston, MA, USA). The correlation curves were obtained with a hardware correlator Flex 02-01D (correlator.com, Bridgewater, NJ, USA). High magnification laser scanning microscope (LSM) images were taken of the area of interest and the detection volume was placed at the desired position, along the small dimension always in the center, so that there were mainly hoizontal parts of the membrane. Since the LSM and the FCS use the same beam path, the correspondence between FCS spot and LSM image is excellent. The z-position of the spot was stable for many minutes with an accuracy of 100nm, see [29] where the same experimental setup had been used. No high frequency oscillations in the image plane were detectable in the alignment correlation curves. We did not observe any drift within 40 consecutive measurements of 5s each. The waist of the detection volume was determined in calibration measurements with the fluorescent dye Alexa Fluor 488 diffusing freely in water to be nm.
2.3 Theoretical autocorrelation curves
The experimental autocorrelation curves were analyzed by fitting autocorrelation curves expected for different processes. Since the height of the detection volume is larger than the diameter of the bacterium, the cytoplasmic diffusion can be approximated to occur in two dimensions. Fitting with a more refined model taking into account the geometry of the detection volume in the bacterium [30] did not significantly change the values we obtained assuming the simplified geometry. For two independent species diffusing with respective diffusion constants and the correlation curve is [31, 23]
| (1) |
Here, the number fraction of particles of one species is given by , where and , respectively, are the average numbers of particles of the different species in the detection volume. The characteristic relaxation times and are linked to the respective diffusion constants and the width of the detection volume through , . For particles changing between a mobile state (diffusion constant ) and an immobile state, we assume the following reaction kinetics for the fraction of the mobile state , where and are the cytoplasmic and membrane residence times, respectively. The autocorrelation of the fluctuations has the form [31, 23]
where , . For a single species diffusing anomalously in two dimensions the autocorrelation function is given by [32]
| (2) |
Here, , where the anomalous exponent governs the spreading of an initially localized distribution and where is the anomalous transport coefficient.
2.4 Data analysis
The correlation curves were fitted in the time interval
with a weighted nonlinear least-squares fitting
algorithm. Curves were selected automatically based on convergence
of the fit algorithm and goodness of the fit ( for EGFP and
for Min proteins). For the Min proteins, curves were first hand-selected for low and
high intensity phases and then selected automatically for quasi-steady states. The latter was
checked by requiring a constant fluorescence intensity during the measurement.
3 Results and discussion
3.1 EGFP
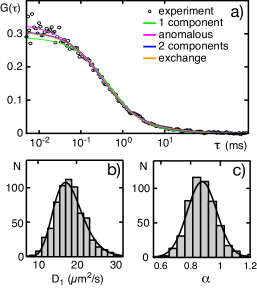
We first measured the autocorrelation of the fluorescence fluctuations of Enhanced Green Fluorescent Protein (EGFP) in living E. coli, see Materials and Methods. A typical correlation curve is depicted in figure 1a. From a fit of the correlation curve (1) expected for a single diffusing species with an apparent diffusion constant of is obtained. There are two sources contributing to the error in the value of the diffusion constant. First, a systematic error results from uncertainties in determining the size of the detection volume. The size of the detection volume is needed for transforming the relaxation time that can be extracted from the correlation curve into a diffusion constant. We estimate this error to be 15%. Secondly, the fit of the expected correlation curve to the data is of finite accuracy due to noise present in the experimental correlation curve (around ). For the curve in figure 1a, the fit quality is reasonable with . In view of the measurements on MinD and MinE, other models were used for analyzing the correlation curves. Fitting the data to the autocorrelation (1) expected for two independent populations of diffusing particles, where is now a fit parameter, the fit quality was significantly improved, . For the curve in figure 1a, the apparent diffusion constant of the fast component is . Furthermore, we considered the case of molecules switching between a mobile and an immobile state. The corresponding autocorrelation is , see (2.3). For the diffusion constant in the mobile state, we found with . Previous reports suggest deviations from normal diffusion of EGFP in vivo, which was attributed to crowding in the cellular environment [35]. We therefore considered anomalous diffusion of EGFP, where the mean square displacement grows as with . Fitting the correlation (2) we obtained an anomalous exponent of and an anomalous transport coefficient with . As can be seen in figure 1a, the different fits are barely distinguishable.
A histogram of the diffusion constants obtained by fitting to 1021 curves is presented in figure 1b. The histogram is well described by a log-normal distribution with a geometric mean of . Within the accuracy of our measurements, different cells give the same value for the EGFP diffusion constant. Hand-selection of curves as is often done in FCS measurements reduced the -confidence interval, but did not change the geometric mean. The fraction of the fast component was , indicating that most of the dynamics can be attributed to diffusion. We arrived at the same conclusion using for the data analysis, see Table 1. Figure 1c presents a histogram of anomalous exponents from analyzing the same curves using . The mean value is
The values of the diffusion constants are surprisingly large in view of previous measurements of the EGFP diffusion constant using FRAP, yielding m, see [22]. There, it was also found that the diffusion constant can be changed significantly by adding a His-tag. We examined His6-EGFP expressed in the same strain as was used for the measurement of EGFP mobility. Using either or , we found a decrease in the diffusion constant of about 20% compared to EGFP. Based on the anomalous diffusion model, we found a slightly reduced value for the anomalous mobility, , while the anomalous exponent remained the same,
3.2 Quasi-steady states during Min-oscillations
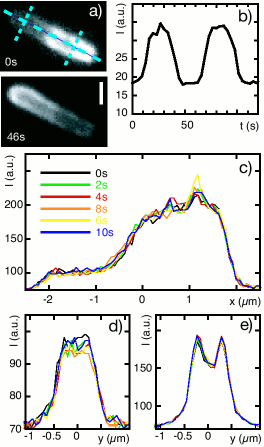
The analysis of fluorescence fluctuations requires a well-defined average state. Seemingly, this is not the case for the Min-system, which oscillates with a period of about 80s [6, 7, 17], see figure 2a. However, there are regions in the bacterium in which the fluorescence signal is quasi-stationary for about 10s. In figure 2b, we present the fluorescence intensity in a confocal volume positioned in one cell half. There are phases of high and low constant fluorescence as well as phases of strongly varying fluorescence. Respectively, these phases reflect the dwelling of MinD in one cell half for a large fraction of a half-period as well as the comparatively rapid transition to the opposite cell half. Figure 2c displays the fluorescence intensity along the bacterial long axis for six different times separated by 2s. The intensity variations during this period are less then . The fluorescence profiles in cross-sections perpendicular to the long axis also show only moderate fluctuations, figure 2d,e. The form of the mean profiles in the low- and high-intensity regions differ significantly: while the profile in the low-intensity region is uni-modal, it is bi-modal in the high-intensity region. This results from a low fraction of membrane-bound MinD in the low-intensity region and a high fraction in the high-intensity region [6]. The fluorescence profiles for different times then indicate that the respective amounts of cytoplasmic and membrane-bound MinD are quasi-stationary within the 10s shown.
3.3 GFP-MinD
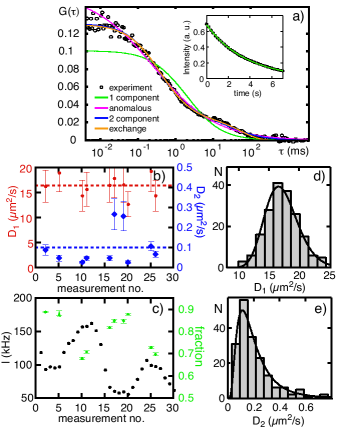
We measured MinD-motility in the strain JS964. For the FCS analysis, we considered only fluorescence curves taken from regions in quasi-steady state. Every individual measurement lasted for 5s. A typical autocorrelation curve is shown in figure 3a. From the graph it is obvious that two distinct time-scales are present. We first checked that neither of them is due to bleaching. To this end we adsorbed EGFP on an untreated cover slip. Then we recorded intensity traces and correlation curves for this immobilized EGFP. The intensity curves could be fitted to an exponential curve with a decay time of a few seconds, see figure 3a inset. The corresponding FCS curves show a decay with a similar characteristic time. These times are larger than the two time-scales apparent in figure 3a. Furthermore, the correlation curves were largely independent of the excitation intensity (data not shown). We conclude that neither of the time-scales is due to bleaching of immobilized molecules. To reduce the already weak contribution to the correlations by bleaching of immobilized molecules even further, we recorded the first correlation curve in an experiment only a few seconds after the laser was switched on.
One of the time-scales detectable in figure 3a is readily attributed to MinD diffusing freely in the cytoplasm. The existence of MinD bound to the membrane suggests two obvious candidate processes leading to the other time-scale visible in the correlation curves. First of all, it could be attributed to the diffusion of MinD on the membrane. Secondly, it could result from the exchange of MinD between the membrane and the cytoplasm. We analyzed the measured correlation curves using separately the two different models. Of course, the two processes are not mutually exclusive. It would thus be desirable to analyze the correlation curves using a model that accounts for diffusion on the membrane as well as for binding and unbinding. However, the expected correlation curve differs only by small amounts from the curves for either of the two alternatives separately. The accuracy of our measurements does not allow distinguishing between them. Note, that a significant fraction of membrane-bound MinD might be immobile as it is incorporated into helices [10]. Since these molecules do not contribute to fluctuations in the average fluorescence intensity, FCS cannot detect them.
We first present the results assuming two states of different mobility. Figure 3b displays the two diffusion constants obtained from fits of (1) to different correlation curves measured on a single cell. We interpret the faster diffusion constant to represent the mobility of cytoplasmic MinD. It is of the same order as the diffusion constant of EGFP, see Table 1. The smaller diffusion constant is interpreted as resulting from the mobility of membrane-bound MinD. This is supported by the estimated value of the fraction of the fast component. In agreement with the measurements of the cross-sections, figure 2d, e, the fraction of fast moving proteins is larger in the low-intensity regions than in the high-intensity regions, see figure 3c. The difference is 10 to 15%, less than one might have expected from an investigation of the cross-sectional profiles in figure 2d and e. As mentioned in the previous paragraph, FCS possibly overestimates the fraction of cytoplasmic proteins because some fraction of membrane-bound MinD might be immobile as it forms helices. Note, that the standard deviation of the mean diffusion constant is smaller than the estimated error of a single measurement, showing that the quality of our results is not limited by variations within a cell.
Histograms of fast and slow diffusion constants summarizing series of measurements on different cells are shown in figure 3d, e. Both histograms are well described by a log-normal distribution. The geometric mean value for the fast diffusion constant is . For the slow diffusion constant we find . This value is one order of magnitude higher than the diffusion constant for the transmembrane histidine kinase PleC measured by single protein tracking in C. crescentus [21]. Since PleC is a transmembrane protein, while MinD binds to the polar heads of the lipids forming the membrane, the values seem to be compatible. No correlation could be detected between the values of the fast and slow diffusion constants (data not shown). Separating the curves into those with low and high average intensity does not reveal significant differences between the respective fast and slow diffusion constants, see Table 1. In the low-intensity regions, however, the fraction of the fast-diffusing component is larger than in the high-intensity regions, where . The difference in the fractions is more pronounced when averaging over several measurements on a single cell than when averaging over measurements on different cells, figure 3c. This presumably reflects different protein concentrations in different cells.
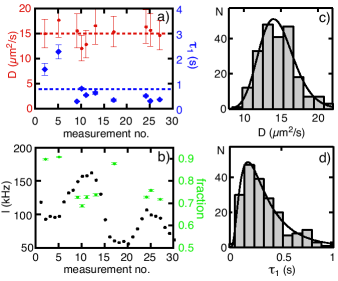
We analyzed the same data based on the exchange of MinD between a mobile (cytoplasmic) state and an immobile (membrane-bound) state, disregarding diffusion of membrane-bound proteins. As suggested by the cross-section profiles, figure 2d, e, we assume the average fraction of mobile molecules to be constant during one measurement. In that case, the residence times and of MinD in the mobile and immobile states, respectively, are related to the fraction of mobile molecules by . The results obtained from analyzing the same curves as in figure 3b, c are displayed in figure 4a, b. The diffusion constants are in the same range as the values of the fast diffusion constant obtained above. The same holds for the value of the mobile fraction . Histograms of the diffusion constant and the residence time in the mobile state are presented in figure 4c, d. Differences in the values for low- and high-intensity regions are not significant, although the residence times are on average larger in the low-intensity regions, see Table 1. We repeated the measurement using a different strain (WM1255). The average cytoplasmic diffusion constants are smaller in this strain, while the average residence time is a little larger, see Table 1. In view of the broadness of the distributions, however, the differences are not significant.
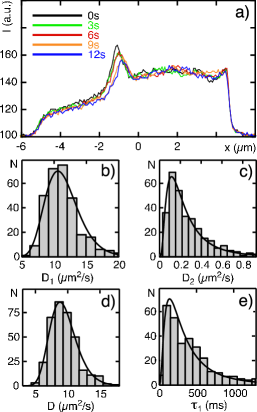
3.4 MinE-GFP
For measuring the mobility of MinE we employed the same strategy as for MinD. An example of a quasi-steady state of the MinE distribution is shown in figure 5a. As for MinD, two distinct relaxation times can be detected in the correlation curves. We analyzed these curves using the same models as for MinD. Histograms of the two different diffusion constants and of the diffusion constant together with the residence time in the mobile state, respectively, are presented in figure 5b-e. As before, the histograms are well described by log-normal distributions. Assuming two independent populations with different mobilities, we find and . The fraction of the faster diffusion population is . While cytoplasmic diffusion of MinE is thus smaller than of MinD, the diffusion constants for membrane-bound MinD and MinE are the same. This is compatible with MinE being bound to MinD on the membrane. Assuming the other model, we obtain for MinE and ms. The mobile fraction is in this case . Separating the curves into those from a low-intensity and those of a high-intensity phase, no significant differences between neither the values of the diffusion constants nor the residence times in the different phases can be detected, see Table 1.
4 Conclusion and outlook
In the present work we have used FCS to determine Min-protein mobility in living E. coli. The possibility to apply FCS relies on the existence of quasi-stationary steady states in some regions of the bacterium for time intervals of at least 10s, see figure 2c-e and 5a. Our correlation data clearly show the existence of more than one relaxation time, which can satisfactorily be explained by assuming for both MinD and MinE two states of different mobility. We interpret the faster component as resulting from diffusion of cytoplasmic proteins. The second time-scale could result from the mobility of proteins in the membrane-bound state or from transitions between the cytoplasm and the membrane. We find that all in all both models fit equally well to the data, even though for individual curves there can be significant differences in the fit quality. Using either of the corresponding correlation curves, or , for analyzing the experimental data, we find values around 16m and 10m for the respective cytoplasmic diffusion constants of GFP-MinD and MinE-GFP. Therefore, a cytoplasmic MinD molecule explores the volume of a 4m long cell within roughly a second. cytoplasmic MinE, which readily forms dimers, needs about 1.5s, i.e., only slightly longer.
The diffusion constants we measured for membrane-bound proteins are about two orders of magnitude smaller than the cytoplasmic diffusion constants. For membrane-bound MinD, it is of the same order as the value assumed in the AC model studied in [17]. This shows that the mobility of membrane-bound MinD is sufficiently large to allow for an AC mechanism causing the oscillations. In CA models it is usually assumed that membrane-bound proteins are immobile. However, it was found in [36] that oscillations can still be generated in a CA model if diffusion of MinD on the membrane is two orders of magnitude smaller than in the cytoplasm.
For the average residence time of MinD in the cytoplasm we find a value of about 300ms. In order to generate “striped” patterns in long bacteria, the CA model introduced in [13] requires the exchange of ATP for ADP on cytoplasmic MinD to be not too fast. For the parameters used there, the authors find an upper critical rate of 1/s. Since the measured residence time provides a lower bound on the exchange rate of about 3/s (only after rebinding of ATP can MinD attach again to the membrane), a re-investigation of the model is in order. The residence time of MinE in the cytoplasm is somewhat larger than for MinD which is compatible with the fact that MinE requires MinD as a substrate in order to bind to the membrane. From the residence time in the cytoplasm and the cytoplasmic diffusion constants, we can determine the diffusion length . This is the average distance travelled by a cytoscolic molecule. For MinD and MinE we find m. This value indicates that in small bacteria of about 2m in length, the distribution of cytoplasmic MinD and MinE should be homogenous. As AC models, but not CA models produce oscillations under these conditions, a detailed investigation of short cells might be helpful. Particular attention should be paid to the MinE-ring in these cells. The reason is that the investigation of the CA model by Huang et al. [13] suggests disappearance of the MinE-ring if is increased in comparison to the cell length. The presence or absence of the MinE-ring in short cells might therefore provide interesting information on the mechanism of its formation.
Comparing the different values measured in high- and low-intensity phases, respectively, we find that the fraction of cytoplasmic proteins is always larger in the low-intensity phases. This is not only an effect due to averaging but is also present in individual cells, see Figs. 3c and 4b. Based on the CA models, a shorter cytoplasmic residence time of MinD in the high-intensity phase than in the low-intensity phase is expected. Indeed, on average, our measurements confirm this expectation, see Table 1. Caution should be taken, though, because the error bars are quite large. The average residence time of MinE in the cytoplasm, too, depends on being in a high- or low-intensity phase. This is expected since a higher number of membrane-bound MinD should lead to a higher rate of MinE binding to the membrane.
The results presented here are compatible with the mechanism of forming MinD aggregates on the membrane suggested in [37]: cytoplasmic MinD dimerizes. As a consequence the membrane targeting sequence which is associated with the MinD’s C-teminal helix is exposed and the dimer binds to the membrane. Subsequently, MinD-aggregates are formed through attractive interactions between the membrane-bound dimers. In order to test this hypothesis further, mobility measurements on mutant proteins might be helpful. Furthermore, the consequences of this mechanism for the Min-oscillations have to be explored by theoretical analysis.
Glossary
- Cytoplasm.
-
The internal content of a cell (in eukaryotes: except the nucleus). It is surrounded by the cytoplasmic membrane, a lipid bilayer.
- Fluorescence Corrleation Spectroscopy (FCS).
-
A spectroscopy method that exploits fluorescence fluctuations around an average value. Fluorescence fluctuations can be due to mobility of the fluorophore or due to chemical reactions.
- Green Fluorescent Protein (GFP).
-
A protein from the jellyfish Aequorea aequorea that fluoresces green with an emission maximum at 509nm when exposed to blue light. EGFP is a bright mutant of GFP with an emission maximum at 511nm. The molecular weight is about 27kD.
- Min system.
-
A set of proteins involved in the determination of the division site in bacteria. Mutations in these proteins lead to the formation of not viable small cells (mini-cells).
- MinD.
-
Protein of the Min system with a molecular weight of about 30kD. It is able to hydrolyse ATP. MinD-ATP has a high affinity for the cytoplasmic membrane, while MinD-ADP is cytoplasmic.
- MinE.
-
Protein of the Min system in E. coli with a molecular weight of about 10kD. When bound to MinD, it is able to speed up ATP-hydrolysis by MinD.
References
References
- [1] Lutkenhaus J 2002 Dynamic proteins in bacteria Curr. Opin. Microbiol. 5, 548–552.
- [2] Yu X C and Margolin W 1999 FtsZ ring clusters in min and partition mutants: role of both the Min system and the nucleoid in regulating FtsZ ring localization Mol. Microbiol. 32, 315–326.
- [3] Bernhardt T G and de Boer P A 2005 SimA, a nucleoid-associated, FtsZ binding protein required for blocking septal ring assembly over chromosomes in E coli Mol. Cell 18, 555–564.
- [4] de Boer P A, Crossley R E and Rothfield L I 1989 A division inhibitor and a topological specificity factor coded for by the minicell locus determine proper placement of the division septum in Escherichia coli Cell 56, 641–649.
- [5] Bi E and Lutkenhaus J 1993 Cell-division inhbitors SulA and MinCD prevent formation of the FtsZ ring J. Bacteriol. 175, 1118–1125.
- [6] Raskin D M and de Boer P A 1999 MinDE-dependent pole-to-pole oscillation of division inhibitor MinC in Escherichia coli Proc. Natl. Acad. Sci. USA 96, 4971–4976.
- [7] Hu Z and Lutkenhaus J 1999 Topological regulation of cell division in Escherichia coli involves rapid pole to pole oscillation of the division inhibitor MinC under the control of MinD and MinE Mol. Microbiol. 34, 82–90.
- [8] Howard M and Kruse K 2005 Cellular organization by self-organization: mechanisms and models for Min protein dynamics J. Cell. Biol. 168, 533–536.
- [9] Hu Z L, Gogol E P and Lutkenhaus J 2002 Dynamic assembly of MinD on phospholipid vesicles regulated by ATP and MinE Proc. Natl. Acad. Sci. USA 99, 6761–6766.
- [10] Shih Y L, Le T and Rothfield L 2003 Division site selection in Escherichia coli involves dynamic redistribution of Min proteins within coiled structures that extend between the two cell poles Proc. Natl. Acad. Sci. USA 100, 7865–7870.
- [11] Meinhardt H and de Boer P A 2001 Pattern formation in Escherichia coli: A model for the pole-to-pole oscillations of Min proteins and the localization of the division site Proc. Natl. Acad. Sci. USA 98,14202–14207.
- [12] Howard M, Rutenberg A D and de Vet S 2001 Dynamic compartmentalization of bacteria: accurate division in E. coli Phys. Rev. Lett. 87, 278102.
- [13] Huang K C, Meir Y and Wingreen N S 2003 Dynamic structures in Escherichia coli: spontaneous formation of MinE rings and MinD polar zones Proc. Natl. Acad. Sci. USA 100, 12724–12728.
- [14] Drew D, Osborn M and Rothfield L 2005 A polymerization-depolymerization model that accurately generates the self-sustained oscillatory system involved in bacterial division site placement Proc. Natl. Acad. Sci. USA 102, 6114–6118.
- [15] Pavin N, Paljetak H and Krstic V 2006 Min-protein oscillations in Escherichia coli with spontaneous formation of two-stranded filaments in a three-dimensional stochastic reaction-diffusion model Phys. Rev. E 73, 021904.
- [16] Kruse K 2002 A dynamic model for determining the middle of Escherichia coli Biophys. J. 82, 618–627.
- [17] Meacci G and Kruse K 2005 Min-oscillations in Escherichia coli induced by interactions of membrane-bound proteins Phys. Biol. 2, 89–97.
- [18] Taghbalout A, Ma L and Rothfield L 2006 Role of MinD-membrane association in Min protein interactions J. Bacteriol. 188, 2993–3001.
- [19] Lackner L L, Raskin D M and de Boer P A 2003 ATP-dependent interactions between Escherichia coli Min proteins and the phospholipid membrane in vitro J. Bacteriol. 185, 735–749.
- [20] Mileykovskaya E, Fishov I, Fu X, Corbin B D, Margolin W and Dowhan W 2003 Effects of phospholipid composition on MinD-membrane interactions in vitro and in vivo J. Biol. Chem. 278, 22193–22198.
- [21] Deich J, Judd E M, McAdams H H and Moerner W E 2004 Visualization of the movement of single histidine kinase molecules in live Caulobacter cells Proc. Natl. Acad. Sci. USA 101, 15921–15926.
- [22] Elowitz M B, Surette M G, Wolf P-E, Stock J R and Leibler S 1999 Protein mobility in the cytoplasm of Escherichia coli J. Bacteriol. 181, 197–203.
- [23] Krichevsky O and Bonnet G 2002 Fluorescence correlation spectroscopy: the technique and its applications Rep. Prog. Phys. 65, 251–297.
- [24] Cluzel P, Surette M and Leibler S 2000 An ultrasensitive bacterial motor revealed by monitoring signaling proteins in single cells Science 287, 1652–1655.
- [25] Le T T, Harlepp S, Guet C C, Dittmar K, Emonet T, Pan T and Cluzel P 2005 Real-time RNA profiling within a single bacterium Proc. Natl. Acad. Sci. USA 102, 9160–9164.
- [26] Le T T, Emonet T, Harlepp S, Guet C C and Cluzel P 2006 Dynamical determinants of drug-inducible gene expression in a single bacterium Biophys. J. 90, 3315–3321.
- [27] Hu Z and Lutkenhaus J 2003 A conserved sequence at the C-terminus of MinD is required for binding to the membrane and targeting MinC to the septum Mol. Microbiol. 47, 345–355.
- [28] Corbin B D, Yu X-C and Margolin W 2002 Exploring intracellular space: function of the Min system in round-shaped Escherichia coli EMBO J. 21, 1998–2008.
- [29] Chiantia S, Kahya N, Ries J and Schwille P 2006 Effects of ceramide on liquid-ordered domains investigated by simultaneous AFM and FCS Biophys. J. 90, 4500–4508.
- [30] Gennerich A and Schild D 2000 Fluorescence correlation spectroscopy in small cytosolic compartments depends critically on the diffusion model used Biophys. J. 79, 3294–3306.
- [31] Elson E and Magde D 1974 Fluorescence correlation spectroscopy 1. Conceptual basis and theory Biopolymers 13, 1–27.
- [32] Schwille P, Korlach J and Webb W W 1999 Fluorescence correlation spectroscopy with single-molecule sensitivity on cell and model membranes Cytometry 36, 176–182.
- [33] Padan E, Zilberstein D and Rottenberg H 1976 Proton electrochemical gradient in Escherichia coli cells Eur. J. Biochem. 63, 533–541.
- [34] Haupts U, Maiti S, Schwille P and Webb W W 1998 Dynamics of fluorescence fluctuations in green fluorescent protein observed by fluorescence correlation spectroscopy Proc. Natl. Acad. Sci. USA 95, 13573–13578.
- [35] Weiss M, Elsner M, Kartberg F and Nilsson T 2004 Anomalous subdiffusion is a measure for cytoplasmic crowding in living cells Biophys. J. 87, 3518–3524.
- [36] Fange D and Elf J 2006 Noise-induced Min phenotypes in E-coli PLoS Comp. Biol. 2, 637–648.
- [37] Zhou H J, Schulze R, Cox S, Saez C, Hu Z and Lutkenhaus J 2005 Analysis of MinD mutations reveals residues required for MinE stimulation of the MinD ATPase and residues required for MinC interaction J. Bacteriol. 187, 629–638.
| two species | binding | |||||||||
| () | () | () | (ms) | |||||||
| EGFPa | 1021 | 652 | 690 | |||||||
| His6-EGFPa | 555 | 214 | 220 | |||||||
| GFP-MinDb | 2017 | 438 | 181 | 217 | ||||||
| GFP-MinDb l.i. | 191 | 105 | 104 | |||||||
| GFP-MinDb h.i. | 247 | 76 | 113 | |||||||
| GFP-MinDc | 738 | 102 | 50 | 43 | ||||||
| MinE-GFPd | 1807 | 528 | 307 | 350 | ||||||
| MinE-GFPd l.i. | 310 | 198 | 223 | |||||||
| MinE-GFPd h.i. | 218 | 109 | 127 | |||||||