Motif Discovery through Predictive Modeling of Gene Regulation
Abstract
We present MEDUSA, an integrative method for learning motif models of transcription factor binding sites by incorporating promoter sequence and gene expression data. We use a modern large-margin machine learning approach, based on boosting, to enable feature selection from the high-dimensional search space of candidate binding sequences while avoiding overfitting. At each iteration of the algorithm, MEDUSA builds a motif model whose presence in the promoter region of a gene, coupled with activity of a regulator in an experiment, is predictive of differential expression. In this way, we learn motifs that are functional and predictive of regulatory response rather than motifs that are simply overrepresented in promoter sequences. Moreover, MEDUSA produces a model of the transcriptional control logic that can predict the expression of any gene in the organism, given the sequence of the promoter region of the target gene and the expression state of a set of known or putative transcription factors and signaling molecules. Each motif model is either a -length sequence, a dimer, or a PSSM that is built by agglomerative probabilistic clustering of sequences with similar boosting loss. By applying MEDUSA to a set of environmental stress response expression data in yeast, we learn motifs whose ability to predict differential expression of target genes outperforms motifs from the TRANSFAC dataset and from a previously published candidate set of PSSMs. We also show that MEDUSA retrieves many experimentally confirmed binding sites associated with environmental stress response from the literature.
1 Introduction
One of the central challenges in computational biology is the elucidation of mechanisms for gene transcriptional regulation using functional genomic data. The problem of identifying binding sites for transcription factors in the regulatory sequences of genes is a key component in these computational efforts. While there is a vast literature on this subject, only a few different conceptual approaches have been tried, and each of these standard approaches has its limitations.
The most widely-used methodology for computational discovery of putative binding sites is based on clustering genes—usually by similarity of gene expression profiles, sometimes combined with annotation data—and searching for motif patterns that are overrepresented in the promoter sequences of these genes in the belief that they may be coregulated. Popular motif discovery programs in this paradigm include MEME [1], Consensus [2], Gibbs Sampler [3], AlignACE [4] and many others. The cluster-first methodology has several drawbacks. First, it is not always true that genes with correlated gene expression profiles are in fact coregulated genes whose regulatory regions contain common binding sites. Moreover, by focusing on coregulated genes, one fails to consider more complicated combinatorial regulatory programs and the overlapping regulatory pathways that can affect different sets of genes under different conditions. Recently, more sophisticated graphical models for gene expression data have been introduced to try to partition genes into “transcriptional modules” [5]—clusters of genes that obey a common transcriptional program depending on a small number of regulators—or to learn overlapping clusters of this kind [6]. These graphical model approaches use the abstraction of modules to give an interpretable representation of putative relationships between genes and to suggest biological hypotheses. One expects that using these more complex clustering algorithms as a preprocessing step for motif discovery would lead to improved identification of true binding sites; however, it is difficult to assess how much of an advantage one might obtain.
Another well-established motif discovery approach is the innovative REDUCE method [7] and related algorithms [8, 9]. REDUCE avoids the cluster-first methodology by considering the genome-wide expression levels given by a single microarray experiment, and it discovers sequences whose presence in promoter sequences correlates with differential expression. Since REDUCE uses linear regression to iteratively identify putative binding sites, it must enforce strict tests of statistical significance to avoid overfitting in a large parameter space corresponding to the set of all possible sequence candidates. Therefore, REDUCE can find the strongest signals in a dataset but will not attempt to find more subtle sites that affect fewer genes. Since the algorithm fits parameters independently for each microarray experiment, the issue of condition-specific regulation enters the analysis only as post-processing step rather than through simultaneous training from multiple conditions.
In this paper, we introduce a new motif discovery algorithm called MEDUSA (Motif Element Discrimination Using Sequence Agglomeration) that learns putative binding sites associated with condition-specific regulation in a large gene expression dataset. MEDUSA works by extracting binding site motifs that contribute to a predictive model of gene regulation. More specifically, MEDUSA builds motif models whose presence in the promoter region of a gene, together with the activity of regulators in an experiment, is predictive of differential expression. Like REDUCE, MEDUSA avoids the cluster-first methodology and builds a single regulatory model to explain the response of all target genes. However, unlike REDUCE, MEDUSA learns from multiple and diverse gene expression experiments, using the expression states of a set of known regulatory to represent condition-specific regulatory conditions. Moreover, MEDUSA is based on a classification approach (using large-margin machine learning) rather than linear regression, to avoid overfitting in the high-dimensional search space of candidate binding sequences. In addition to discovering binding site motifs, MEDUSA produces a model of the condition-specific transcriptional control logic that can predict the expression of any gene, given the gene’s promoter sequence and the expression state of a set of known transcription factors and signaling molecules.
The core of MEDUSA is a boosting algorithm that adds a binding site motif (coupled with a regulator whose activity helps predict up/down regulation of genes whose promoters contain the motif) to an overall gene regulation model at each boosting iteration. Each motif model is either a -length sequence (or “-mer”), a dimer, or a PSSM. The PSSMs are generated by considering the most predictive -mer features (Fig. 2) selected at a given round of boosting that are associated with a common regulator; we then perform agglomerative probabilistic clustering of these -mers into PSSMs, and we select from all the candidate PSSMs seen during clustering the one that minimizes boosting loss (Fig. 2). In experiments on a set of environmental stress response expression data in yeast, we learn motifs together with regulation models that achieve accurate prediction of up/down regulation of target genes in held-out experiments. In fact, we show that the performance of the learned motifs for prediction of differential expression in test data is stronger than the performance of motifs from the TRANSFAC dataset or from a previously published candidate set of PSSMs. For these environmental stress response experiments, we also show that MEDUSA retrieves many experimentally confirmed binding sites from the literature.
We first introduced the idea of predictive modeling of gene regulation with the GeneClass algorithm [10]. However, GeneClass uses a fixed set of candidate motifs as an input to the algorithm and cannot perform motif discovery. We note also that there have been previous efforts to incorporate motif discovery in an integrative model for sequence and expression data using the probabilistic graphical model framework [11]. This graphical model approach again uses the abstraction of “modules” to learn sets of motifs associated with clusters of genes, giving a high-level modular representation of gene regulation. As explained above, MEDUSA does not produce an abstract module representation. However, it has two advantages over graphical model methods. First, MEDUSA uses a large-margin learning approach that helps to improve the generalization of the learned motifs and regulation model, and we can evaluate prediction accuracy on held-out experiments to assess our confidence in the model. Second, training graphical models requires special expertise to avoid poor local minima in a complex optimization problem, while MEDUSA can be run “out-of-the-box”. Code for MEDUSA is publicly available and can be downloaded from the supplementary website for the paper, http://www.cs.columbia.edu/compbio/medusa.
2 Methods
2.1 Learning Algorithm
MEDUSA learns binding site motifs together with a predictive gene regulation model using a specific implementation of Adaboost, a general discriminative learning algorithm proposed by Freund and Schapire [12]. Adaboost’s basic idea is to iteratively apply variants of a simple, weakly discriminative learning algorithm, called the weak learner, to different weightings of the same training set. The only requirement of the weak learner is that it predicts the class label of interest with greater than 50% accuracy. At each iteration, weights are recalculated so that examples which were misclassified at the previous iteration are more highly weighted. Finally, all of the weak prediction rules are combined into a single strong rule using a weighted majority vote. As discussed in [13], boosting is a large-margin classification algorithm, able to learn from a potentially large number of candidate features while maintaining good generalization error (that is, without over-fitting the training data).
The discretization of expression data (see Sect. 3.2) into up- and down-regulated expression levels allows us to formulate the problem of predicting regulatory response of target genes as the binary classification task of learning to predict up and down examples. Rather than viewing each microarray experiment as a training example, MEDUSA considers all genes and experiments simultaneously and treats every gene-experiment pair as a separate instance, dramatically increasing the number of training examples available. For every gene-experiment example, the gene’s expression state in the experiment (up- or down-regulation) gives the output label . As we explain below (see Sect. 3.2), positive and negative examples correspond to statistically significant up- and down-regulated expression levels; examples with baseline expression levels are omitted from training.
The inputs to the learner are (i) the promoter sequences of the target genes and (ii) the discretized expression levels of a set of putative regulator genes. The sequence data is represented only via occurrence or non-occurrence of a sequence element or motif. A full discussion of how MEDUSA determines a set of sequence and motif candidates to be considered at each round of boosting is given in Sect. 2.2. Let the binary matrix indicate the presence () or absence () of a motif in the promoter sequence of gene , and let the binary matrices indicate the up-regulation () or down-regulation () of a regulator in experiment (, if regulator is in state in experiment , and , otherwise). Our weak rules split the gene-experiment examples in the training data by asking questions of the form ‘ ?’; i.e., ‘Is motif present, and is regulator in state ?’. In this way, each rule introduced corresponds to a putative interaction between a regulator and some sequence element in the promoter of the target gene that it regulates.
The weak rules are combined by weighted majority vote using the structure of an alternating decision tree [14, 10]. An example is given in Fig. 1.
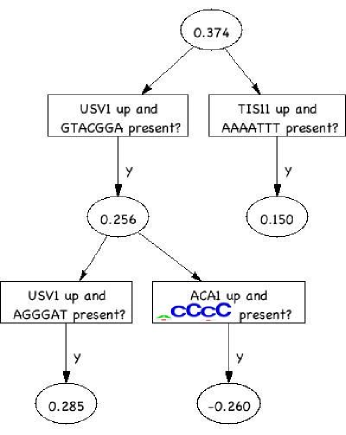
The weak rules are shown in rectangles. Their associated weights, indicating the strength of their contribution to the majority vote, are shown in ovals. If the {motif presence, regulator state} condition for a particular rule holds in the example considered, the weight of the rule is added to the final prediction score. The weight can be either positive or negative, contributing to up- or down-regulation respectively. Rules that appear lower in the tree are conditionally dependent on the rules in ancestor nodes. For example, in Fig. 1, only if USV1 is up-regulated and both motifs GTACGGA and AGGGAT are present is the score 0.285 added to the prediction score. The tree structure is thus able to reveal combinatorial interactions between regulators and/or motifs. The sign of the final prediction score gives the prediction, and the absolute value of the score indicates the level of confidence. In this work, we consider both sequences and position-specific scoring matrices (PSSM) (an example is shown in the lower right node of Fig. 1) as putative motifs (see Sect. 2.2).
Each iteration of the boosting algorithm results in the addition of a new node (corresponding to a new weak rule) to the tree. The weak rule and its position in the tree at which it is added are chosen by minimizing the boosting loss over all possible combinations of motifs, regulators, and regulator-states, and over all possible positions (“preconditions”) in the current tree. A pseudo-code description is given in Fig. 2.
The implementation uses efficient sparse matrix multiplication in MATLAB, exploiting the fact that our motif-regulator features are outer products of motif occurrence vectors and regulator expression vectors, and allows us to scale up to significantly larger datasets than in [10].
| Definitions: | |||||||||||||||||||||||||||||||||
|
|||||||||||||||||||||||||||||||||
| Initialization: | |||||||||||||||||||||||||||||||||
| , for all () | |||||||||||||||||||||||||||||||||
| Main loop: | |||||||||||||||||||||||||||||||||
| for | |||||||||||||||||||||||||||||||||
| call Hierarchical Motif Clustering (Sec. 2.2). | |||||||||||||||||||||||||||||||||
| get a set of proposed PSSMs. | |||||||||||||||||||||||||||||||||
| minimize boosting loss: | |||||||||||||||||||||||||||||||||
| calculate weight of the new weak rule : | |||||||||||||||||||||||||||||||||
| add new node with weight to the tree | |||||||||||||||||||||||||||||||||
| end for | |||||||||||||||||||||||||||||||||
| prediction for example | |||||||||||||||||||||||||||||||||
| prediction confidence for | |||||||||||||||||||||||||||||||||
2.2 Hierarchical Motif Clustering
At each boosting iteration, MEDUSA considers all occurrences of -mers () and dimers with a gap of up to 15 bp (see Sect. 3.4) in the promoter sequence of each gene as candidate motifs. Since slightly different sequences might in fact be instances of binding sites for the same regulator, MEDUSA performs a hierarchical motif clustering algorithm to generate more general candidate PSSMs as binding site models. The motif clustering uses -mers and dimers associated with low boosting loss as a starting point to build PSSMs: these sequences are viewed seed PSSMs, and then the algorithm proceeds by iteratively merging similar PSSMs, as described below. The generated PSSMs are then considered as additional putative motifs for the learning algorithm.
A position-specific scoring matrix (PSSM) is represented by a probability distribution over sequences , where . The emission probabilities are assumed to be independent at every position such that . For a given input sequence the PSSM returns a log-odds score with respect to background probabilities . A score threshold can then be chosen to define whether the input sequence is a hit or not.
When comparing two PSSMs, we allow possible offsets between the two starting positions. In order to give them the same lengths, we pad either the left or right ends with the background distribution. We then define a distance measure as the minimum over all possible position offsets of the JS entropy [15] between two PSSMs and .
where is the Kullback-Leibler divergence [15]. By using and (and the analogous equations for ) one can easily show that . The relative weights of the two PSSMs, and , are here defined as , where , are the numbers of target genes for the given PSSM. Note that this distortion measure is not affected by adding more “padded” background elements either before or after the PSSM. Our merge criterion is similar to the one used in the agglomerative information bottleneck algorithm [16], though we also consider offsets in our merges.
At every boosting iteration, we first find the weak rule among all possible combinations of regulators, regulator-states and sequence motifs (-mers and dimers), that minimizes boosting loss. The 100 motifs with lowest loss appearing with the same regulator, regulator-state, and precondition as in are then input to the hierarchical clustering algorithm. Sequence motifs can be regarded as PSSMs with 0/1 emission probabilities, smoothed by background probabilities. By iteratively joining the PSSMs with smallest , the clustering proposes a set of 99 PSSMs from various stages of the hierarchy. At every merge of two PSSMs, the score threshold associated with the new PSSM is found by optimizing the boosting loss. Note also that the new PSSM can be longer than either of the two PSSMs used in the merge, due to the procedure of merging with offsets; in this way, we can obtain candidate PSSMs longer the maximum seed -mer length of . The number of target genes, which determines the weight of the PSSM for further clustering, is calculated by counting the number of promoter sequences which score above the threshold. The new node that is then added to the alternating decision tree is the weak rule that minimizes boosting loss considering all sequence motifs and PSSMs.
3 Statistical Validation
3.1 Dataset
We use the environmental stress response (ESR) dataset of Gasch et al. [17], which consists of 173 cDNA microarray experiments measuring the expression of 6152 S. cerevisiae genes in response to diverse environmental perturbations. All measurements are given as expression values (fold-change with respect to an unstimulated reference condition). Note that our analysis does not require a normalization to a zero-mean, unit-variance distribution, as is often employed; instead we wish to retain the meaning of the true zero (that is, the reference state).
3.2 Discretization
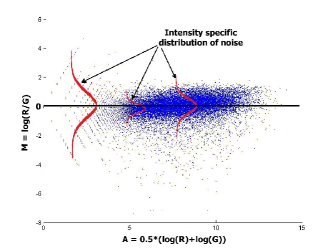
We discretize expression data by using a noise model that accounts for intensity specific effects in the raw data from both the Cy3 (R) and Cy5 (G) channels. In order to estimate the null model, we use the three replicate unstimulated experiments published with the same dataset [17]. Plots of versus (Fig. 3) show the intensity specific distribution of the noise in the expression values. We compute the cumulative empirical null distribution of conditioned on by binning the variable into small bin sizes, maintaining a good resolution while having sufficient data points per bin. For any expression value of a gene in an experiment, we estimate a -value based on the null distribution conditioned on , and we use a -value cutoff of 0.05 to discretize the expression values into +1, -1 or 0 (up-regulation, down-regulation, or baseline). The discretization allows us to formulate the prediction problem as a classification task.
3.3 Candidate Regulators
3.4 Motif Set
We scan the 500 bp 5’-UTR promoter sequences of all S. cerevisiae genes from the Saccharomyces genome Database (SGD) for all occurring -mer motifs (). We also include 3-3 and 4-4 dimer motifs allowing a middle gap of up to 15 bp. We restrict the set of all dimers to those whose two components have specific relationships, consistent with most known dimer motifs: equal, reversed, complements, or reverse-complements. As described in Sect. 2.2, we use an information-theoretic, hierarchical clustering scheme to infer a set of PSSMs at each boosting iteration. The complete candidate motif set is then the union of all -mers, dimers, and PSSMs, with a cardinality of .
3.5 Cross-validation
We divide the 173 microarray experiments into five folds, keeping replicate experiments in the same fold. We then perform five-fold cross-validation, training the classifier on four folds and testing it on the held-out fold. The learning algorithm is run for 700 boosting iterations. The average test-loss for prediction on all genes in held-out experiments is .
For comparison, we run the same learning algorithm with experimentally-confirmed or computationally-predicted motifs in the literature. In these runs, the hierarchical motif clustering is left out, and the set of putative motifs contains only those that were proposed in the literature.
The TRANSFAC database [19] contains a library of known and putative binding sites which can be used to scan the promoter sequence of every gene. After removing redundant sites, we compile a list of 354 motifs. The boosting algorithm with the same number of iterations and the same folds for cross-validation gives a higher test-loss of The compiled TRANSFAC motifs thus have a much weaker strength in predicting gene expression than the motifs found by MEDUSA.
The same comparison was performed with a list of 356 motifs found in [20] by using a state-of-the-art Gibbs sampling algorithm on groups of genes clustered by expression data and annotation information. These motifs also gave weaker predictive strength than those discovered by MEDUSA with an average test-loss of .
We are thus able to identify motifs which have a significantly stronger prediction accuracy (on independent held-out experiments) than motifs previously identified in the literature.
4 Biological Validation
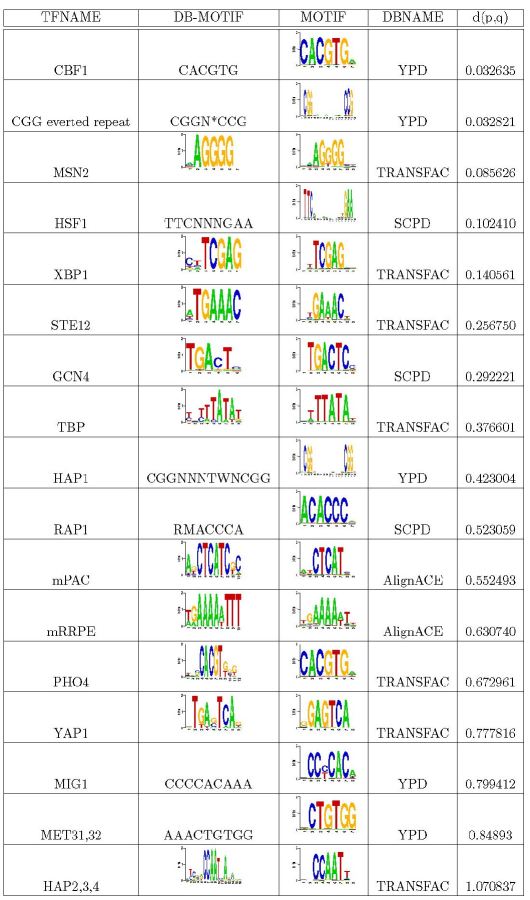
To confirm that MEDUSA can retrieve biologically meaningful motifs, we run additional experiments, randomly holding out of the (gene,experiment) examples and training MEDUSA on the remaining examples. We learn ungapped -mers and dimers simultaneously. After 1000 iterations, we obtain a test loss of and a set of 1000 PSSMs. We then compare to several known and putative binding sites, consensus sequences and PSSMs from five databases: TRANSFAC [19], TFD, SCPD, YPD and a set of PSSMs found by AlignACE [20]. After converting the sequences and consensus patterns to PSSMs, smoothed by background probabilities, we compare all PSSMs with the ones found by MEDUSA using (see Sect. 2.2) as a distance measure. We define the best match for each of MEDUSA’s PSSMs as the PSSM that is closest to it in terms of .
Each node in the alternating decision tree defines a particular subset of genes, namely those having at least one example that passes through the particular node. In this way, we can associate motifs with Gene Ontology (GO) annotations by looking for enriched GO annotations in the gene subsets, and we can estimate the putative functions of the targets of a transcription factor that might bind to the PSSM in each node. We see matches to variants of the STRE element, the binding site for the MSN2 and MSN4 general stress response transcription factors. The genes passing through nodes containing these PSSMs are significantly enriched for the GO terms carbohydrate metabolism, response to stress and energy pathways, consistent with the known functions of MSN2/4. GCR1 and RAP1 are known to transcriptionally regulate ribosomal genes, consistent with enriched GO annotations associated with the nodes of the specific PSSMs. The heat shock factor HSF1—which binds to the heat shock element (HSE)—plays a primary role in stress response to heat as well as several other stresses. The heat shock element exists as a palindromic sequence of the form NGAANNTTCN. We find almost an exact HSE in the tree. In S. cerevisiae, several important responses to oxidative and redox stresses are regulated by Yap1p, which binds to the YRE element. We find several strongly matching variants of the YRE. It is interesting to note that comparison of PSSMs from AlignACE with our PSSMs revealed the PAC and RRPE motifs to be among the top three matches. These PSSMs also appear in the top 10 iterations in the tree, indicating they are also strongly predictive of the target gene expression. Both these putative regulatory motifs have been studied in great depth with respect to their roles in rRNA processing and transcription as well their combinatorial interactions. The enriched GO annotations of these nodes are the same as their putative functions. The tree contains 122 dimer motifs with variable gaps. These include the HSE motif (GAANNNTTC), HAP1 motif (CCGN*CCG), GIS1 motif (AGGGGCCCCT) as well as variants of the CCG everted repeat. Several important biologically verified PSSMs learned by MEDUSA are given in Fig. 4. A complete comparison study of MEDUSA’s PSSMs with each of the above mentioned databases as well as Gene Ontology analysis is available on the online supplementary website.
An added advantage of MEDUSA is that we can study the regulators whose mRNA expression is predictive of the expression of targets. These regulators are paired with the learned PSSMs. Of the 475 regulators (transcription factors, kinases, phosphatases and signaling molecules) used in the study, 234 are present in the tree. We can rank these regulators by abundance score (AS), namely the number of times a regulator appears in the tree in different nodes. If a regulator has a large AS, then it affects the prediction of several target genes through several nodes. The top 10 regulators include TPK1, USV1, AFR1, XBP1, ATG1, ETR1, SDS22, YAP4, PDR3. TPK1 is the kinase that affects the cellular localization of the general stress response factors MSN2/4. XBP1 is an important stress related repressor. USV1 was also identified by Segal et al. [5] to be a very important stress response regulator. A complete analysis of the regulators as well their association with specific motifs is available on the supplementary website.
5 Discussion
We have proposed a new algorithm called MEDUSA for learning binding site motifs together with a predictive model for gene regulation. MEDUSA jointly learns from promoter sequence data and multiple gene expression experiments, together with a candidate list of putative regulators (transcription factors and signaling molecules), and builds motif models whose presence in the promoter region of a target gene, together with the activity of regulators in an experiment, is predictive of up/down regulation of the gene. We can readily evaluate the predictive accuracy of the learned motifs and regulation model on test data, and we present results for a yeast environmental stress response dataset that demonstrate that MEDUSA’s binding site motifs are better able to predict regulatory response on held-out experiments than binding site sequences taken from TRANSFAC or previously published computationally-derived PSSMs.
Popular cluster-first motif discovery strategies often require complex or even manual preprocessing to determine suitable putative clusters of coregulated genes. In practice, in addition to using gene expression profiles in the clustering algorithm, one might need to incorporate annotation data or even use hand curation to properly refine the putative clusters [4]. One must then carefully apply a standard motif discovery algorithm to find overrepresented motifs in the promoter sequences of genes in each cluster, which may involve optimizing parameters in the algorithm and thresholds for each of the extracted motif models. By contrast, MEDUSA avoids clustering and manual preprocessing altogether, and automatically determines PSSMs together with thresholds used for determining PSSM hits by optimizing boosting loss. In our experiments, MEDUSA learned many of the binding site motifs associated with various environmental stress responses in the literature.
Recent work using the framework of probabilistic graphical models has also presented an algorithm for learning putative binding site motifs in the context of building an integrated regulation model [11]. The graphical modeling approach is appealing due to its descriptive nature: since the graph structure encodes how different variables are meant to be related, it is clear how to try to interpret the results. The MEDUSA algorithm builds binding site motifs while producing a single regulation model for all target genes without introducing conceptual subunits like “clusters” or “transcriptional modules”. This single regulation model is arguably more biologically realistic and can capture combinatorial regulatory effects on overlapping sets of targets. The regulation model can also be interpreted as a gene regulatory network, since the activity of regulators predicts differential expression of targets via binding sites, although necessarily this network is large and contains many nodes. Nonetheless, we can use this model to address specific biological questions, for example by restricting attention to particular target genes or experiments [21], allowing meaningful interpretation.
One difficulty of using complex graphical models is that they require careful training methodologies to avoid poor local optima and severe overfitting. MEDUSA can be run “out-of-the-box”, making it easy to reproduce results and allowing non-specialists to apply the algorithm to new datasets. Moreover, it is difficult to statistically validate the full structure or the components of complex graphical models; in the literature, most work using these models for gene regulation has focused on biological validation of particular features in the graph rather than generalization measures like test loss. MEDUSA’s predictive methodology—using large-margin learning strategies to focus on improving generalization—produces binding site motifs that achieve good accuracy for prediction of regulatory response on held-out experiments. The fact that we can easily evaluate the predictive performance of our learned motifs and regulation model gives us a simple statistical test of confidence in our results. The superior performance of MEDUSA in discovering predictive motifs is very encouraging for applying such large-margin techniques to analysis of expression data for as-yet unannotated genomes and for elucidating the transcriptional regulatory mechanisms of more complex organisms.
Acknowledgments
AK is supported by NSF EEC-00-88001. CW and MM are partially supported by NSF ECS-0332479, ECS-0425850 and NIH GM36277. CL and CW are supported by NIH grant LM07276-02, and CL is supported by an Award in Informatics from the PhRMA Foundation.
References
- [1] Bailey, T.L., Elkan, C.P.: Fitting a mixture model by expectation-maximization to discover motifs in biopolymers. In Altman, R., Brutlag, D., Karp, P., Lathrop, R., Searls, D., eds.: Proceedings of the Second International Conference on Intelligent Systems for Molecular Biology, AAAI Press (1994) 28–36
- [2] Hertz, G.Z., Stormo, G.D.: Identifying DNA and protein patterns with statistically significant alignments of multiple sequences. Bioinformatics 15 (1999) 563–577
- [3] Lawrence, C.E., Altschul, S.F., Boguski, M.S., Liu, J.S., Neuwald, A.F., Wootton, J.C.: Detecting subtle sequence signals: A Gibbs sampling strategy for multiple alignment. Science 262 (1993) 208–214
- [4] Hughes, J.D., Estep, P.W., Tavazoie, S., Church, G.M.: Computational identification of cis-regulatory elements associated with groups of functionally related genes in Saccharomyces cerevisiae. J. Mol. Biol. 296 (2000) 1205–14
- [5] Segal, E., Shapira, M., Regev, A., Pe’er, D., Botstein, D., Koller, D., Friedman, N.: Module networks: Identifying regulatory modules and their condition specific regulators from gene expression data. Nature Genetics 34 (2003) 166–176
- [6] Battle, A., Segal, E., Koller, D.: Probabilistic discovery of overlapping cellular processes and their regulation. In: Proceedings of the eighth annual international conference on Computational molecular biology, ACM Press (2004) 167–176
- [7] Bussemaker, H.J., Li, H., Siggia, E.D.: Regulatory element detection using correlation with expression. Nature Genetics 27 (2001) 167–171
- [8] Conlon, E.M., Liu, X.S., Lieb, J.D., Liu, J.S.: Integrating regulatory motif discovery and genome-wide expression analysis. Proceedings of the National Academy of Sciences USA 100 (2003) 3339–3344
- [9] Zilberstein, C.B.Z., Eskin, E., Yakhini, Z.: Sequence motifs in ranked expression data. In: Proceedings of the First RECOMB Satellite Workshop on Regulatory Genomics. (2004)
- [10] Middendorf, M., Kundaje, A., Wiggins, C., Freund, Y., Leslie, C.: Predicting genetic regulatory response using classification. Proceedings of the Twelfth International Conference on Intelligent Systems for Molecular Biology (ISMB 2004) (2004)
- [11] Segal, E., Yelensky, R., Koller, D.: Genome-wide discovery of transcriptional modules from DNA sequence and gene expression. Bioinformatics 19 (2003) 273–282
- [12] Schapire, R.E.: The boosting approach to machine learning: An overview. In: MSRI Workshop on Nonlinear Estimation and Classification. (2002)
- [13] Schapire, R.E., Freund, Y., Bartlett, P., Lee, W.S.: Boosting the margin: A new explanation for the effectiveness of voting methods. The Annals of Statistics 26 (1998) 1651–1686
- [14] Freund, Y., Mason, L.: The alternating decision tree learning algorithm. Proceedings of the Sixteenth International Conference on Machine Learning (1999) 124–133
- [15] Cover, T., Thomas, J.: Elements of Information Theory. John Wiley, New York (1990)
- [16] Slonim, N., Friedman, N., Tishby, N.: Unsupervised document classification using sequential information maximization. In: Proceedings of the 25th annual international ACM SIGIR conference on Research and development in information retrieval, ACM Press (2002) 129–136
- [17] Gasch, A.P., Spellman, P.T., Kao, C.M., Carmel-Harel, O., Eisen, M.B., Storz, G., Botstein, D., Brown, P.O.: Genomic expression programs in the response of yeast cells to environmental changes. Molecular Biology of the Cell 11 (2000) 4241–4257
- [18] Lee, T.I., Rinaldi, N.J., Robert, F., Odom, D.T., Bar-Joseph, Z., Gerber, G.K., Hannett, N.M., Harbison, C.R., Thompson, C.M., Simon, I., Zeitlinger, J., Jennings, E.G., Murray, H.L., Gordon, D.B., Ren, B., Wyrick, J.J., Tagne, J., Volkert, T.L., Fraenkel, E., Gifford, D.K., Young, R.A.: Transcriptional regulatory networks in Saccharomyces cerevisiae. Science 298 (2002) 799–804
- [19] Wingender, E., Chen, X., Hehl, R., Karas, H., Liebich, I., Matys, V., Meinhardt, T.., Prüss, M., Reuter, I., Schacherer, F.: TRANSFAC: an integrated system for gene expression regulation. Nucleic Acids Research 28 (2000) 316–319
- [20] Pilpel, Y., Sudarsanam, P., Church, G.M.: Identifying regulatory networks by combinatorial analysis of promoter elements. Nature Genetics 2 (2001) 153–159
- [21] Kundaje, A., Middendorf, M., Shah, M., Wiggins, C., Freund, Y., Leslie, C.: A classification-based framework for predicting and analyzing gene regulatory response. (Web supplement: http://www.cs.columbia.edu/compbio/robust-geneclass)