Refolding upon force quench and pathways of mechanical and thermal unfolding of ubiquitin
Mai Suan Li1, Maksim Kouza1,and Chin-Kun Hu2
1Institute of Physics, Polish Academy of Sciences, Al. Lotnikow 32/46, 02-668 Warszawa, Poland
2Institute of Physics, Academia Sinica, Nankang, Taipei 11529, Taiwan
ABSTRACT. The refolding from stretched initial conformations of ubiquitin (PDB ID: 1ubq) under the quenched force is studied using the Cα-Go model and the Langevin dynamics. It is shown that the refolding decouples the collapse and folding kinetics. The force quench refolding times scale as , where is the quench force and nm is the location of the average transition state along the reaction coordinate given by the end-to-end distance. This value is close to nm obtained from the force-clamp experiments [J. M. Fernandez and H. Li, Science 303, 1674-1678 (2004)]. The mechanical and thermal unfolding pathways are studied and compared with the experimental and all-atom simulation results in detail. The sequencing of thermal unfolding was found to be markedly different from the mechanical one. It is found that fixing the N-terminus of ubiquitin changes its mechanical unfolding pathways much more drastically compared to the case when the C-end is anchored. We obtained the distance between the native state and the transition state nm which is in reasonable agreement with the experimental data.
Address preprint requests to Prof. Mai Suan Li, E-mail: masli@ifpan.edu.pl; or Prof. Chin-Kun Hu, E-mail: huck@phys.sinica.edu.tw
Introduction
Deciphering the folding and unfolding pathways and free energy landscape of biomolecules remains a challenge in molecular biology. Traditionally, folding and unfolding are monitored by changing temperature or concentration of chemical denaturants. In these experiments, due to thermal fluctuations of initial unfolded conformations it is difficult to describe the folding mechanisms in an unambiguous way. With the help of the atomic force microscopy, mechanical force has been used to prepare well defined initial states of proteins Fisher_TBS99 ; Fernandez_Sci04 . Using the initial force, , which is higher than the equilibrium critical force, , to unfold the tandem of poly ubiquitin (Ub), Fernandez and Li Fernandez_Sci04 have shown that the refolding can be initiated starting from stretched conformations or force denaturated ensemble (FDE) and quenching the force to a low constant value, (). Monitoring folding events as a function of the end-to-end distance () they have made the following important observations. 1) Contrary to the standard folding from the thermal denaturated ensemble (TDE) the refolding under the quenched force is a multiple stepwise process and 2) The force-quench refolding time obeys the Bell formula Bell_Sci78 , , where is the folding time in the absence of the quench force and is the average location of the transition state (TS).
Motivated by the experiments of Ferandez and Li Fernandez_Sci04 , we have studied Li_PNAS06 the refolding of the domain I27 of the human muscle protein using the Cα-Go model Clementi_JMB00 and the four-strand -barrel model sequence S1 Klimov_PNAS00 (for this sequence the nonnative interactions are also taken into account). Basically, we have reproduced qualitatively the major experimental findings listed above. In addition we have shown that the refolding is two-state process in which the folding to the native basin attractor (NBA) follows the quick collapse from initial stretched conformations with low entropy. The corresponding kinetics can be described by the bi-exponential time dependence, contrary to the single exponential behavior of the folding from the TDE with high entropy.
In order to make the direct comparison with the experiments of Fernandez and Li Fernandez_Sci04 , in this paper we performed simulations for a single domain Ub using the Cα-Go model (see Material and Method for more details). Because the study of refolding of 76-residue Ub (Fig. 1a) by all-atom simulations is beyond present computational facilities the Go modeling is an appropriate choice. Most of the simulations have been carried out at K. Our present results for refolding upon the force quench are in the qualitative agreement with the experimental findings of Fernandez and Li, and with those obtained for I27 and S1 theoretically Li_PNAS06 . A number of quantitative differences between I27 and Ub will be also discussed. For Ub we have found the average location of the transition state nm which is in reasonable agreement with the experimental value 0.8 nm Fernandez_Sci04 .
Experimentally, the unfolding of the polyubiquitin has been studied by applying a constant force Schlierf_PNAS04 . The mechanical unfolding of Ub has previously investigated using Go-like West_BJ06 and all-atom models West_BJ06 ; Irback_PNAS05 . In particular, Irbäck et al. have explored mechanical unfolding pathways of structures A, B, C, D and E (see the definition of these structures and the -strands in the caption to Fig. 1) and the existence of intermediates in detail. We present our results on mechanical unfolding of Ub for five following reasons. First, the barrier to the mechanical unfolding has not been computed. Second, experiments of Schlierf et al. Schlierf_PNAS04 have suggested that cluster 1 (strands S1, S2 and the helix A) unfolds after cluster 2 (strands S3, S4 and S5). However, this observation has not yet been studied theoretically. Third, since the structure C, which consists of the strands S1 and S5, unzips first, Irbäck et al. pointed out that the strand S5 unfolds before S2 or the terminal strands follows the unfolding pathway S1 S5 S2. This conclusion may be incorrect because it has been obtained from the breaking of the contacts within the structure C. Fourth, in pulling and force-clamp experiments the external force is applied to one end of proteins whereas the other end is kept fixed. Therefore, one important question emerges is how fixing one terminus affects the unfolding sequencing of Ub. This issue has not been addressed by Irbäck et al. Irback_PNAS05 . Fifth, using a simplified all-atom model it was shown Irback_PNAS05 that mechanical intermediates occur more frequently than in experiments Schlierf_PNAS04 . It is relevant to ask if a Cα-Go model can capture similar intermediates as this may shed light on the role of non-native interactions.
In this paper, from the force dependence of mechanical unfolding times we estimated the distance between the native state and the transition state to be nm which is close to the experimental results of Carrion-Vazquez et al. Carrion-Vazquez_NSB03 and Schlierf et al. Schlierf_PNAS04 . In agreement with the experiments Schlierf_PNAS04 , cluster 1 was found to unfold after cluster 2 in our simulations. Applying the force to the both termini, we studied the mechanical unfolding pathways of the terminal strands in detail and obtained the sequencing S1 S2 S5 which is different from the result of Irbäck et al.. When the N-terminus is fixed and the C-terminus is pulled by a constant force the unfolding sequencing was found to be very different from the previous case. The unzipping initiates, for example, from the C-terminus but not from the N-one. Anchoring the C-end is shown to have a little effect on unfolding pathways. We have demonstrated that the present Cα-Go model does not capture rare mechanical intermediates, presumably due to the lack of non-native interactions. Nevertheless, it can correctly describe the two-state unfolding of Ub Schlierf_PNAS04 .
It is well known that thermal unfolding pathways may be very different from the mechanical ones, as has been shown for the domain I27 Paci_PNAS00 . This is because the force is applied locally to the termini while thermal fluctuations have the global effect on the entire protein. In the force case unzipping should propagate from the termini whereas under thermal fluctuations the most unstable part of a polypeptide chain unfolds first.
The unfolding of Ub under thermal fluctuations was investigated experimentally by Cordier and Grzesiek Cordier_JMB02 and by Chung et al. Chung_PNAS05 . If one assumes that unfolding is the reverse of the refolding process then one can infer information about the unfolding pathways from the experimentally determined -values Went_PEDS05 and -values Krantz_JMB04 ; Sosnick_ChemRev06 . The most comprehensive -value analysis is that of Went and Jacskon. They found that the C-terminal region which has very low -values unfolds first and then the strand S1 breaks before full unfolding of the helix fragment A occurs. However, the detailed unfolding sequencing of the other strands remains unknown.
Theoretically, the thermal unfolding of Ub at high temperatures has been studied by all-atom molecular dynamics (MD) simulations by Alonso and Daggett Alonso_ProSci98 and Larios et al. Larios_JMB04 . In the latter work the unfolding pathways were not explored. Alonso and Daggett have found that the -helix fragment A is the most resilient towards temperature but the structure B breaks as early as the structure C. The fact that B unfolds early contradicts not only the results for the -values obtained experimentally by Went and Jackson Went_PEDS05 but also findings from a high resolution NMR Cordier_JMB02 . Moreover, the sequencing of unfolding events for the structures D and E was not studied.
What information about the thermal unfolding pathways of Ub can be inferred from the folding simulations of various coarse-grained models? Using a semi-empirical approach Fernandez predicted Fernandez_JCP01 that the nucleation site involves the -strands S1 and S5. This suggests that thermal fluctuations break these strands last but what happens to the other parts of the protein remain unknown. Furthermore, the late breaking of S5 contradicts the unfolding Cordier_JMB02 and folding Went_PEDS05 experiments. From later folding simulations of Fernandez et al. Fernandez_Proteins02 ; Fernandez_PhysicaA02 one can infer that the structures A, B and C unzip late. Since this information is gained from -values, it is difficult to determine the sequencing of unfolding events even for these fragments. Using the results of Gilis and Rooman Gilis_Proteins01 we can only expect that the structures A and B unfold last. In addition, with the help of a three-bead model it was found Sorenson_Proteins02 that the C-terminal loop structure is the last to fold in the folding process and most likely plays a spectator role in the folding kinetics. This implies that the strands S4, S5 and the second helix (residues 38-40) would unzip first but again the full unfolding sequencing can not be inferred from this study.
Thus, neither the direct MD Alonso_ProSci98 nor indirect folding simulations Fernandez_JCP01 ; Fernandez_Proteins02 ; Fernandez_PhysicaA02 ; Gilis_Proteins01 ; Sorenson_Proteins02 provide a complete picture of the thermal unfolding pathways for Ub. One of our aims is to decipher the complete thermal unfolding sequencing and compare it with the mechanical one. The mechanical and thermal routes to the denaturated states have been found to be very different from each other. Under the force the -strand S1, e.g., unfolds first, while thermal fluctuations detach strand S5 first. The later observation is in good agreement with NMR data of Cordier and Grzesiek Cordier_JMB02 . A detailed comparison with available experimental and simulation data on the unfolding sequencing will be presented. The free energy barrier to thermal unfolding was also calculated.
To summarize, in this paper we have obtained the following novel results. We have shown that the refolding of Ub is a two-stage process in which the ”burst” phase exists on very short time scales. The construction of the phase diagram allows us to determine the equilibrium critical force separating the folded and unfolded regions. Using the exponential dependence of the refolding and unfolding times on , and were computed. Our results for , and are in acceptable agreement with the experiments. It has been demonstrated that fixing the N-terminus of Ub has much stronger effect on mechanical unfolding pathways compared to the case when the C-end is anchored. In comparison with previous studies, we provide a more complete picture for thermal unfolding pathways which are very different from the mechanical ones.
Materials and Methods
Cα-Go model for Ub
We use coarse-grained continuum representation for Ub in which only the positions of Cα-carbons are retained. The interactions between residues are assumed to be Go-like and the energy of such a model is as follows Clementi_JMB00
| (1) | |||||
Here , is the distance between beads and , is the bond angle between bonds and , and is the dihedral angle around the th bond and is the distance between the th and th residues. Subscripts “0”, “NC” and “NNC” refer to the native conformation, native contacts and non-native contacts, respectively. Residues and are in native contact if is less than a cutoff distance taken to be Å, where is the distance between the residues in the native conformation. With this choice of and the native conformation from the PDB (Fig. 1a), we have the total number of native contacts .
The first harmonic term in Eq. (1) accounts for chain connectivity and the second term represents the bond angle potential. The potential for the dihedral angle degrees of freedom is given by the third term in Eq. (1). The interaction energy between residues that are separated by at least 3 beads is given by 10-12 Lennard-Jones potential. A soft sphere repulsive potential (the fourth term in Eq. 1) disfavors the formation of non-native contacts. The last term accounts for the force applied to C and N termini along the end-to-end vector . We choose , , and , where is the characteristic hydrogen bond energy and Å. Since (see below) and Thomas_PNAS01 , we have . Then the force unit pN.
We assume the dynamics of the polypeptide chain obeys the Langevin equation. The equations of motion (see Ref. Kouza_BJ05, for details) were integrated using the velocity form of the Verlet algorithm Swope_JCP82 with the time step , where ps.
Simulations
In order to obtain the phase diagram we use the fraction of native contacts or the overlap function Camacho_PNAS93
| (2) |
where is equal to 1 if residues and form a native contact and 0 otherwise, and is the Heaviside function. The argument of this function guarantees that a native contact between and is classified as formed when is shorter than 1.2. The probability of being in the native state, , which can be measured by various experimental techniques, is defined as , where stands for a thermal average. The phase diagram ( a plot of as a function of and ) and thermodynamic quantities were obtained by the multiple histogram method Ferrenberg_PRL89 extended to the case when the external force is applied to the termini Klimov_PNAS99 ; Klimov_JPCB01 . In this case the reweighting is carried out not only for temperature but also for force. We collected data for six values of at and for five values of at a fixed value of . The duration of MD runs for each trajectory was chosen to be long enough to get the system fully equilibrated (9 from which 1.5 were spent on equilibration). For a given value of and we have generated 40 independent trajectories for thermal averaging.
For the mechanical unfolding we have considered two cases. In the first case the external force is applied via both termini N and C. In the second case it is applied to either N- or C-terminus.
To simulate the mechanical unfolding the computation has been performed at K and mainly at the constant force and 200 pN. This allows us to compare our results with the mechanical unfolding experiments Schlierf_PNAS04 and to see if the unfolding pathways change at low forces. Starting from the native conformation but with different random number seeds the unfolding sequencing of helix A and five -stands is studied by monitoring fraction of native contacts as a function of the end-to-end extension. In the case of structures A, B, C, D and E we consider not only the evolution of the number of intra-structure contacts as has been done by Irbäck et al. Irback_PNAS05 , but also the evolution of all contacts (intra-structure contacts and the contacts formed by a given structure with the rest of a protein).
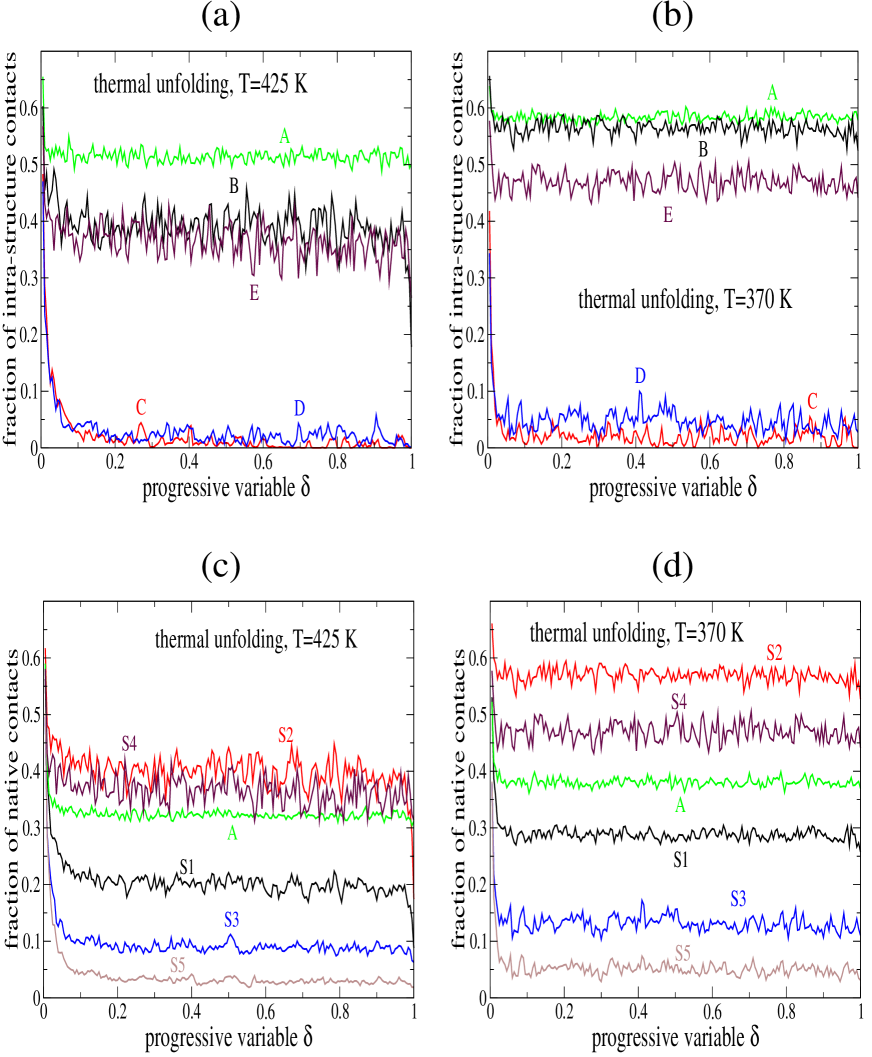
In the thermal unfolding case the simulation is also started from the native conformations and it is terminated when all of the native contacts are broken. Due to thermal fluctuations there is no one-to-one correspondence between and time. Therefore ceases to be a good reaction coordinate for describing unfolding sequencing. To rescue this, for each -th trajectory we introduce the progressive variable , where is the unfolding time. Then we can average the fraction of native contacts over a unique window and monitor the unfolding sequencing with the help of the progressive variable .
Results
Temperature-force phase diagram and thermodynamic quantities
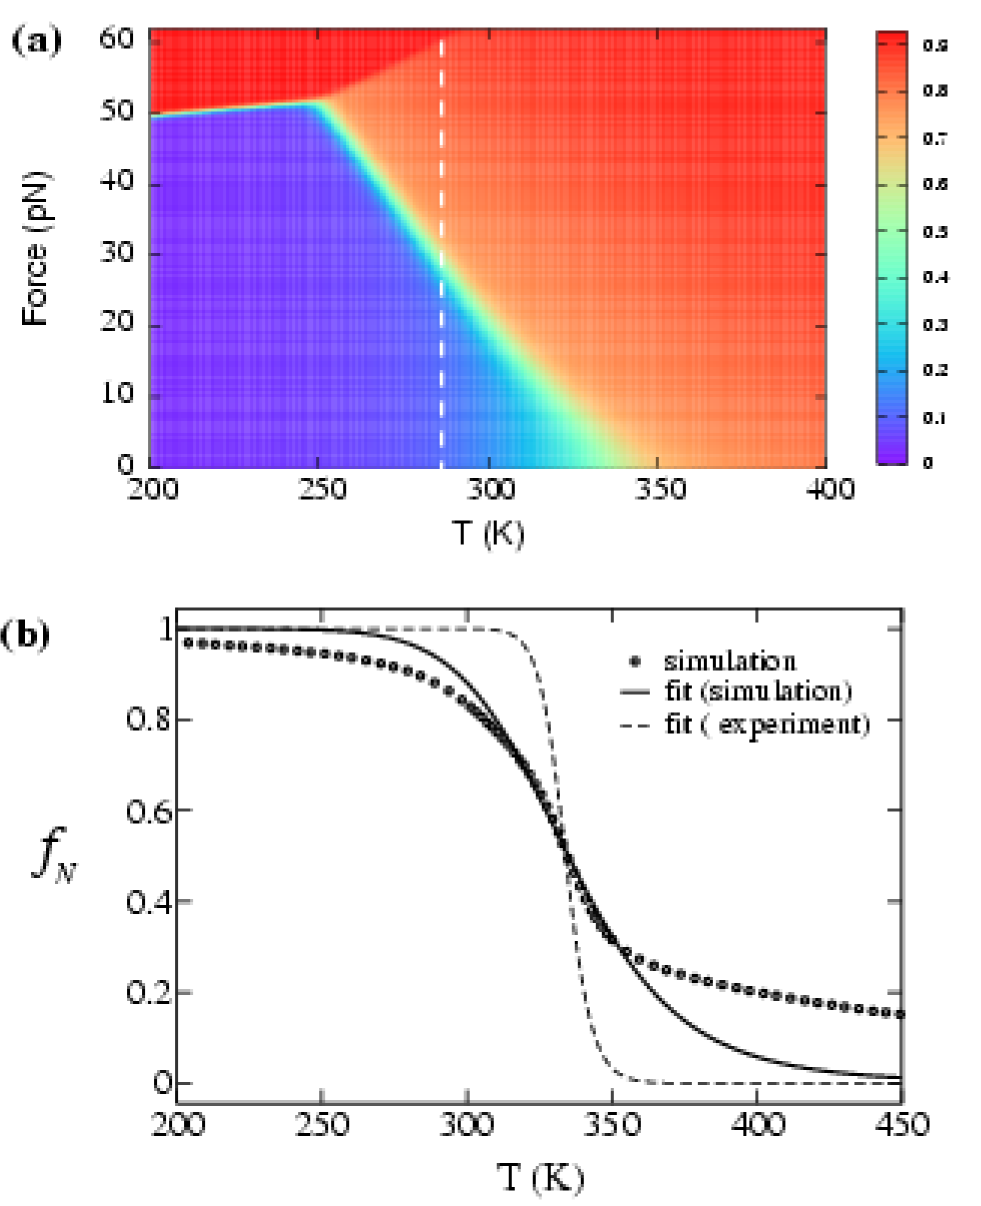
The phase diagram, obtained by the extended histogram method (see Materials and Methods), is shown in Fig. 2a. The folding-unfolding transition, defined by the yellow region, is sharp in the low temperature region but it becomes less cooperative (the fuzzy transition region is wider) as increases. The weak reentrancy (the critical force slightly increases with ) occurs at low temperatures. This seemingly strange phenomenon occurs as a result of competition between the energy gain and the entropy loss upon stretching. The similar cold unzipping transition was also observed in a number of models for heteropolymers Shakhnovich_PRE02 and proteins Klimov_PNAS99 including the Cα-Go model for I27 (MS Li, unpublished results). As follows from the phase diagram, at K the critical force pN which is close to pN, estimated from the experimental pulling data (To estimate from experimental pulling data we use Evans_BJ97 , where is the maximal force needed to unfold a protein at the pulling speed . From the raw data in Fig. 3b of Ref. Carrion-Vazquez_NSB03 we obtain 25 pN). Given the simplicity of the model this agreement can be considered satisfactory and it validates the use of the Go model.
Figure 2b shows the temperature dependence of population of the native state . Fitting to the standard two-state curve one can see that it works pretty well (solid curve) around the transition temperature but it gets worse at high due to slow decay of . Such a behavior is characteristic for almost all of theoretical models Kouza_BJ05 including the all-atom ones Phuong_Proteins05 . In fitting we have chosen the hydrogen bond energy kcal/mol in Hamiltonian (1) so that coincides with the experimental value 332.5 K Thomas_PNAS01 . From the fit we obtain kcal/mol which is smaller than the experimental value 48.96 kcal/mol indicating that the Go model is, as expected, less stable compared to the real Ub. Taking into account non-native contacts and more realistic interactions between side chain atoms is expected to increase the stability of the system.
The cooperativity of the denaturation transition may be characterized by the cooperativity index, (see Refs. Klimov_FD98, and Li_PRL04, for definition). From simulation data for presented in Fig. 2b we have which is considerably lower than the experimental value obtained with the help of = 48.96 kcal/mol and K Thomas_PNAS01 . The underestimation of in our simulations is not only a shortcoming of the off-lattice Go model Kouza_JPCA06 but also a common problem of much more sophisticated force fields in all-atom models Phuong_Proteins05 .
Another measure of the cooperativity is the ratio between the van’t Hoff and the calorimetric enthalpy Kaya_PRL00 . For the Go Ub we obtained . Applying the base line subtraction Chan_ME04 gives which is still much below for the truly one-or-none transition. Since is an extensive parameter, its low value is due to the shortcomings of the off-lattice Go models but not due to the finite size effects. More rigid lattice models give better results for the calorimetric cooperativity Li_Physica05 .
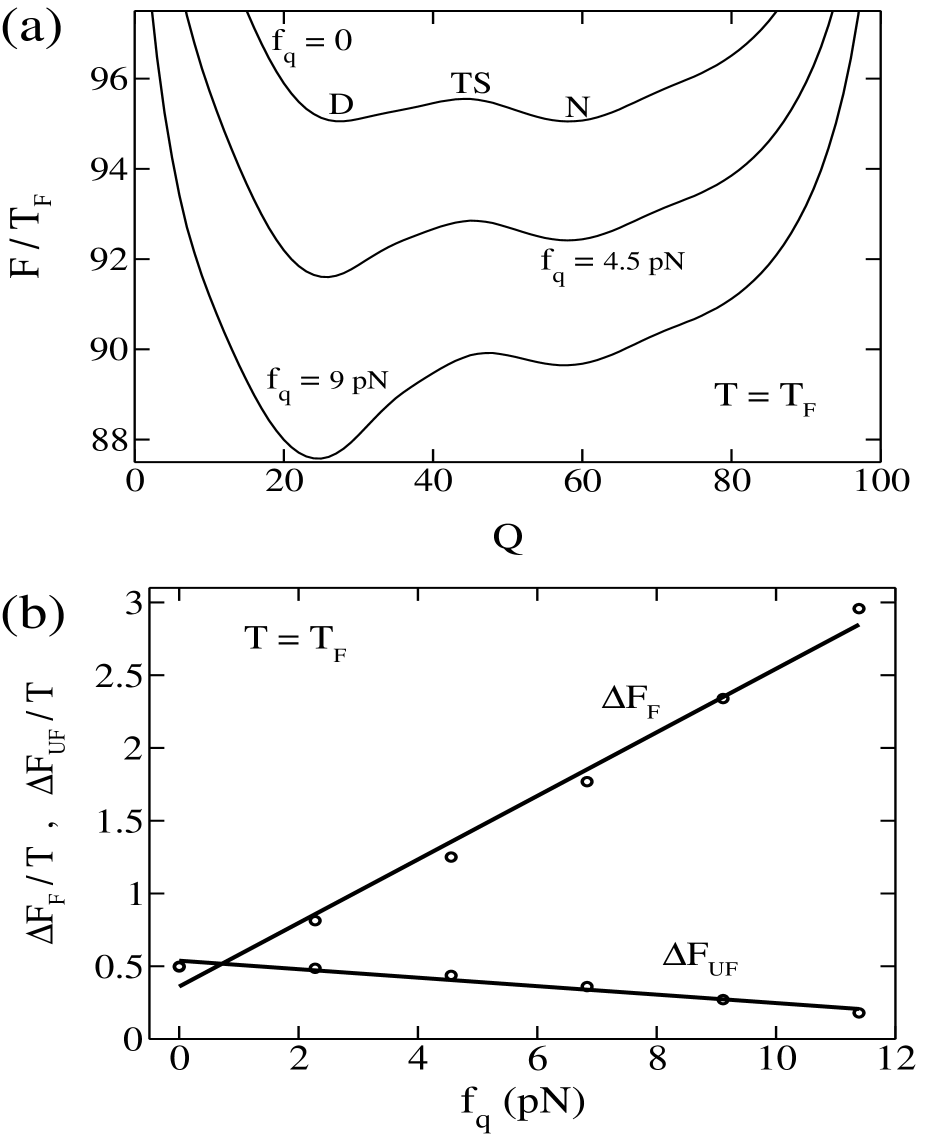
Figure 3a shows the free energy as a function of for several values of force at . Since there are only two minima, our results support the two-state picture of Ub Schlierf_PNAS04 ; Chung_PNAS05 . As expected, the external force increases the folding barrier, () and it lowers the unfolding barrier, (). From the linear fits in Fig. 3b we obtain the average distance between the TS and D states, nm, and the distance between TS and the native state, nm. Note that is very close to 0.96 nm obtained from refolding times at a bit lower temperature K (see Fig. 6 below). However, is lower than value 0.24 nm followed from mechanical unfolding data at (Fig. 8). This difference may be caused by either sensitivity of to the temperature or the determination of from the approximate free energy landscape as a function of a single coordinate is not sufficiently accurate.
We have also studied the free energy landscape using as a reaction coordinate. The dependence of on was found to be smoother (results not shown) compared to what was obtained by Kirmizialtin et al. Kirmizialtin_JCP05 using a more elaborated model Sorenson_Proteins02 which involves the non-native interactions.
Refolding under quenched force
Our protocol for studying the refolding of Ub is identical to what has been done on the experiments of Fernandez and Li Fernandez_Sci04 . We first apply the force pN to prepare initial conformations (the protein is stretched if , where the contour length nm). Starting from the FDE we quenched the force to and then monitored the refolding process by following the time dependence of the number of native contacts , and the radius of gyration for typically 50 independent trajectories.
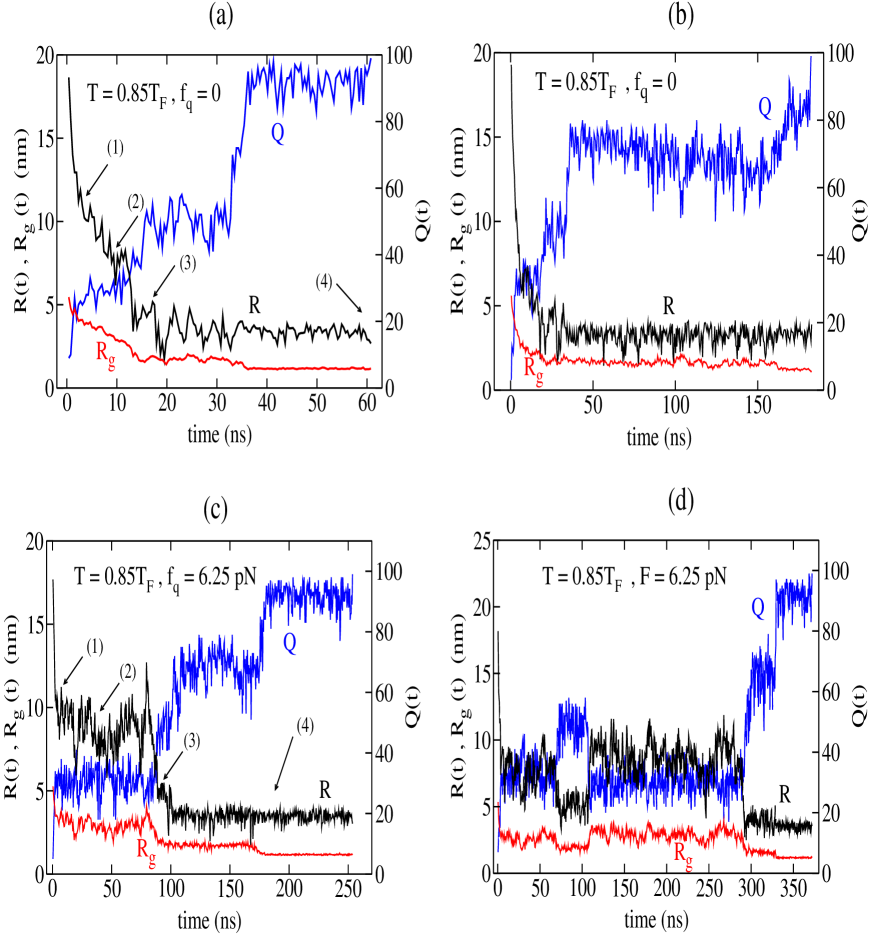
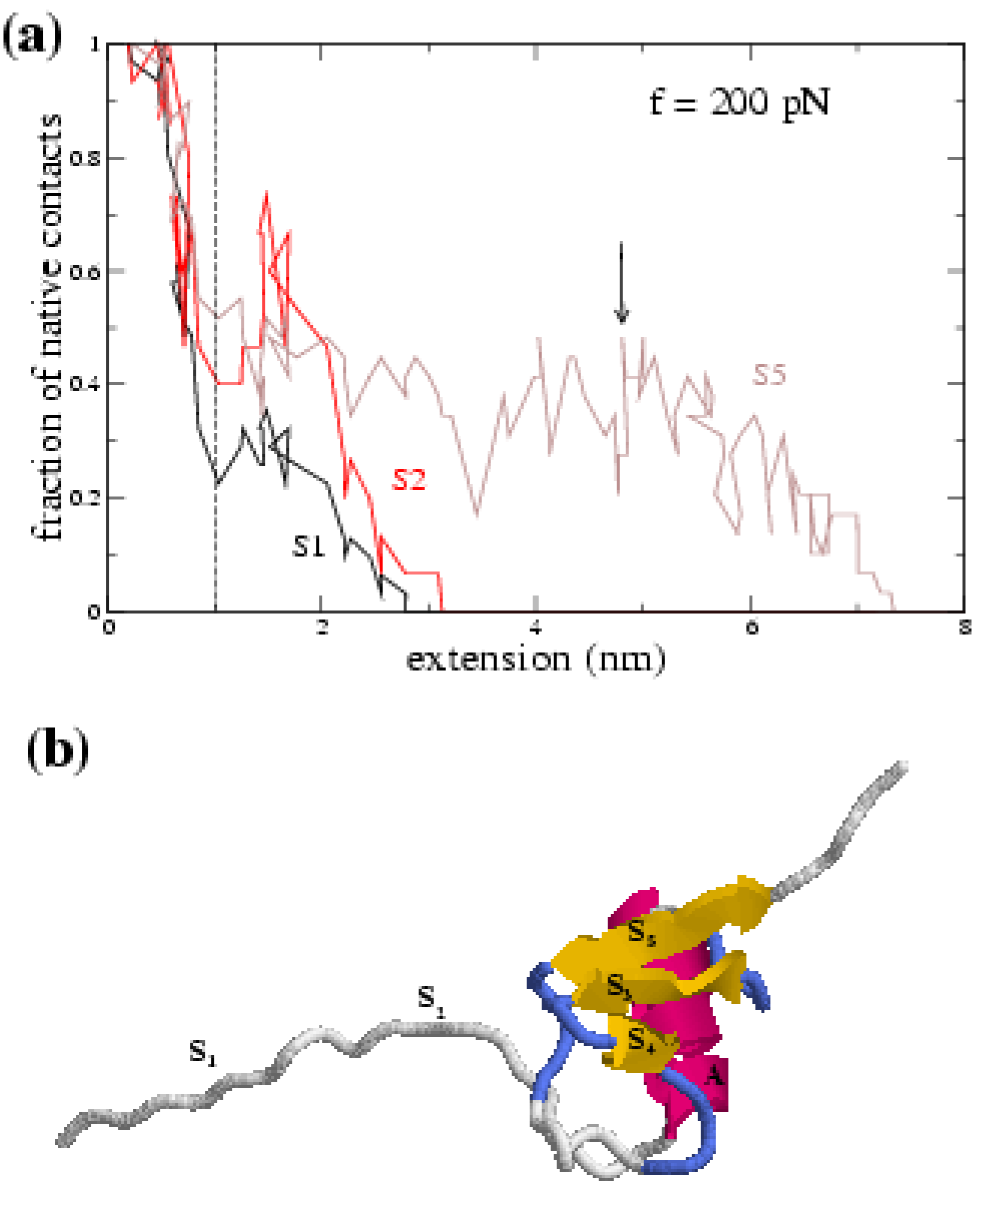
Figure 4 shows considerable diversity of refolding pathways. In accord with experiments Fernandez_Sci04 and simulations for I27 Li_PNAS06 , the reduction of occurs in a stepwise manner. In the case (Fig. 4a) decreases continuously from nm to 7.5 nm (stage 1) and fluctuates around this value for about 3 ns (stage 2). The further reduction to nm (stage 3) until a transition to the NBA. The stepwise nature of variation of is also clearly shown up but it is more masked for . Although we can interpret another trajectory for (Fig. 4b) in the same way, the time scales are different. Thus, the refolding routes are highly heterogeneous.
The pathway diversity is also evident for (Fig. 4c and d). Although the picture remains qualitatively the same as in the case, the time scales for different steps becomes much larger. The molecule fluctuates around nm, e.g., for ns (stage 2 in Fig. 4c) which is considerably longer than ns in Fig. 4a. The variation of becomes more drastic compared to the case.
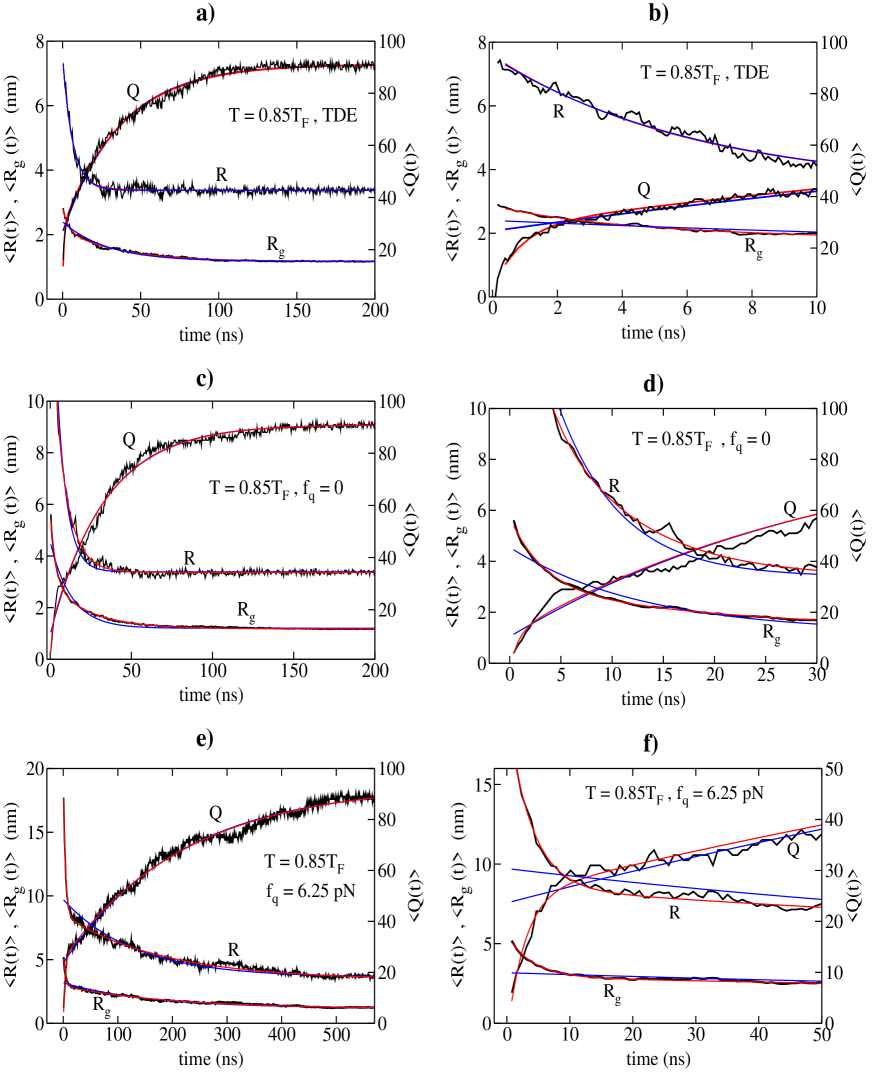
Figure 5 shows the time dependence of and , where stands for averaging over 50 trajectories. The left and right panels correspond to the long and short time windows, respectively. For the TDE case (Fig. 5a and b) the single exponential fit works pretty well for for the whole time interval. A little departure from this behavior is seen for and for ns (Fig. 5b). Contrary to the TDE case, even for (Fig. 5c and d) the difference between the single and bi-exponential fits is evident not only for and but also for . The time scales, above which two fits become eventually identical, are slightly different for three quantities (Fig. 5d). The failure of the single exponential behavior becomes more and more evident with the increase of , as demonstrated in Figs. 5e and f for the FDE case with pN.
Thus, in agreement with our previous results, obtained for I27 and the sequence S1 Li_PNAS06 , starting from FDE the refolding kinetics compiles of the fast and slow phase. The characteristic time scales for these phases may be obtained using a sum of two exponentials,, where stands for , or . Here characterizes the burst-phase (first stage) while may be either the collapse time (for and ) or the folding time (for ) (). As in the case of I27 and S1 Li_PNAS06 , and are almost independent on (results not shown). We attribute this to the fact that the quench force ( pN) is much lower than the entropy force () needed to stretch the protein. At K, one has to apply pN for stretching Ub to 0.8 . Since the initial compaction of the chain that is driven by is not sensitive to the small values of . Contrary to , was found to increase with exponentially. Moreover, implying that the chain compaction occurs before the acquisition of the native state.
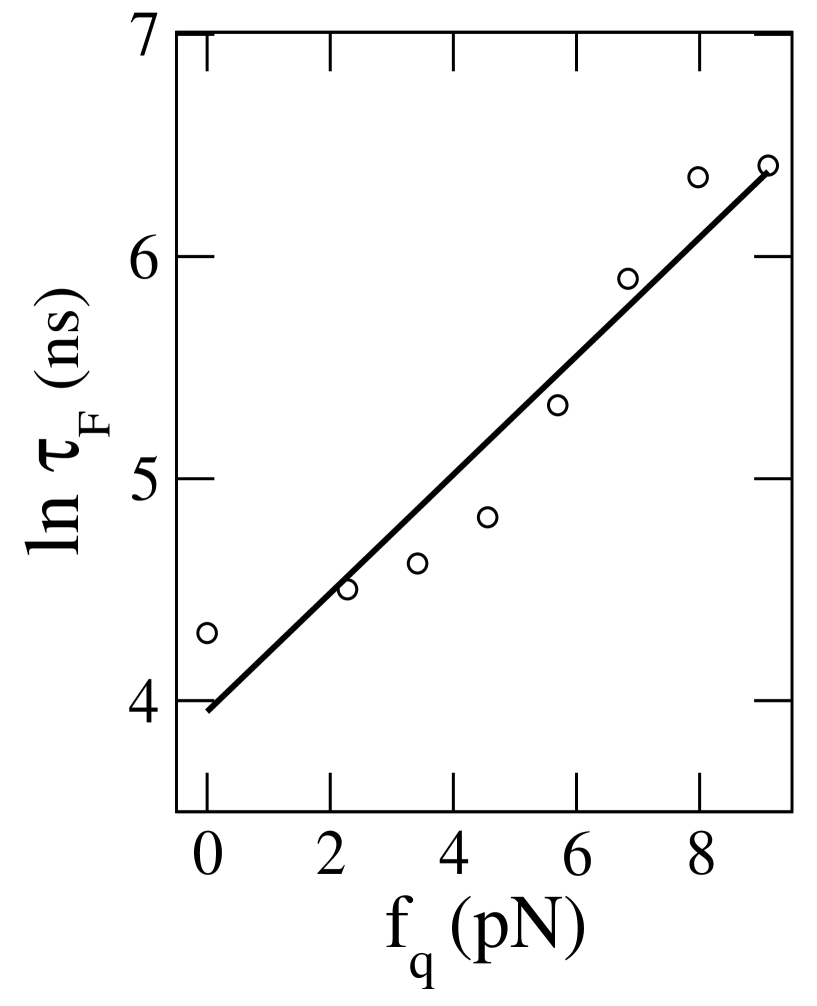
Figure 6 shows the dependence of the folding times on . Using the Bell-type formula Bell_Sci78 and the linear fit in Fig. 6 we obtain nm which is in acceptable agreement with the experimental value nm Fernandez_Sci04 . The linear growth of the free energy barrier to folding with is due to the stabilization of the random coil states under the force. Our estimate for Ub is higher than nm obtained for I27 Li_PNAS06 . One of possible reasons for such a pronounced difference is that we used the cutoff distance and 0.6 nm in the Go model (1) for Ub and I27, respectively. The larger value of would make a protein more stable (more native contacts) and it may change the free energy landscape leading to enhancement of . This problem requires further investigation.
Absence of mechanical unfolding intermediates in Cα-Go model
In order to study the unfolding dynamics of Ub, Schlierf et al. Schlierf_PNAS04 have performed the AFM experiments at a constant force and 200 pN. The unfolding intermediates were recorded in about of 800 events at different forces. The typical distance between the initial and intermediate states is nm Schlierf_PNAS04 . However, the intermediates do not affect the two-state behavior of the polypeptide chain. Using the all-atom models Irbäck et al. Irback_PNAS05 have also observed the intermediates in the region 6.7 nm nm. Although the percentage of intermediates is higher than in the experiments, the two-state unfolding events remain dominating. To check the existence of force-induced intermediates in our model, we have performed the unfolding simulations for and 200 pN. Because the results are qualitatively similar for all values of force, we present pN case only.
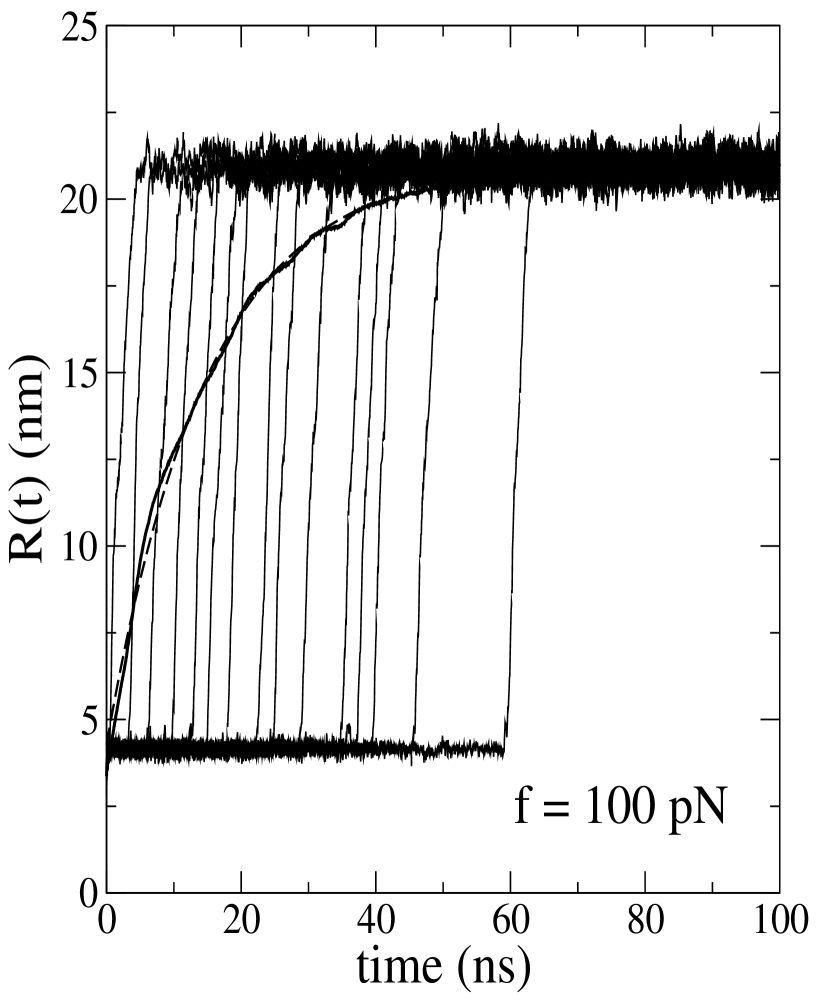
Figure 7 shows the time dependence of for fifteen runs starting from the native value nm. For all trajectories the plateau occurs at nm. As seen below, passing this plateau corresponds to breaking of intra-structure native contacts of structure C. At this stage the chain ends get almost stretched out, but the rest of the polypeptide chain remains native-like. The plateau is washed out when we average over many trajectories and is well fitted by a single exponential (Fig. 7), in accord with the two-state behavior of Ub Schlierf_PNAS04 .
The existence of the plateau observed for individual unfolding events in Fig. 7 agrees with the all-atom simulation results of Irbäck et al. Irback_PNAS05 who have also recorded the similar plateau at nm at short time scales. However unfolding intermediates at larger extensions do not occur in our simulations. This is probably related to neglect of the non-native interactions in the Cα-Go model. Nevertheless, this simple model provides the correct two-state unfolding picture of Ub in the statistical sense.
Mechanical unfolding barrier
We now try to determine the barrier to the mechanical unfolding from the dependence of the unfolding times on . It should be noted that this way of determination of the unfolding barrier is exact and it would give a more reliable estimate compared to the free energy landscape approach in which the free energy profile is approximated as a function of only one order parameter.
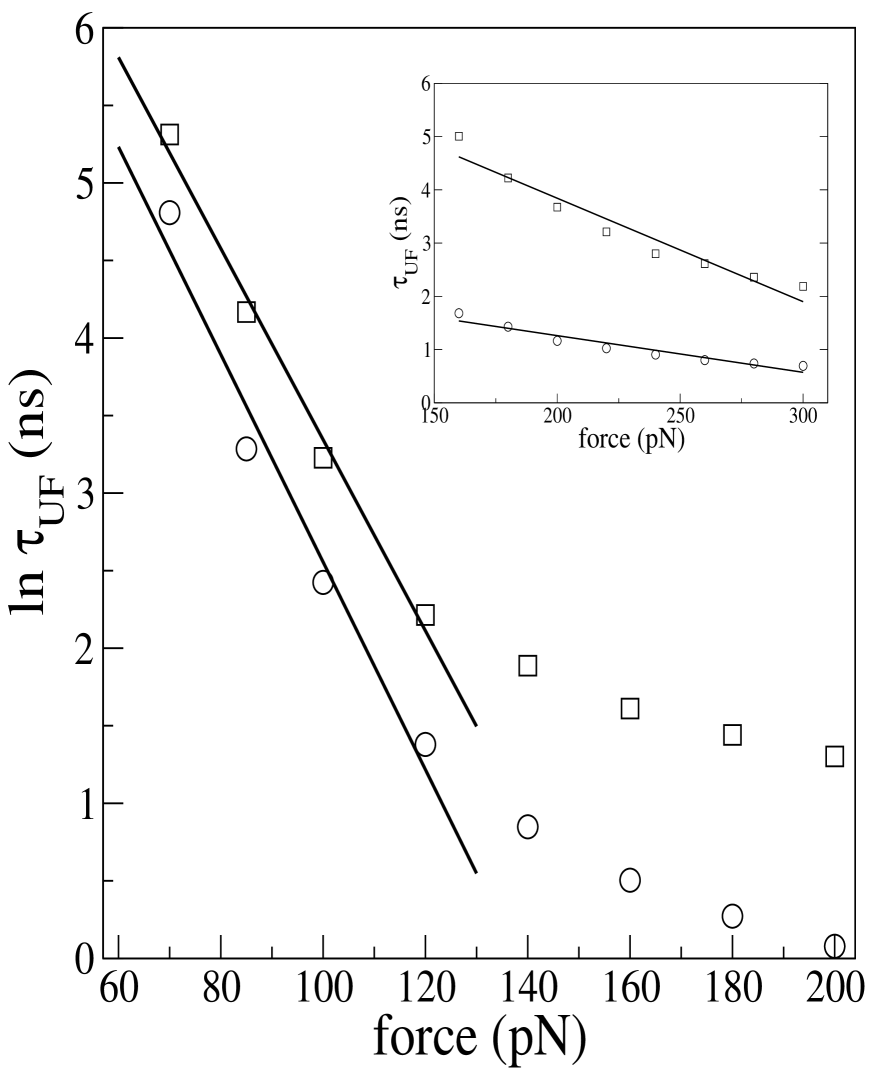
We first consider the case when the force is applied via both termini N and C. Since the force lowers the unfolding barrier, should decrease as increases (Fig. 8). The present Go model gives smaller than the experimental values by about eight orders of magnitude. E.g., for pN, ns whereas the experiments gives 2.77 s Schlierf_PNAS04 . As seen from Fig. 8, for pN depends on exponentially. In this regime , where is the average distance between the N and TS states. From the linear fit in Fig. 8 we obtained 0.24 nm. Using different fitting procedures Schlierf et al. Schlierf_PNAS04 have obtained 0.14 nm and 0.17 nm. The larger value 0.25 nm was reported in the earlier experiments Carrion-Vazquez_NSB03 . Thus, given experimental uncertainty, the Cα-Go model provides a reasonable estimate of for the two-state Ub.
In the high force regime ( pN) instead of the exponential dependence scales with linearly (inset in Fig. 8). The crossover from the exponential to the linear behavior is in full agreement with the earlier theoretical prediction Evans_BJ97 . The similar crossover has been also observed Szymczak_JPCM06 for the another Go-like model of Ub but has not been estimated. At very high forces is expected to be asymptotically independent of .
One can show that fixing one terminus of a protein has the same effect on unfolding times no matter the N- or C-terminus is fixed. Therefore, we show the results obtained for the case when the N-end is anchored. As seen from Fig. 8, the unfolding process is slowed down nearly by a factor of 2. It may imply that diffusion-collision processes Karplus_Nature76 play an important role in the Ub unfolding. Namely, as follows from the diffusion-collision model, the time, required for formation (breaking) contacts, is inversely proportional to the diffusion coefficient, , of a pair of spherical units. If one of them is idle, is halved and the time needed to break contacts increases accordingly. Although fixing one end increases the unfolding times, it does not change the distance between the TS and the native state, (Fig. 8).
Mechanical unfolding pathways: force is applied to both termini
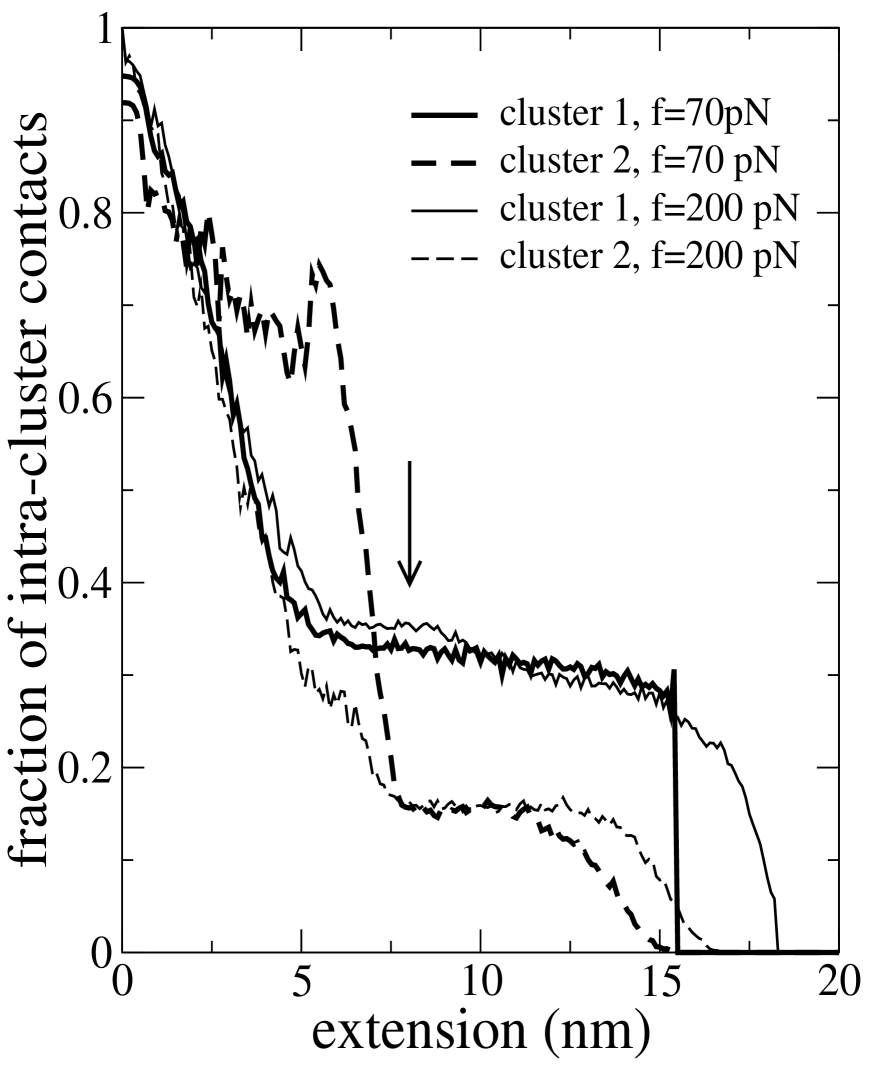
Here we focus on the mechanical unfolding pathways by monitoring the number of native contacts as a function of the end-to-end extension , where is the equilibrium value of . For K nm. Following Schlierf et al. Schlierf_PNAS04 , we first divide Ub into two clusters. Cluster 1 consists of strands S1, S2 and the helix A (42 native contacts) and cluster 2 - strands S3, S4 and S5 (35 native contacts). The dependence of fraction of intra-cluster native contacts is shown in Fig. 9 for and 200 pN (similar results for and 140 pN are not shown). In agreement with the experiments Schlierf_PNAS04 the cluster 2 unfolds first. The unfolding of these clusters becomes more and more synchronous upon decreasing . At pN the competition with thermal fluctuations becomes so important that two clusters may unzip almost simultaneously. Experiments at low forces are needed to verify this observation.
The arrow in Fig. 9 marks the position nm, where some intermediates were recorded in the experiments Schlierf_PNAS04 . At this point there is intensive loss of native contacts of the cluster 2 suggesting that the intermediates observed on the experiments are conformations in which most of the contacts of this cluster are already broken but the cluster 1 remains relatively structured ( contacts). One can expect that the cluster 1 is more ordered in the intermediate conformations if the side chains and realistic interactions between amino acids are taken into account.
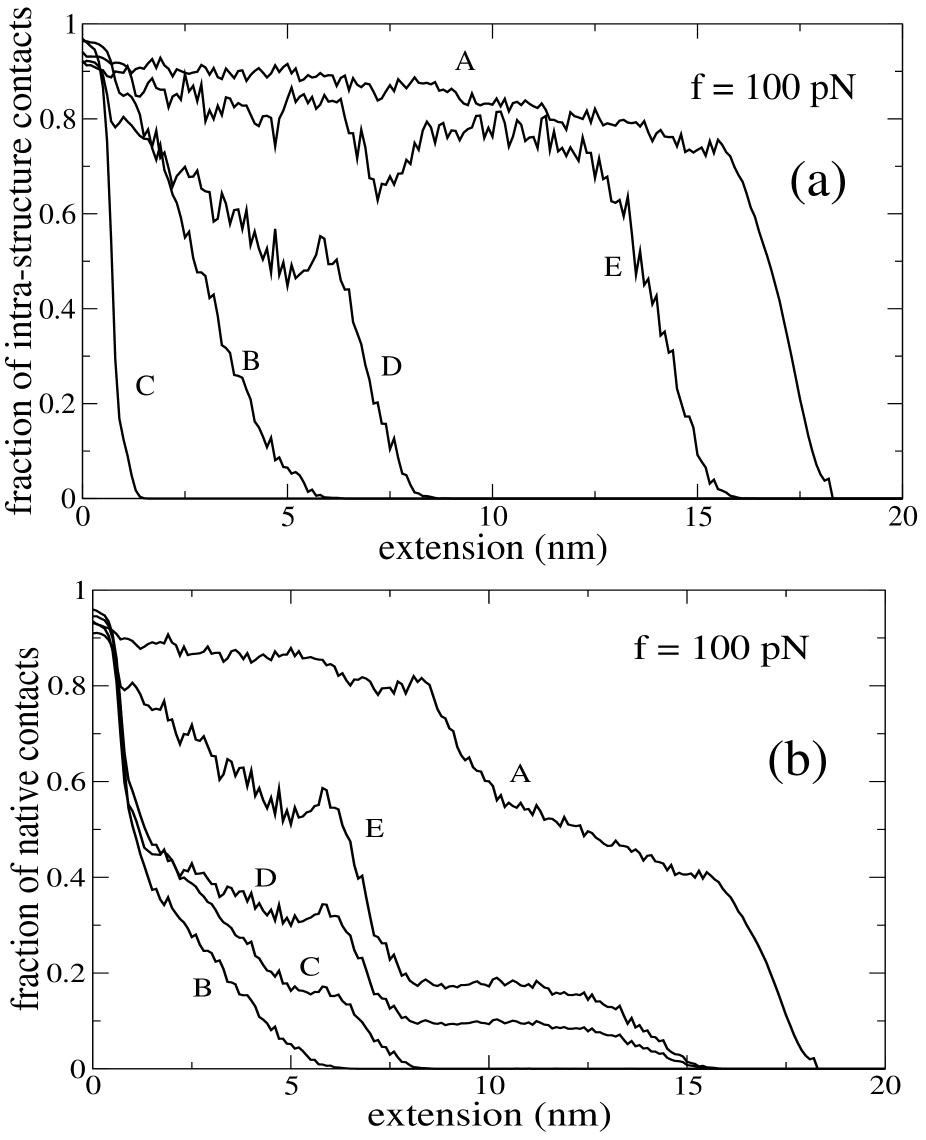
To compare the mechanical unfolding pathways of Ub with the all-atom simulation results Irback_PNAS05 we discuss the sequencing of helix A and structures B, C, D and E in more detail. We monitor the intra-structure native contacts and all contacts separately. The later include not only the contacts within a given structure but also the contacts between it and the rest of the protein. It should be noted that Irbäck et al. have studied the unfolding pathways based on the evolution of the intra-structure contacts. Fig. 10a shows the dependence of the fraction of intra-structure contacts on at pN. At 1nm, which corresponds to the plateau in Fig. 7, most of the contacts of C are broken. In agreement with the all-atom simulations Irback_PNAS05 , the unzipping follows C B D E A. Since C consists of the terminal strands S1 and S5, it was suggested that these fragments unfold first. However, this scenario may be no longer valid if one considers not only intra-structure contacts but also other possible ones (Fig. 10b). In this case the statistically preferred sequencing is B C D E A which holds not only for =100 pN but also for other values of . If it is true then S2 unfold even before S5. To make this point more transparent, we plot the fraction of contacts for S1, S2 and S5 as a function of (Fig. 11a) for a typical trajectory. Clearly, S5 detaches from the core part of a protein after S2 (see also the snapshot in Fig. 11b). So, instead of the sequencing S1 S5 S2 proposed by Irbäck et al., we obtain S1 S2 S5.
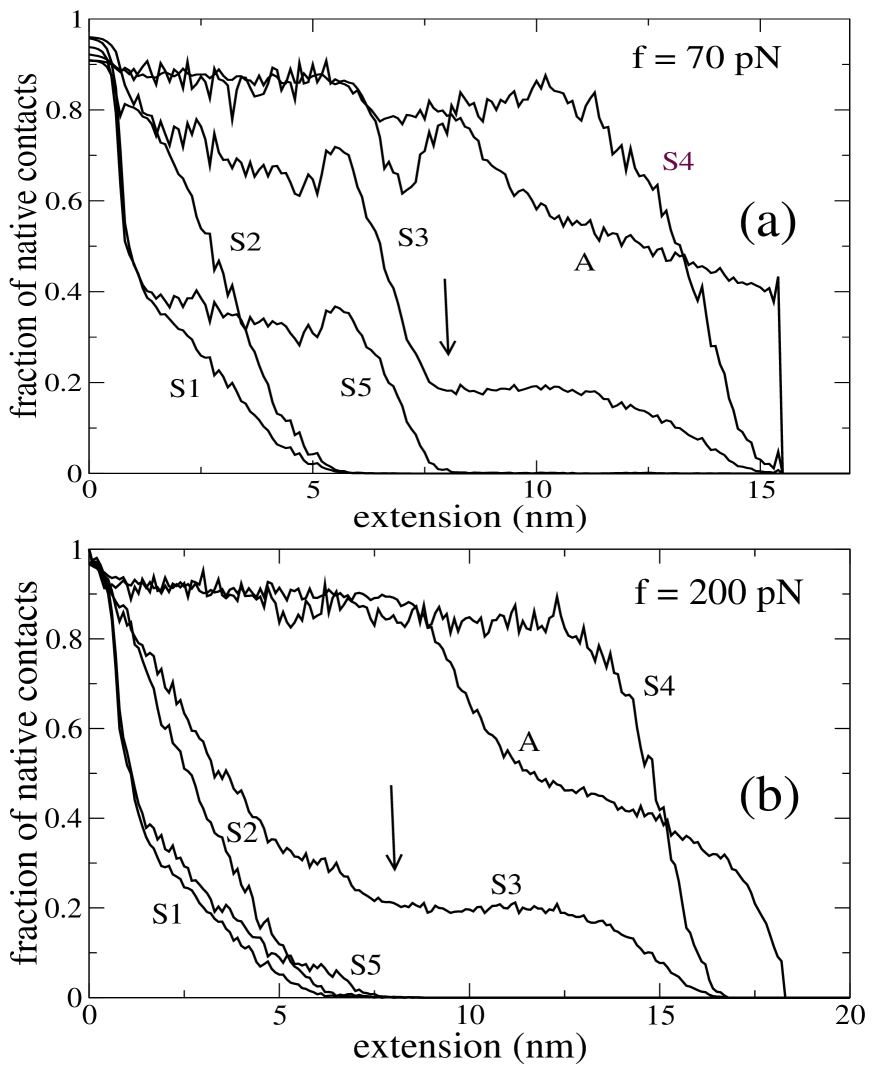
The dependence of the fraction of native contacts on for individual strands is shown in Fig. 12a ( pN) and Fig. 12b (=200 pN). At nm contacts of S1, S2 and S5 are already broken whereas S4 and A remain largely structured. In terms of -strands and A we can interpret the intermediates observed in the experiments of Schlierf et al. Schlierf_PNAS04 as conformations with well structured S4 and A, and low ordering of S3. This interpretation is more precise compared to the above argument based on unfolding of two clusters because if one considers the average number of native contacts, then the cluster 2 is unstructured in the intermediate state (Fig. 9), but its strand S4 remains highly structured (Fig. 12).
From Fig. 12 we obtain the following mechanical unfolding sequencing
| (3) |
It should be noted that the sequencing (3) is valid in the statistical sense. In some trajectories S5 unfolds even before S1 and S2 or the native contacts of S1, S2 and S5 may be broken at the same time scale (Table 1). From the Table 1 it follows that the probability of having S1 unfolded first decreases with lowering but the main trend (3) remains unchanged. One has to stress again that the sequencing of the terminal strands S1, S2 and S5 given by Eq. 3 is different from what proposed by Irbäck et al. based on the breaking of the intra-structure contacts of C. Unfortunately, there are no experimental data available for comparison with our theoretical prediction.
Mechanical unfolding pathways: One end is fixed
N-terminus is fixed. Here we adopted the same procedure as in the previous section except the N-terminus is held fixed during simulations. As in the process where both of the termini are subjected to force, one can show that the cluster 1 unfolds after the cluster 2 (results not shown).
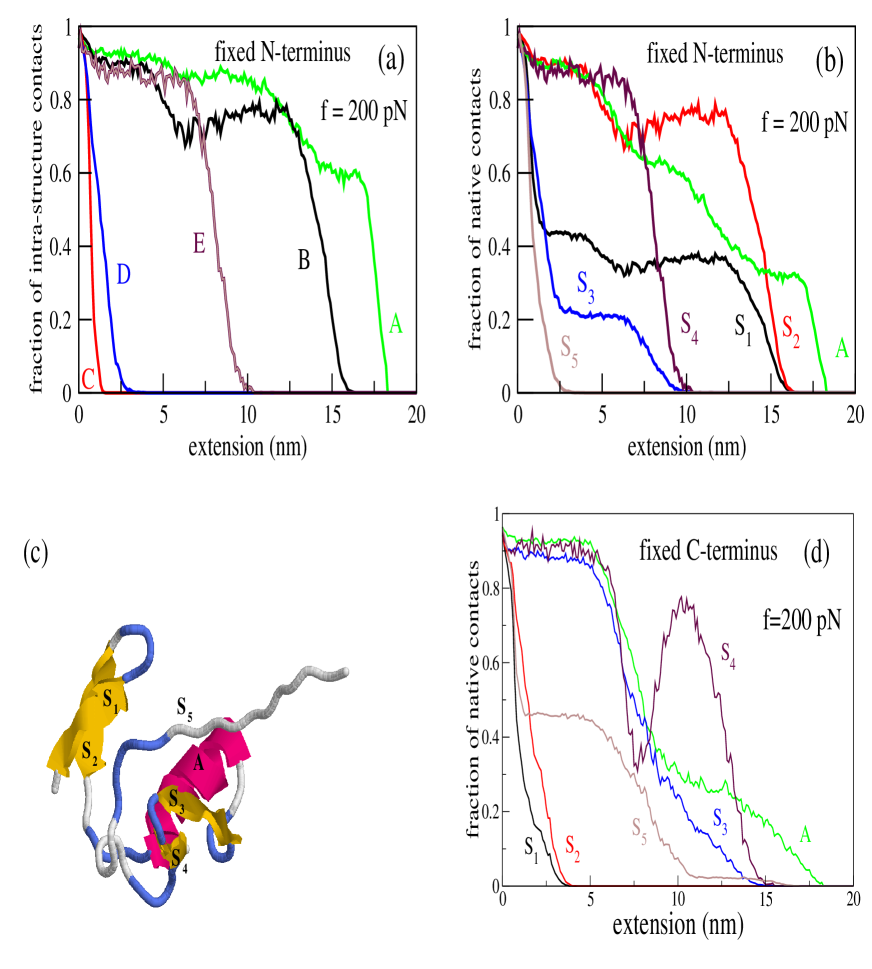
From Fig. 13 we obtain the following unfolding pathways
| (4a) | |||
| (4b) |
which are also valid for the other values of force (=70, 100 and 140 pN). Similar to the case when the force is applied to both ends, the structure C unravels first and the helix A remains the most stable. However, the sequencing of B, D and E changes markedly compared to the result obtained by Irbäck et al Irback_PNAS05 (Fig. 10a).
As evident from Eqs. 3 and 4b, anchoring the first terminal has a much more pronounced effect on the unfolding pathways of individual strands. In particular, unzipping commences from the C-terminus instead of from the N-one. Fig. 13c shows a typical snapshot where one can see clearly that S5 detaches first. At the first glance, this fact may seem trivial because S5 experiences the external force directly. However, our experience on unfolding pathways of the well studied domain I27 from the human cardiac titin, e.g., shows that it may be not the case. Namely, as follows from the pulling experiments Marszalek_Nature99 and simulations Lu_Proteins99 , the strand A from the N-terminus unravels first although this terminus is kept fixed. From this point of view, what strand of Ub detaches first is not a priori clear. In our opinion, it depends on the interplay between the native topology and the speed of tension propagation. The later factor probably plays a more important role for Ub while the opposite situation happens with I27. One of possible reasons is related to the high stability of the helix A which does not allow either for the N-terminal to unravel first or for seriality in unfolding starting from the C-end.
C-terminus is fixed. One can show that unfolding pathways of structures A,B, C, D and E remain exactly the same as in the case when Ub has been pulled from both termini (see Fig. 10). Concerning the individual strands, a slight difference is observed for S5 (compare Fig. 13d and Fig. 12). Most of the native contacts of this domain break before S3 and S4, except the long tail at extension 11 nm due to high mechanical stability of only one contact between residues 61 and 65 (the highest resistance of this pair is probably due to the fact that among 25 possible contacts of S5 it has the shortest distance in sequence). This scenario holds in about 90% of trajectories whereas S5 unravels completely earlier than S3 and S4 in the remaining trajectories. Thus, anchoring C-terminus has much less effect on unfolding pathways compared to the case when the N-end is immobile.
It is worth to note that, experimentally one has studied the effect of extension geometry on the mechanical stability of Ub fixing its C-terminus Carrion-Vazquez_NSB03 . The greatest mechanical strength (the longest unfolding time) occurs when the protein is extended between N- and C-termini. This result has been supported by Monte Carlo Carrion-Vazquez_NSB03 as well as MD West_BJ06 simulations. However the mechanical unfolding sequencing has not been studied yet. It would be interesting to check our results on the effect of fixing one end on Ub mechanical unfolding pathways by experiments.
Thermal unfolding pathways
In order to study the thermal unfolding we follow the protocol described in Materials and Methods. Two hundreds trajectories were generated starting from the native conformation with different random seed numbers. The fractions of native contacts of helix A and five -strands are averaged over all trajectories for the time window . The unfolding routes are studied by monitoring these fractions as a function of . Above K the strong thermal fluctuations (entropy driven regime) make all strands and helix A unfold almost simultaneously. Below this temperature the statistical preference for the unfolding sequencing is observed. We focus on and 425 K. As in the case of the mechanical unfolding the cluster 2 unfolds before cluster 1 (results not shown). However, the main departure from the mechanical behavior is that the strong resistance to thermal fluctuations of the cluster 1 is mainly due to the stability of strand S2 but not of helix A (compare Fig. 14c and d with Fig. 12). The unfolding of cluster 2 before cluster 1 is qualitatively consistent with the experimental observation that the C-terminal fragment (residues 36-76) is largely unstructured while native-like structure persists in the N-terminal fragment (residues 1-35) Bofill_JMB05 ; Cox_JMB93 ; Jourdan_Biochem00 . This is also consistent with the data from the folding simulations Sorenson_Proteins02 as well as with the experiments of Went and Jackson Went_PEDS05 who have shown that the -values in the C-terminal region. However, our finding is at odds with the high -values obtained for several residues in this region by all-atom simulations Marianayagam_BPC04 and by a semi-empirical approach Fernandez_JCP01 . One possible reason for high -values in the C-terminal region is due to the force fields. For example, Marianayagam and Jackson have employed the GROMOS 96 force field Gunstren_96 within the software GROMACS software package Berendsen_CPC95 . It would be useful to check if the other force fields give the same result or not.
The evolution of the fraction of intra-structure contacts of A, B, C, D and E is shown in Fig. 14a ( K) and b (370 K). Roughly we have the unfolding sequencing, given by Eq. 5a, which strongly differs from the mechanical one. The large stability of the helix fragment A against thermal fluctuations is consistent with the all-atom unfolding simulations Alonso_ProSci98 and the experiments Went_PEDS05 . The N-terminal structure B unfolds even after the core part E and at K its stability is comparable with helix A. The fact that B can withstand thermal fluctuations at high temperatures agrees with the experimental results of Went and Jackson Went_PEDS05 and of Cordier and Grzesiek Cordier_JMB02 who used the notation instead of B. This also agrees with the results of Gilis and Rooman Gilis_Proteins01 who used a coarse-grained model but disagrees with results from all-atom simulations Alonso_ProSci98 . This disagreement is probably due to the fact that Alonso and Daggett studied only two short trajectories and B did not completely unfold Alonso_ProSci98 . The early unzipping of the structure C (Eq. 5a) is consistent with the MD prediction Alonso_ProSci98 . Thus our thermal unfolding sequencing (Eq. 5a) is more complete compared to the all-atom simulation and it gives the reasonable agreement with the experiments.
We now consider the thermal unstability of individual -strands and helix A. At = 370 K (Fig. 14d) the trend that S2 unfolds after S4 is more evident compared to the K case (Fig. 14c). Overall, the simple Go model leads to the sequencing given by Eq. 5b.
| (5a) | |||
| (5b) |
From Eq. 3, 4b and 5b it is obvious that the thermal unfolding pathways of individual strands markedly differ from the mechanical ones. This is not surprising because the force should unfold the termini first while under thermal fluctuations the most unstable part is expected to detach first. Interestingly, for the structures the thermal and mechanical pathways (compare Eq. 5a and 4a) are almost identical except that the sequencing of C and D is less pronounced in the former case. This coincidence is probably accidental.
The fact that S5 unfolds first agrees with the high-resolution NMR data of Cordier and Grzesiek Cordier_JMB02 who studied the temperature dependence of hydrogen bonds of Ub. However, using the -value analysis Krantz et al Krantz_JMB04 have found that S5 (B3 in their notation) breaks even after S1 and S2. One of possible reasons is that, as pointed out by Fersht Fersht_PNAS04 , if there is any plasticity in the transition state which can accomodate the crosslink between the metal and bi-histidines, then -values would be significantly greater than zero even for an unstructured region, leading to an overestimation of structure in the transition state. In agreement with our results, the -value analysis Went_PEDS05 yields that S5 breaks before S1 and A but it fails to determine whether S5 breaks before S3. By modeling the amide I vibrations Chung et al. Chung_PNAS05 argued that S1 and S2 are more stable than S3, S4 and S5. Eq. 5b shows that the thermal stability of S1 and S2 is indeed higher than S3 and S5 but S4 may be more stable than S1. The reason for only partial agreement between our results and those of Chung et al. remains unclear. It may be caused either by the simplicity of the Go model or by the model proposed in Ref. Chung_PNAS05 . The relatively high stability of S4 (Eq. 5b) is supported by the -value analysis Krantz_JMB04 .
Thermal unfolding barrier
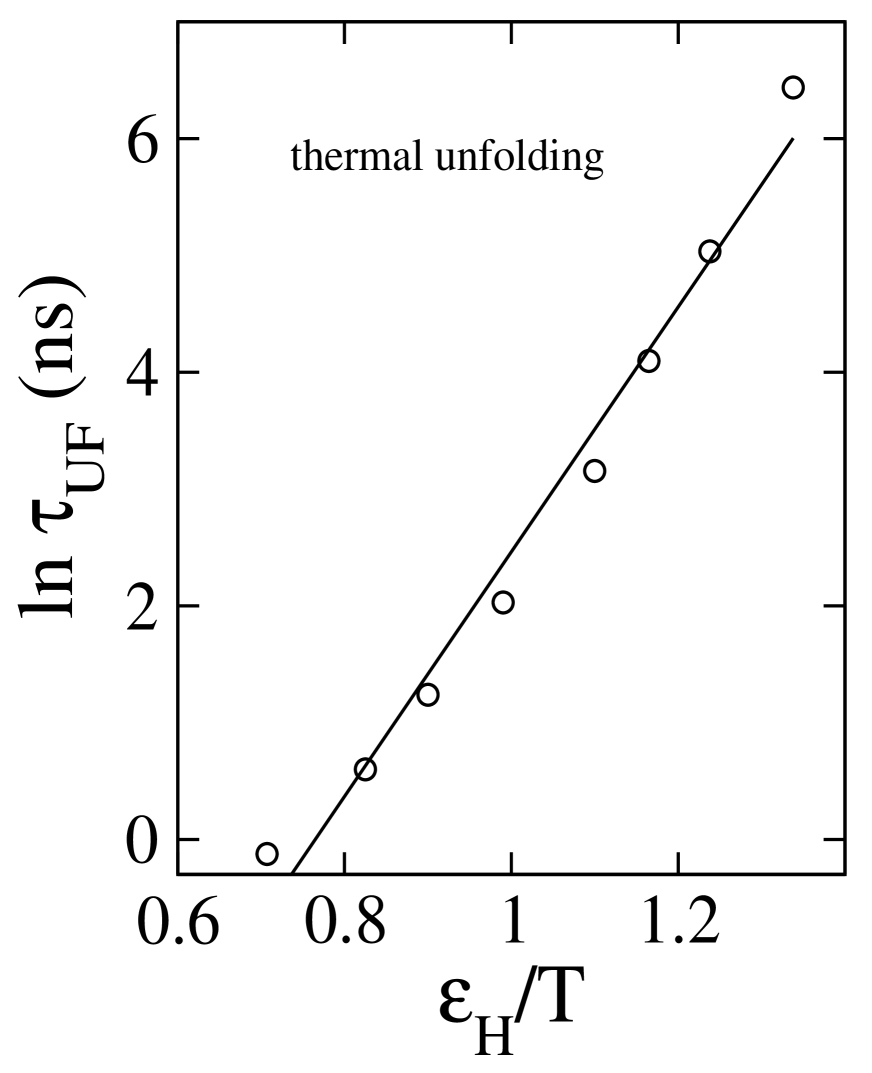
Figure 15 shows the temperature dependence of the unfolding time which depends on the thermal unfolding barrier, , exponentially, . From the linear fit in Fig. 15 we obtain kcal/mol. It is interesting to note that is compatible with kcal/mol obtained from the equilibrium data (Fig. 2b). However, the latter is defined by an equilibrium constant (the free energy difference between native and denatured states) but not by the rate constant (see, for example, Ref. Noronha_BJ04, ).
Discusion
We have studied the refolding of Ub following the same protocol as in the force-clamp experiments of Fernandez and Li Fernandez_Sci04 . Under the low quenched force the refolding is two-stage process characterized by two different time scales and , where . This result further strengthens our previous prediction Li_PNAS06 that the nature of the folding starting from the FDE does not depend on details of models. The simple Cα-Go model provides reasonable estimates for the equilibrium critical force as well as the averaged distance between the D and TS states, , and the distance between the N and TS states, . We have also obtained from the two-state fit of the population of the NBA, , and the thermal unfolding barrier . It would be interesting to measure experimentally and compare it with .
The shortcoming of the Go model we used is its failure to capture seldom unfolding intermediates observed in the experiments Schlierf_PNAS04 as well as in the all-atom simulations Irback_PNAS05 . However it mimics the overall two-state behavior of Ub. Our simulations suggest that the non-native interactions, neglected in the Go model, may be the cause of mechanical unfolding intermediates.
Due to thermal fluctuations the thermal unfolding pathways are not well defined as in the mechanical case. Nevertheless, at K the statistical preference in the sequencing of unfolding events is evident. In accord with the experiments, the cluster 2 unfolds before cluster 1 in the mechanical as well as in the thermal cases. However, in terms of individual strands we predict that mechanical and thermal unfolding follows very different pathways (Eq. 3 and Eq. 5b). Mechanically strand S1 is the most unstable whereas the thermal fluctuations break contacts of S5 first. If we consider only breaking of intra-structure native contacts, then our mechanical sequencing agrees with the all-atom simulation results Irback_PNAS05 . It is probably not unexpected because mechanical unfolding pathways may depend largely on the topology of the native conformation and in some cases the Go-like models may give results comparable with experimental ones West_BJ06 . However, contrary to Irbäck et al. Irback_PNAS05 , we predict that the terminal strands follow the mechanical unfolding sequencing: S1 S2 S5. It would be very exciting to perform the AFM experiments to verify this prediction and the whole unfolding sequencing (Eq. 3)
We have considered the effect of fixing one end on unfolding kinetics and found that it delays the unfolding by nearly a factor of 2 regardless to what end is anchored. We argue that this general result may be understood, using the diffusion-collision model developed by Karplus and Weaver Karplus_Nature76 . However, fixing one terminus does not affect the distance between the native state and TS. One of the most interesting results is that what terminus we keep fixed matters for the unfolding sequencing. Namely, anchoring the N-end changes it dramatically (see Eq. 3 and Eq. 4b) whereas fixing the C-end has only a minor effect.
As evident from Eqs. 5a and 5b and the detailed discussion in the Introduction, our thermal unfolding sequencing is more complete compared with previous theoretical studies Alonso_ProSci98 ; Fernandez_JCP01 ; Fernandez_Proteins02 ; Fernandez_PhysicaA02 ; Gilis_Proteins01 ; Sorenson_Proteins02 . We have obtained some agreement with the experimental data Cordier_JMB02 ; Chung_PNAS05 ; Went_PEDS05 ; Krantz_JMB04 on the instability of the structures and -strands. However the picture for thermal unfolding pathways is still incomplete. More experiments are needed to check our prediction given by Eqs. 5a and 5b.
We have also shown that refolding from FDE and folding from TDE have the same pathways which are not sensitive to the quenched force. The refolding/folding sequencing is the same as for the thermal unfolding (see Eqs. 5a and 5b) but in the inverse order implying that the protein folding is the reversible process.
MSL thanks A. Irbäck, D. K. Klimov, S. Mitternacht, E. P. O’Brien Jr. and D. Thirumalai for very useful discussions. This work was supported by the KBN grant No 1P03B01827, National Science Council in Taiwan under grant numbers No. NSC 93-2112-M-001-027 and 95-2119-M-002-001, and Academia Sinica in Taiwan under grant numbers AS-92-TP-A09 and AS-95-TP-A07.
References
- (1) Fisher, T. E., Oberhauser, A. F., Carrion-Vazquez, M., Marszalek, P. E. Fernandez, J. M. (1999). The study of protein mechanics with the atomic force microscope. Trends Biochem. Sci. 24, 379-384
- (2) Fernandez, J. M. and Li H. (2004). The study of protein mechanics with the atomic force microscope Science 303, 1674-1678.
- (3) Bell, G. I. (1978). Models for the specific adhesion of cells to cells. Science 100 618-627.
- (4) Li, M. S., Hu C. K., Klimov, D. K. Thirumalai, D. (2006), Multiple stepwise refolding of immunoglobulin domain I27 upon force quench depends on initial conditions. Proc. Natl. Acad. Sci USA 103, 93-98.
- (5) Clementi, C., Nymeyer, H. Onuchic, J. (2000). Totological and energetic factors: what determines the structutral detail of of transition state ensemble and ”en-route” intermediates for protein folding? J. Mol. Biol. 298, 937-953.
- (6) Klimov, D. K. Thirumalai D. (2000). Native topology determines force-induced unfolding pathways in globular proteins. Proc. Natl. Acad. Sci USA 97, 7254-7259.
- (7) Schlierf, M., Li, H. Fernandez, J. M. (2004), Proc. Natl. Acad. Sci. USA 101, 7299-7304.
- (8) D. K. West and D. J. Brockwell and P. D. Olmsted and S. E. Radford and E. Paci (2006). Mechanical resistance of proteins explained using simple molecular models. Biophys. J. 90, 287-297.
- (9) A. Irback and S. Mittetnacht and S. Mohanty (2005). Dissecting the mechanical unfolding of ubiquitin. Proc. Natl. Acad. Sci. USA, 102, 13427-13432.
- (10) Carrion-Vazquez, M., Li, H., Lu, H., Marszalek, P. E., Oberhauser, A. F. Fernandez, J. M. (2003) The mechanical stability of ubiquitin is linkage dependent. Nat. Struct. Biol. 10, 738-743
- (11) Paci, E. Karplus, M. (2000), Unfolding proteins by external forces and temperature: The importance of topology and energetics, Proc. Natl. Acad. Sci. USA 97, 6521 - 6526.
- (12) Cordier, F. Grzesiek, S. (2002) Temperature-dependence of protein hydrogen bond properties as studied by high-resolution NMR, J. Mol. Biol. 715, 739-752.
- (13) Chung, H. S., Khalil, M.,Smith, A. W., Ganim, Z. Tomakoff A. (2005) Conformational changes during the nanosecond-to-milllisecond unfolding of ubiquitin, Proc. Natl. Acad. Sci USA 102, 612-617 (2005)
- (14) H. M. Went and S. E. Jackson (2005). Ubiquitin folds through a highly polarized transition state. Protein Eng. Des. Sel. 18, 229-237.
- (15) B. A. Krantz and R. S. Dothager and T. R. Sosnick (2004). Discerning the structure and energy of multiple transition states in protein folding using -analysis. J. Mol. Biol. 337, 463-475.
- (16) T. R. Sosnick and B. A. Kratz and R. S. Dothager and M. Baxa (2006). Characterizing the protein folding transition state using analysis. Chem. Rev. 106, 1862-1876.
- (17) D. O. V. Alonso and V. Daggett (1998). Molecular dynamics simulations of hydrophobic collapse of ubiquitin. Protein Sci. 7, 860-874.
- (18) E. Larios and J. S. Li and K. Schulten and H. Kihara and M. Gruebele (2004). Multiple probes reveal a native-like intermediate during low-temperature refolding of ubiquitin. J. Mol. Biol. 340, 115-125.
- (19) A. Fernandez (2001). Conformation-dependent environments in folding proteins. J. Phys. Chem. 114, 2489-2502.
- (20) A. Fernandez (2002). Time-resolved backbone desolvation and mutational hot spots in folding nucleus. Proteins. 47, 447-457.
- (21) A. Fernandez and A. Colubri and R.S. Berry (2002). Three-body correlations in protein folding: the origin of cooperativity. Physica A. 307, 235-259.
- (22) D. Gilis and M. Rooman (2001). Identification and Ab initio simulations of early folding units in proteins. ”Proteins: Struc. Fun. Gen. 42, 164-176
- (23) Sorenson, J. M. Head-Gordon, T. (2002). Toward minimalist models of larger proteins: a ubiquitin-like protein, Proteins: Struc. Fun. Gen. 46, 368-379.
- (24) Thomas, S. T. , Loladze, V. V. Makhatadze, G. I. (2001) Proc. Natl. Acad. Sci. USA 98, 10670-10675
- (25) Kouza M., Chang C.F. Hayryan S., Yu T. H., Li M. S., Huang T. H., and Hu C. K. (2005) Folding of the Protein Domain hbSBD. Biophys. J. 89, 3353-3361
- (26) Swope, W. C., Andersen, H. C., Berens, P. H. & Wilson, K. R. (1982) Computer simulation method for the calculation of equilibrium constants for the formation of physical clusters and molecules: Application to small water clusters. J. Chem. Phys. 76, 637-649.
- (27) Camacho, C. J. & Thirumalai, D. (1993) Kinetics and thermodynamics of folding in model proteins. Proc. Natl. Acad. Sci. USA 90 6369-6372.
- (28) Ferrenberg, A. M. & Swendsen, R. H. (1989) Optimized Monte-Carlo data analysis. Phys. Rev. Lett. 63, 1195-1198.
- (29) Klimov, D. K. Thirumalai, D. (1999) Proc. Natl. Acad. Sci USA 96, 6166.
- (30) Klimov, D. K. Thirumalai, D. (2001) Lattice Model studies of force-induced unfolding of proteins. J. Phys. Chem. B 105, 6648-6654.
- (31) Geissler, P. L. and Shakhnovich, E. I. (2002) Reversible stretching of random heteropolymers, Phys. Rev. E. 65, 056110.
- (32) Evans, E., Ritchie, K. (1997). Dynamics strength of molecular adhesion bonds. Biophys. J. 72, 1541-1555.
- (33) Nguyen, P. H., Stock, G., Mittag, E., Hu, C. K. Li, M. S. (2005), Free Energy Landscape and Folding Mechanism of -Hairpin in Explicit Water: A Replica Exchange Molecular Dynamics Study, Proteins: Structures, Functions, and Bioinformatics 61, 795-808.
- (34) Klimov, D. K. & Thirumalai, D. (1998) Cooperativity in protein folding: from lattice models with sidechains to real proteins. Fold. Des. 3, 127-139.
- (35) Li, M. S., Klimov, D. K. Thirumalai, D. (2004) Phys. Rev. Lett. 93, 268107-268110.
- (36) Kouza, M., Li, M. S., Hu, C. K., O’Brien Jr., E. P. Thirumalai, D. (2006), Effect of finite size on cooperativity and folding rates of proteins, J. Phys. Chem. A 110 671 - 676.
- (37) Kaya, H. Chan, H. S. (2000) Phys. Rev. Lett. 85, 4823-4826.
- (38) Chan, H. S., Shimizu S. Kaya, H. (2004) Methods in Enzymology 380, 350-379.
- (39) Li, M. S., Klimov, D. K. Thirumalai, D. (2005), Finite size effects on calorimetric cooperativity of two-state proteins, Physica A 350, 38-44.
- (40) Kirmizialtin,S., Huang, L. Makarov, D. E. (2005), Topography of the free energy landscape probed via mechanical unfolding of proteins. J. Chem. Phys. 122, 234915
- (41) Szymczak, P. Cieplak, M. (2006), Stretching of proteins in a force-clamp, J. Phys.: Condens. Matt. 18, L21-L28.
- (42) M. Karplus and D. L. Weaver (1976). Protein-folding dynamics. Nature. 260, 404-406.
- (43) P. E. Marszalek and H. Lu and H. Li and M. Carrion-Vazquez and A. F. Oberhauser and K. Schulten and J. M. Fernandez (1999). Mechanical unfolding intermediates in titin modules.Nature. 402, 100-103.
- (44) H. Lu and K. Schulten (1999). Steered molecular dymanics simulations of force-induced protein domain unfolding. Proteins: Struc. Fun. Gen. 35, 453-463.
- (45) Bofill, R. Searle M. S. (2005), Engineering stabilising -sheet interactions into a conformationally flexible region of the folding transition state of ubiquitin, J. Mol. Biol. 353 373-384.
- (46) Cox, J. P. L., Evans, P. A., Packman, L. C., Williams, D. H. Woolfson, D. N. (1993). Dissecting the structure of a partially folded protein. CD and NMR studies of peptides from ubiquitin, J. Mol. Biol. 234, 483-492
- (47) Jourdan, M. Searle, M. S. (2000). Cooperative assembly of a native-like ubiquitin structure through peptide fragment complexation: energetics of peptide association and folding. Biochemistry 39, 12355-12364.
- (48) , N. J. Marianayagam and S. E. Jackson (2004). The folding pathway of ubiquitin from all-atom molecular dynamics simulations. Biophysical Chemistry. 111, 159-171.
- (49) W.F. van Gunsteren and S. R. Billeter and A. A. Eising and P. H. Hünenberger and P. Krüger and A. E. Mark and W.R.P. Scott and I.G. Tironi (1996). Biomolecular Simulation: The GROMOS96 Manual and User Guide. Vdf Hochschulverlag AG an der ETH, Zurich.
- (50) H.J.C. Berendsen and D. van der Spoel and R. van Drunen (1995). GROMACS: a message-passing parallel molecular dynamics implementation. Comp. Phys. Comm. 91, 43-56.
- (51) A. R. Fersht (2004). value versus analysis. Proc. Natl. Acad. Sci. USA. 101, 17327-17328.
- (52) Nothonha, M., Lima, J. C., Bastos, M., Santos, H. Macanita, A. L. (2004). Unfolding of ubiquitin studied by picosecond time-resolved fluorescence of the tyrosine residue, Biophys. J 87, 2609-2620.
| Force (pN) | S1 S2 S5 () | S5 S1 S2 () | (S1,S2,S5) () |
| 70 | 81 | 8 | 11 |
| 100 | 76 | 10 | 14 |
| 140 | 53 | 23 | 24 |
| 200 | 49 | 26 | 25 |
TABLE 1. Dependence of unfolding pathways on the external force. There are three possible scenarios: S1 S2 S5, S5 S1 S2, and three strands unzip almost simultaneously (S1,S2,S5). The probabilities of observing these events are given in percentage.
Figure Captions
FIGURE 1. (a) Native state conformation of ubiquitin taken from the PDB (PDB ID: 1ubq). There are five -strands: S1 (2-6), S2 (12-16), S3 (41-45), S4 (48-49) and S5 (65-71), and one helix A (23-34). (b) Structures B, C, D and E consist of pairs of strands (S1,S2), (S1,S5), (S3,S5) and (S3,S4), respectively. In the text we also refer to helix A as the structure A.
FIGURE 2. (a) The phase diagram obtained by the extended histogram method. The force is applied to termini N and C. The color code for is given on the right. The blue color corresponds to the state in the NBA, while the red color indicates the unfolded states. The vertical dashed line refers to K at which most of simulations have been performed. (b) The temperature dependence of (open circles) defined as the renormalized number of native contacts (see Material and Methods). The solid line refers to the two-state fit to the simulation data. The dashed line represents the experimental two-state curve with = 48.96 kcal/mol and K Thomas_PNAS01 .
FIGURE 3. (a) The dependence of the free energy on for selected values of at . D and N refer to the denaturated and native state, respectively. (b) The dependence of folding and unfolding barriers, obtained from the free energy profiles, on . The linear fits and correspond to and , respectively. From these fits we obtain 10 nm and 0.13 nm.
FIGURE 4. (a) and (b) The time dependence of , and for two typical trajectories starting from FDE ( and K). The arrows 1, 2 and 3 in (a) correspond to time 3.1 ( nm), 9.3 ( nm) and 17.5 ns ( nm). The arrow 4 marks the folding time = 62 ns ( nm) when all of 99 native contacts are formed. (c) and (d) are the same as in (a) and (b) but for = 6.25 pN. The corresponding arrows refer to 7.5 ( nm), 32 ( nm), 95 ns ( nm) and ns ( nm).
FIGURE 5. (a) The time dependence of , and when the refolding starts from TDE. (b) The same as in (a) but for the short time scale. (c) and (d) The same as in (a) and (b) but for FDE with . (e) and (f) The same as in (c) and (d) but for =6.25 pN.
FIGURE 6. The dependence of folding times on the quench force at K. was computed as the average of the first passage times ( is the same as extracted from the bi-exponential fit for ). The result is averaged over 30 - 50 trajectories depending on . From the linear fit with correlation level equal -0.96 we obtain 0.96 nm.
FIGURE 7. Time dependence of the end-to-end distance for pN. The thin curves refer to fifteen representative trajectories. The averaged over 200 trajectory is represented by the thick line. The dashed curve is the single exponential fit , where ns.
FIGURE 8. Dependence of mechanical unfolding time on the force. Circles refer to the process when the force is applied to both N and C termini. Squares signifies the case when the N-end is fixed and the C-end is pulled. For the first case the linear fit () gives the distance between the native state and TS 0.24 nm. In the second case, from the linear fit () we obtained 0.22 nm. Thus, within error bars fixing one end does not affect the value of . The inset shows the linear dependence of on in the high force regime.
FIGURE 9. The dependence of fraction of the native contacts on the end-to-end extension for cluster 1 (solid lines) and cluster 2 (dashed lines) at and 200 pN. The results are averaged over 200 independent trajectories. The arrow points to the extension = 8.1 nm.
FIGURE 10. (a) The dependence of fraction of the intra-structure native contacts on for structures A, B, C, D and E at pN. (b) The same as in a) but for all native contacts. The results are averaged over 200 independent trajectories.
FIGURE 11. (a) The dependence of fraction of the native contacts on for strand S1, S2 and S5 (). The vertical dashed line marks the position of the plateau at 1 nm. (b) The snapshot, chosen at the extension marked by the arrow in a), shows that S2 unfolds before S5. At this point all native contacts of S1 and S2 have already broken while 50 of the native contacts of S5 are still present.
FIGURE 12. (a) The dependence of fraction of the native contacts on extension for A and all -strands at . (b) The same as in (a) but for pN. The arrow points to nm where the intermediates are recorded on the experiments Schlierf_PNAS04 . The results are averaged over 200 trajectories.
FIGURE 13. (a) The dependence of fraction of the intra-structure native contacts on extension for all structures at . The N-terminus is fixed and the external force is applied via the C-terminus. (b) The same as in (a) but for the native contacts of all individual -strands and helix A . The results are averaged over 200 trajectories. (c) A typical snapshot which shows that S5 is fully detached from the core while S1 and S2 still have and 100% contacts, respectively. (d) The same as in (b) but the C-end is anchored and N-end is pulled. The strong drop in the fraction of native contacts of S4 at nm does not correspond to the substantial change of structure as it has only 3 native contacts in total.
FIGURE 14. (a) The dependence of fraction of intra-structure native contacts on the progressive variable for all structures at =425 K. (b) The same as in (a) but for K. (c) The dependence of the all native contacts of the -strands and helix A at =425 K. (d) The same as in (c) but for K.
FIGURE 15. Dependence of thermal unfolding time on , where is the hydrogen bond energy. The straight line is a fit .