Efficient Degradation and Expression Prioritization with Small RNAs
Abstract
We build a simple model for feedback systems involving small RNA (sRNA) molecules based on the iron metabolism system in the bacterium E. coli, and compare it with the corresponding system in H. pylori which uses purely transcriptional regulation. This reveals several unique features of sRNA based regulation that could be exploited by cells. Firstly, we show that sRNA regulation can maintain a smaller turnover of target mRNAs than transcriptional regulation, without sacrificing the speed of response to external shocks. Secondly, we propose that a single sRNA can prioritize the usage of different target mRNAs. This suggests that sRNA regulation would be more common in more complex systems which need to co-regulate many mRNAs efficiently.
pacs:
87.80.Vt,87.16.Ac,89.75.-k, 89.75.FbKeywords: RNA interference, small RNA, micro RNA, RyhB, Hfq, feedback
1 Introduction
Small noncoding RNAs (sRNAs) have recently been discovered as key components of genetic regulation in systems ranging from bacteria to mammals [1, 2, 3], and this has spurred much activity in understanding their functional advantages. For example, degradation of sRNA with their target mRNAs has been proposed as a mechanism to obtain ultrasensitivity [4].
One particular system which has been extensively studied is the Fe-Fur system in the bacterium Escherichia coli which contains the regulatory sRNA RyhB [5, 6]. This system is responsible for maintaining homeostasis of Fe++ ions, which are essential for cell functioning but also poisonous at high concentrations. During aerobic exponential growth, iron-using enzymes in E. coli utilize around Fe atoms per cell generation, but more than Fe++ ions in free or loosely-bound form is poisonous [7, 8]. Thus, the cell faces the problem of maintaining a huge flux of Fe through a small reservoir, and at the same time channeling this flux into its most essential functions when the cell is starved of iron: It needs to prioritize and sort the usage of a limited resource.
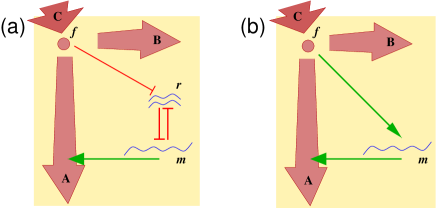
Reference [9] describes a detailed model of the Fe regulation in E. coli, which incorporates several feedback mechanisms that together secure the system against both up and down shifts of the iron level. In this paper, we focus on the prioritization of the usage of iron by the sRNA regulation and its role in sudden iron depletion. The model in [9] is simplified into a core “motif” (Figure 1a) describing the negative feedback used in iron homeostasis. The motif consists of three variables, the iron-activated Fur (Ferric uptake regulator) protein complex that senses the Fe++ level, , the sRNA RyhB, and , the mRNA of iron-using proteins. The sRNA works by binding strongly to the mRNA, after which this entire complex is rapidly degraded [10, 11, 12]. The sRNA is in turn transcriptionally repressed by . Thus, effectively activates , through a double negative link via the sRNA.
Interestingly, the regulation of iron homeostasis in the bacterium Helicobacter pylori differs from that of E. coli in one important respect: the regulation via the sRNA RyhB is replaced by a direct transcriptional activation of the mRNA by (see Figure 1b) [13, 14]. These two bacteria motivate us to compare the “sRNA motif” with the corresponding “transcription motif”.
By studying these motifs, we demonstrate the following interesting aspects of sRNA regulation: (i) both motifs can be adjusted to have similar response times, but the metabolic cost is different for the two motifs. (ii) a single type of sRNA can efficiently prioritize expression level of various downstream target mRNAs, thus prioritizing the usage of a limiting resource. We also discuss possible experiments to test these results.
2 The Two Motifs
2.1 sRNA motif
In the motif of Figure 1a we focus on the case where sRNA binds to mRNA and both RNAs in the complex are degraded. In terms of an effective rate constant for the overall degradation, , the dynamics of the concentrations of the sRNA () and its target mRNA () can be described by
| (1) | |||||
| (2) |
where and set the respective production rates, and and define the background degradation times. We next rescale the parameters by measuring concentrations in units of and measuring time in units of 111The equation are formally rescaled by replacing , and . Thereby, a unit of time corresponds to the degradation time of the sRNA, and the unit of production rates corresponds to the production rate of the target mRNA..
To these rescaled equations we also add an equation for , a small-molecule-activated transcription factor for the sRNA (as shown in Figure 1a). We simplify this two step reaction from to regulation by assuming that all bindings are first order, and by rescaling binding constants such that results in half-repression of the promoter of the sRNA gene. Including the import and consumption of in analogy to the Fe-Fur system[9], the full dynamics of the motif becomes:
| (5) | |||||
| (6) | |||||
| (7) |
Here the dimensionless mRNA degradation time , and the dimensionless degradation rate of the RNAs is related to the dimensionfull parameters as follows:
| (8) |
In the absence of , is degraded relatively slowly because unbound sRNA are quite stable in vivo [11]. This means that , which is our rescaled time unit in eqs. (5)-(7), is around min. In the absence of , is degraded with , the lifetime of RyhB target mRNA in E. coli from ref. [11].
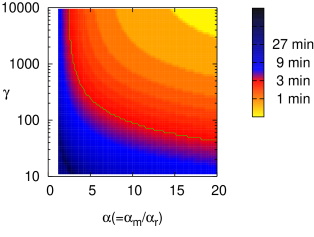
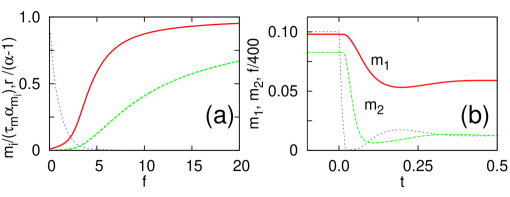
The most important parameters that determine the dynamics of sRNA regulation are and in eqs.(6) and (7). We can determine a reasonable range of values for these two parameters using experimental data. First, for the Fe-Fur system and are mutually constrained by the observation that the target mRNA, sodB, is depleted around 5-fold within 3 minutes after full induction of the RyhB promoter[11]. These 3 minutes include the time required for RyhB production, set by , plus the time for the produced RyhB to bind to sodB message and to degrade the complex, set by . For there will never be enough RyhB to deplete the message completely, whereas for slightly higher than 1 an extremely high is needed for efficient depletion.
Fig. 2 illustrates this. We simulate eqs. (6) and (7) to measure how long it takes for to be depleted 5-fold after fully-activating sRNA at by changing manually from to zero. The solid line in Fig. 2 shows values of and that give a 3 minutes depletion-time for sodB mRNA. With values in the range from 3 to 10, we see that physiological values would need to be between 100 and 10000. In addition, the reduction of iron consumption occurs as soon as the sRNA-mRNA complex is formed, even before the mRNA is degraded, but the measurement of [11] does not distinguish RNA species in complexes from the free form. Thus, the effective could be larger than the above estimate. The value of can be estimated from other data in ref. [11] of RyhB and sodB time series after induction and repression of RyhB. From these data, we estimate that is between 2 and 5. In the rest of the paper, we explore the small RNA motif for a range of and values, around the estimates made above.
2.2 Transcriptional motif
To model the transcription motif (Figure 1b) we replace (6) and (7) by the single equation:
| (9) |
The first term models the direct transcriptional activation of production by , where sets the maximum production rate of and sets the binding constant between and the DNA. The “Hill coefficient” sets the steepness of the response, and is related to the cooperativity in binding. We use the same values of the influx and two constants and in (5) as those used in the sRNA motif. We choose and in the transcription motif to have the identical steady state values of the and to the corresponding sRNA motif (parameterized by and ) for high iron () and low iron (). It is not obvious that this is possible for all values of and . In fact, we found that it is not possible for , but when , we can set and such that the above conditions are fulfilled for and . Therefore, henceforth we keep .
3 Results
3.1 Degradation times
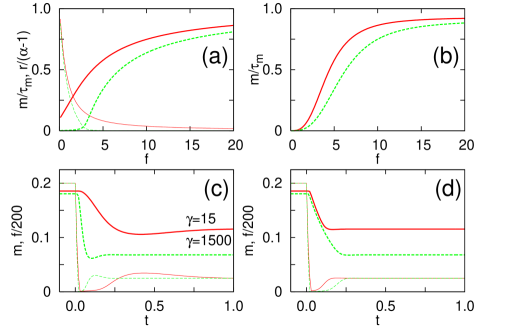
Figures 3a and b show how the steady state values of and depend on the steady state level, in the sRNA motif for two different values, and, respectively, in the corresponding transcription motif systems. For the sRNA motif, a larger results in a much larger ratio between maximum and minimum values, and a steeper drop between them (Figures 3a). This is expected because in the limit, , and this steepness in the sRNA regulation is referred to as “ultrasensitivity” in [4]. For the transcription motif, on the other hand, the dependence of on is weaker and nearly unaffected by the corresponding change in and (Figure 3b). This is because the steepness of the curve in the transcription motif is determined by the Hill coefficient , which is set to be relatively high value 3 but still not enough to give as sharp slope as the sRNA motif with .
The importance of is also evident in the dynamical response of the motifs to a sudden depletion in the external iron source (Figures 3c and d). For the sRNA motif, Figure 3c shows that a larger results in a faster drop in level, and a quicker approach to the new steady state level. The same is true for the level also. That is, a large naturally ensures a faster removal of all excess , while also allowing and to climb back to non-zero steady levels even after drops almost to zero during the initial shock. In contrast, the transcription motif displays approximately the same timescale of mRNA drop for the two corresponding cases because a drop in takes a time proportional to , independent of other parameters.
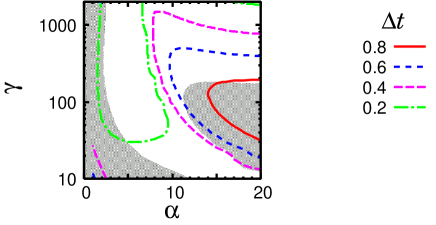
We investigate this further by quantifying the response time. Looking at Figure 3c, we see that the level drops very sharply and then rises towards its final steady state value. During this rise, at some time, , reaches within 95% of the final steady state value. We use as a measure of the response speed of the system. In Figure 4 we show a contour plot of for a range of values of and . The corresponding transcription motif systems show a faster response than the sRNA motif in the shaded region. The comparison indicates that sRNA based translational regulation produces a faster response than transcriptional regulation when (and is not too large compared to the investigated range of ) and is larger than a critical level, around 150 (the unshaded region in Figure 4).
3.2 Metabolic cost
The relatively slow response of the transcription motif is, of course, because its response timescale is set by , which we keep constant. We emphasize that it is possible to achieve a fast response in the transcription motif also by decreasing . There are some costs associated with this alternative strategy though. Faster mRNA turnover due to lower requires a higher production to maintain the same homeostatic levels of . At high levels, where mRNA is high, the sRNA motif secures a low degradation rate of mRNA, whereas the transcription motif produces the mRNA at its maximum rate. On the other hand, at low the sRNA motif maintains a high rate of mRNA degradation, while the transcription motif saves resources by reducing mRNA production. Therefore, for a given response speed to sudden iron starvation, the sRNA motif is less costly if the bacterium usually lives in iron-rich conditions, whereas the transcription motif is preferable if the organism mostly lives in iron-poor conditions.
3.3 sRNA prioritize downstream protein levels
3.3.1 Prioritization in the iron feedback motif
The properties of sRNA regulation can be used in an interesting way when more than one kind of mRNA is under regulation [12]. Different mRNA can have hugely different binding strengths to the regulating sRNA, and thereby very different effective degradation timescales. This is because the binding strength of the - complex is, to a first approximation, an exponential function of the number of matching base-pairs, which can vary by an order of magnitude across different mRNA: The free-energy gain per matching base-pair is around 1 to 2 kcal/mol, which can give the difference in statistical weight to 30. Because of this property, sRNA regulation could be used to prioritize the degradation of different mRNA. We illustrate this by adding a second mRNA to the sRNA motif:
| (10) | |||||
| (11) | |||||
| (12) |
For , we use (5), replacing by . The two mRNAs, and , have different effective degradation rates, and , resulting in different steady state levels for a given value. Other parameters are set as in the case with a single mRNA. Figure 5 shows the behavior of this system. The steady state level in Figure 5a shows that , the mRNA with larger , is suppressed more than on depletion of .
The prioritization behavior is easily understood by considering the extreme case where both s are very large but . Then, depending on the level of , the steady state is such that either (i) both mRNAs are near-zero, (ii) only is non-zero, (iii) both and are non-zero.
Taking into account finite values, the prioritization efficiency becomes, respectively,
-
(i)
and for small , i.e. ,
-
(ii)
and for intermediate , i.e. ,
-
(iii)
and for large , i.e. .
where the are some functions that are small and proportional to for small .
Case (ii) is what we refer to as the “prioritized state”, where only one of the mRNA (the one with smaller ) is present and the other’s level drops to near-zero. Clearly, the larger the difference between the values of the mRNAs, the better the prioritization; the order of magnitude difference in is important to have the clear prioritization. In addition, , the sRNA production rate, determines the range of for which the sRNA is affected, and a larger results in prioritization being effective for a wider range of .
In addition, the dynamics in Figure 5b shows that, when is suddenly dropped, the mRNA with a larger value is rapidly depleted while the other mRNA stays at a higher level. That is, the sRNA is not only able to prioritize the mRNA steady state levels, but is also able to remove the “unwanted” mRNA much quicker than the “wanted” mRNA .
3.3.2 Prioritization of multiple mRNAs
It is clear that the prioritization can be generalized to the case of more than two kinds of mRNAs regulated by a single type of sRNA. To illustrate this we ignore feedback through and consider the following general system with different types of mRNAs:
| (13) | |||||
| (14) |
Here, to focus on the prioritization, the production term of sRNA in (10) which contains feedback from iron concentration is replaced by a constant . We assume without loss of generality, and rescale all variables to be dimensionless such that and the degradation time of sRNA are unity.
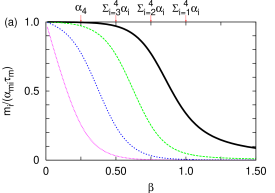
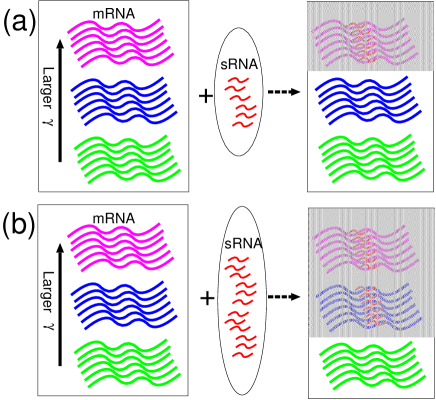
Figure 6a shows the normalized steady state level of mRNAs, , versus the production rate of the sRNA, . As becomes larger, sRNA increases and more mRNAs are degraded. As shown in Figure 6a, the -th mRNA with the largest is degraded first. This also “protects” other mRNAs from degradation because the sRNAs are also degraded together with the -th mRNAs. The ()-th mRNA starts to be degraded when the level of -th mRNA becomes low enough, which occurs roughly at . The ()-th mRNA starts to be degraded when , and so on, and finally all the mRNAs are almost completely degraded when . The separation of the level between the ()-th mRNA and the -th mRNA for becomes clearer for larger difference between and 222 In the case for any , the steady state level of mRNA for is estimated as follows: for , , and for . . This multistep-switch-like degradation upon changing the value of is the characteristic feature of the sRNA regulation. This prioritization mechanism is schematically presented in Figure 7, where the mRNAs are degraded in descending order of the value of .
We note that it is possible to have different steady state of mRNAs in the transcriptional motif also. Suppose is the concentration of the repressor with a production rate . Then the simplest model for the mRNA level is
| (15) | |||||
| (16) |
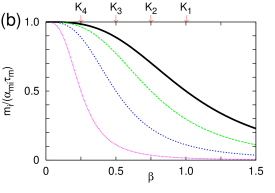
with a Hill coefficient and binding constants ; we assume without loss of generality. Here, the variables are rescaled to be dimensionless such that and the degradation time of are unity. The normalized steady state level is given by : The levels decrease as increases with the slope determined by the Hill coefficient , and the characteristic value of where the level becomes half of its maximum is given by . Figure 6b shows the separation of the steady state by transcription regulation with a relatively high value of the Hill coefficient and various values of . We see that the separation of the level is not as sharp as with sRNA regulation, and does not change much upon changing especially for large . The sRNA regulation is more effective in the sense that the prioritization of the mRNAs is sensitive to small changes in .
4 Discussion
Our analysis pinpoints three features that are particular to sRNA regulation in a feedback system. First, as sRNAs act through degradation, the regulation can, in principle, be very fast, generating a near instant response. Second, as the sRNA motif uses a double negative link, instead of a direct activation regulation, it has a higher metabolic cost for conditions where downstream targets are repressed. Third, and most interestingly, it has the capability of efficiently prioritizing the usage of downstream target genes.
It is essential for the prioritized expression of downstream targets that the sRNA as well as the mRNAs are degraded together after they form a complex. In the large limit, the effective prioritization occurs because the degradation of interferes with the degradation of by sequestering , leaving less unbound to bind . Indeed, if the sRNA simply catalyzed the degradation of the mRNAs without itself being degraded (i.e., no terms in (10) or (13)), the “protection” of is also lost. The degradation of different mRNAs doesn’t interfere as in the previous case, and thus the prioritization is less effective.
The switch-like behavior due to the “ultrasensitivity” of the sRNA regulation [4] together with the prioritization suggested in this work opens the possibility of more sophisticated regulation of gene expression. In particular, if each mRNA is targeted by several kinds of sRNAs, the combinatorics allows one to realize various logic gates. For example, if different kinds of sRNAs can bind to the same part of the targeted mRNA to trigger the regulation, it behaves as an “OR” gate. Such an example is known in V. cholerae, where four different sRNAs regulate HapR and any one of them is enough for regulation[4]. It is also, in principle, possible that one mRNA has multiple binding sites for different sRNAs 333 The authors do not know of an established example, but there exists an mRNA that has multiple binding sites for the same micro RNA in eukaryotic cells [15, 16]. In this case, if binding of all the sRNAs is necessary to trigger the regulation, it realizes an “AND” gate. The concentration dependent prioritization can add more complicated functions to the logic gates. It is an interesting future issue to explore the possibility of combinatoric regulation by sRNAs.
We have tested numerically that the results of this paper do not strongly depend on the specific form of (5) for . As long as in- and out-fluxes are large enough to allow a much faster response of than of , then is the rate-limiting factor. Another thing to note is that we assumed that the Hill coefficient for the repression of sRNA by is 1, though we introduced a Hill coefficient in the transcription motif to achieve the sharp contrast in at high and low . If we put a Hill coefficient in the sRNA motif by replacing the production term of with , the vs. curve becomes even steeper, which makes the response sharper.
5 Experimental tests
The suggested prioritization possibility for downstream mRNAs invites experimental tests. One key quantity of interest is the degradation parameter , which in fact sets the efficiency of the whole sRNA regulatory system. For large , the sRNA regulation works as a step function: when production of sRNA is larger than production of downstream targets, these are instantly removed. Therefore it is essential to measure degradation times of downstream targets under various expression levels of the sRNA. These degradation times are tightly coupled to the steady state level of downstream mRNA, and could therefore be obtained from bulk measurements, using for example microarrays for both RyhB and downstream targets. For a given (=sRNA) in the steady state, the downstream mRNA level is , and therefore the slope of versus gives .
An experimental test of the prioritization capability of the RyhB system is to consider homeostasis, and compare wild type with any mutant where the RyhB binding part of a downstream target gene is highly over-expressed. The over-expressed genes should be constructed such that they do not produce proteins that can bind Fe, and thereby indirectly influence the free/loosely bound Fe pool. For a given low level of external iron, the prioritized usage implies that for mutants where the over-expressed gene has small the expression levels of other genes would be almost the same as in wild type. For the remaining, there will be large changes associated to RyhB being depleted by the over-expressed gene with large . If the difference in between different target mRNA is of an order of magnitude, i.e., enough to have clear prioritization, the influence of the over-expressed gene should be quite sharp. Further, our prioritization scheme implies that as the external Fe is depleted further, the number of downstream genes which influence homeostasis should diminish monotonically.
6 Conclusion
Using the well characterized homeostatic response system for iron in bacteria, we analyzed the pros and cons of sRNA versus transcription regulation. The investigated negative feedback motif of Fe FeFur proteins Fe brings out the functional similarities and differences between the two alternative strategies of regulating downstream targets. For sufficiently high Hill coefficients, transcriptional regulation can reproduce the same steady state behavior as the sRNA regulation. Further, both regulations can in principle provide a fast response to sudden decreases in externally available iron. However, their functional capabilities differ in two important aspects.
-
•
First, adjusting parameters to obtain similar response times, the sRNA motif results in more turnover of target mRNAs in iron-poor conditions, whereas the transcription motif results in more turnover in iron-rich conditions.
-
•
Second, the sRNA allows a prioritization of expression level of downstream targets, thus efficiently regulating the usage of a limiting iron resource. At the same time, unwanted mRNA is degraded more rapidly. This observation fits with the fact that the transcription motif is found in H. pylori, a bacterium with a small genome and limited capacity for genome regulation, while E. coli, which has a larger genome and can benefit from fine tuning of mRNA levels, has an sRNA motif.
Our analysis suggests new ways to analyze other systems where
multiple sRNAs regulate a more complicated response, including for
example quorum sensing [4]. There, mutual binding inhibition
between the sRNAs and a central regulator (LuxR mRNA in V.
harveyi [4], HapR mRNA in V. cholerae [17],
and the translational regulator RsmA in Pseudomonas [18]),
may allow signals from adhesion and host factors to differentiate
the sRNAs and thereby their downstream targets. Overall, our
analysis suggests that sRNAs or micro RNAs
may allow a near-digital reorganization
of cellular composition, an observation which concurs with their
ubiquity in regulatory processes associated with development.
Appendix: Parameters in the flux equation
We set the parameters , and in eq. (3) using data on the uptake and usage of Fe in E. coli and H. pylori. These systems are characterized by a huge flux of free , where the fluxes , and are so large that the pool is replenished about 100 times per cell generation.
In more detail, the constant incoming flux, , is partitioned into two channels, A and B, that are motivated by the two separate ways of using iron in the Fe-Fur system. Flow through channel A is regulated, i.e., it can be reduced during iron-starvation, and is proportional to the mRNA level, but independent of when there is any substantial amount of in the system [9]444 When we simulate eq.(5), we used the form with to avoid the numerical difficulty due to the singularity at . This expression agrees with eq.(5) in the limit of . . In contrast, flow through channel B is proportional to . In the case of the full Fe-Fur system [9] the regulation of this flux by other proteins becomes important when extracellular iron increases suddenly, but here we focus on the regulation by sRNA and therefore keep flow through channel B unregulated. That is, our motif is designed to respond to depletion of . Our “minimal” motif cannot do without this B channel because removing it results in robust oscillations, for which there is no evidence in E. coli [5].
The parameters in (5) are set as follows [9]: For conditions where extracellular iron is plentiful, we demand that the internal Fe++ level is such that [9] in steady state, while at the same time the net in- and out-flux per cell generation is approximately 100 times larger, representing the fast turnover and high usage of Fe [5, 9]. In addition, we assume that the iron flux is equally partitioned between the A and B channels, because we found it best fulfills the homeostatic requirements in our full model [9]. These conditions set the value of two parameters (i.e. [9]) and . The value of is completely determined by the steady state level of , which depends on the parameters in the regulation part of the motif (i.e., and in the sRNA motif, or and in the transcription motif). For iron-starvation we demand that [9], keeping the value of and constant. This condition is achieved by reducing , reflecting the reduction in extracellular iron. The change needed to get is dependent on the values of the regulation part of the motif. Note that, for a given regulatory motif, the steady state value of is a unique function of the influx .
References
References
- [1] Gottesman S 2004 The small rna regulators of escherichia coli: roles and mechanisms. Annu. Rev. Microbiol., 58 303–328.
- [2] Farh K K, Grimson A, Jan C, Lewis B P, Johnston W K, Lim L P, Burge C B, and Bartel D P 2005 The widespread impact of mammalian micrornas on mRNA repression and evolution. Science, 310 1817–1821.
- [3] Jones-Rhoades M W, Bartel D P, and Bartel B 2006 Micrornas and their regulatory roles in plants. Annu. Rev. Plant Biol., 57 19–53.
- [4] Lenz D H, Mok K C, Lilley B N, Kulkarni R V, Wingreen N S, and Bassler B L 2004 The small rna chaperone Hfq and multiple small rnas control quorum sensing in Vibrio harveyi and Vibrio cholerae. Cell, 118 69–82.
- [5] Andrews S C, Robinson A K, and Rodriguez-Quinones F 2003 Bacterial iron homeostasis. FEMS Microbiol. Rev., 27 215–237.
- [6] Massé E and Arguin M 2005 Ironing out the problems: new mechanisms of iron homeostasis. Trends Biochem. Sci., 30 462–468.
- [7] Nunoshiba T, Obata F, Boss A C, Oikawa S, Mori T, Kawanishi S, and Yamamoto K 1999 Role of iron and superoxide for generation of hydroxyl radical, oxidative DNA lesions and mutagenesis in Escherichia coli. J. Biol. Chem., 274 34832–34837.
- [8] Keyer K and Imlay J A 1996 Superoxide accelerates dna damage by elevating free-iron levels. Proc. Natl. Acad. Sci. (USA), 93 13635–13640.
- [9] Semsey A, Andersson A M C, Krishna S, Jensen M H, Massé E, and Sneppen K 2006 Genetic regulation of fluxes: Iron homeostasis of escherichia coli,. Nucl. Acids Res., 34 4960–496.
- [10] Massé E and S. Gottesman S 2002 A small RNA regulates the expression of genes involved in iron metabolism in Escherichia coli. Proc. Natl. Acad. Sci. (USA), 99 4620–4625.
- [11] Massé E, Escorcia F E, and Gottesman S 2003 Coupled degradation of a small regulatory RNA and its mRNA targets in Escherichia coli. Genes Dev., 17 2374–2383.
- [12] Massé E, Vanderpool C K, and Gottesman S 2005 Effect of RyhB small RNA on global iron use in Escherichia coli. J. Bacteriol., 187 6962–6971.
- [13] Delany I, Spohn G, Rappuoli R, and Scarlato V 2001 The fur repressor controls transcription of iron-activated and -repressed genes in H. pylori. Mol. Microbiol., 42 1297–1309.
- [14] Danielli A, Roncarati D, Delany I, Chiini V, Rappuoli R, and Scarlato V 2006 In vivo dissection of the Helicobacter pylori Fur regulatory circuit by genome-wide location analysis. J. Bacteriol., 188 4654–4662.
- [15] Hobert O 2004 Common logic of transcription factor and microRNA action. Trends in Biochem. Sci., 29 462–468.
- [16] Chang S, Johnston Jr R J, Frokjaer-Jensen C, Lockery S, and Hobert O 2004 MicroRNAs act sequentially and asymmetrically to control chemosensory laterality in the nematode. Nature, 430 785–789.
- [17] Jobling M G and Holmes R K 1997 Characterization of hapR, a positive regulator of the Vibrio cholerae HA/protease gene hap, and its identification as a functional homologue of the Vibrio harveyi luxR gene. Mol. Microbiol., 26 1023–1034.
- [18] Pessi G, Williams F, Hindle Z, Heurlier K, Holden M T G, Cara M, Haas D, and Williams P 2001 Global posttranscriptional regulator RsmA modulates production of virulence determinants and N-acylhomoserine lactones in pseudomonas aeruginosa. J. Bacteriol., 183 6676–6683.