Attentional modulation in layer 4 of the visual cortex could be mediated by interneurons with complex receptive field characteristics
Abstract
Many neurons in the visual cortex are orientation-selective, increase their firing rate with contrast and are modulated by attention. What is the cortical circuit that underlies these computations? We examine how synchrony can be modulated by the excitability of interneurons, in a model layer 4 network displaying contrast-invariant orientation-tuning. We did not find parameter settings for which the standard ring model (Somers et al. (1995)), which contains only cells with simple receptive fields (RF), behaved appropriately. Only when interneurons with complex receptive fields were included, similar to those found recently in cat primary visual cortex (Hirsch et al. (2003)), did the network behave appropriately. A critical feature in the model was that complex interneurons projected to simple interneurons but the simple interneurons did not project back to them. The network was switched from the non-attended state to the attended state by increasing the depolarization of the complex interneurons. In addition to contrast-invariant orientation tuning, the model reproduced the following experimental results: (1) the gamma-frequency range coherence between the estimated local field potential (eLFP) and spike trains of excitatory cells was higher in the attended state than in the non-attended state, but the firing rates of the excitatory cells did not vary between states; (2) the gamma-frequency-range power in the eLFP increased with contrast. The model predicts that there are two populations of inhibitory cells, one with complex RF characteristics whose firing rate increases with attention and the other with simple RF characteristics whose firing rate decreases with attention.
keywords:
synchronization, noise, gamma oscillations1 Introduction
Inhibitory interneurons make up 15% to 20% of all cortical neurons and have been classified into distinct groups based on their morphology, the complement of calcium-binding proteins they express and their physiological properties (Markram et al., 2004). It is commonly thought that interneurons function primarily as a brake on recurrent excitation, thereby preventing epilepsy, but recent work suggests that they may also play a direct role in cortical information processing (Santhakumar and Soltesz, 2004; Echegoyen and Soltesz, 2005; Llinas et al., 2005). For instance, in the ring model (Ben-Yishai et al., 1995; Somers et al., 1995), orientation-selectivity emerges in part because inhibitory neurons sharpen the weakly orientation-tuned inputs that cortical neurons receive from the lateral geniculate nucleus (LGN), whereas recent models suggest that attention may be mediated by the synchrony of inhibitory neurons (Fries et al., 2001; Bichot et al., 2005; Tiesinga et al., 2005; Buia and Tiesinga, 2006). It is not clear whether both attention and sharpening of tuning are achieved by the same class of interneurons because it has not yet been possible to conclusively link the classification of interneurons to their function in the cortical circuit. We use computational models to investigate what types of interneurons are necessary for attentional modulation of orientation-selective neurons in layer 4 of the visual cortex. Our hypothesis is that spatial attention is mediated by a depolarization of interneurons, which in turn synchronize the cortical network (Buia and Tiesinga, 2006). In our simulations synchrony could not be modulated effectively in a ring model containing only simple inhibitory cells, whereas when the network included complex inhibitory cells projecting to simple inhibitory cells, synchrony could be modulated effectively. Evidence for complex and simple inhibitory cells was recently obtained in the visual cortex of the anesthetized cat using intracellular recordings (Hirsch et al., 2003). In addition, anatomical studies have revealed evidence for various kinds of complex-like inhibitory neurons projecting preferentially to other inhibitory neurons (Gonchar and Burkhalter, 1999, 2003) and receiving top-down inputs from other cortical areas or from neurons in the basal forebrain (Freund and Meskenaite, 1992).
The simulations presented here provide predictions for how the firing rates of two types of interneurons are differentially modulated with attention. This information is not only useful for the in vivo identification of interneuron type using multi-electrode recordings, it may also help to correlate their functional role with their anatomical and biochemical characteristics using intracellular recordings.
2 Methods
2.1 Cortical models
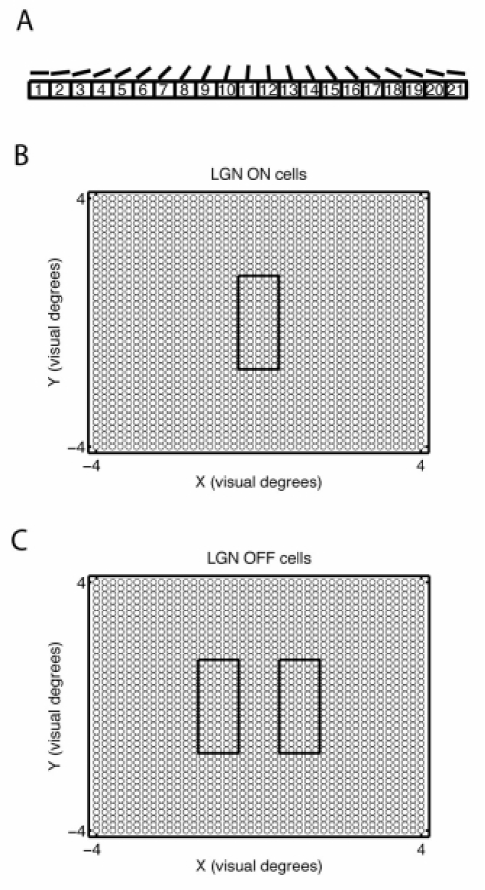
The ring model consisted of columns, each comprised of 21 inhibitory and 84 excitatory cells (total: 1764 excitatory cells, 441 inhibitory cells). These numbers are representative for a hypercolumn in cat visual cortex (Somers et al., 1995). The preferred orientation varied smoothly from column to column: for the th column it was (Figure 1A). Since the left-most column and the right-most column have similar orientation preferences, the model is referred to as a ring model. The LGN was represented using 1681 ON and 1681 OFF cells laid out on two overlapping 41 by 41 grids spanning 8 by 8 degrees of the visual field with a center to center spacing of 0.2 degrees in both the as well as the direction (Figure 1B and C). The grids of ON and OFF cells were fully overlapping. The LGN inputs to each cortical neuron came from 3 rectangular subfields, each 1 by 3 degrees in size, with their long axis oriented along the preferred orientation of the neuron (Figure 1B and C). The OFF, ON and OFF subfields were arranged from left to right with their long axes parallel and with a center-to-center distance of 1 degree. For each cortical neuron, an appropriate number (see Table 1) of LGN-OFF cells were randomly selected out of the area covered by the OFF subfield (Figure 1C) and were connected to the neuron. A similar procedure was applied to the LGN-ON cells, which were selected out of the ON subfield (Figure 1B).
| Type | |||||||
| () | (ms) | (ms) | (ms) | (rad) | (rad) | ||
| LGNE | 14 | 12 | 5 | 10 | 5 | – | – |
| LGNSI | 8 | 8 | 5 | 5 | 3 | – | – |
| EE | 6 | 36 | 5 | 3 | 1 | 0.1 | 0.7 |
| ESI | 3 | 56 | 5 | 3 | 1 | 0.1 | 0.7 |
| SIE | 12 | 24 | 10 | 3 | 1 | 1 | 1.5 |
| SISI | 5 | 8 | 10 | 3 | 1 | 1 | 1.5 |
The relative probability for a connection between a presynaptic neuron (preferred orientation: ) and a postsynaptic neuron (preferred orientation: ) depended on the difference between their preferred orientations, . Here for and for , is the orientation tuning width and stands for maximum range and is the orientation difference beyond which no connections are made. For each cortical neuron, an appropriate number of presynaptic neurons were chosen with relative probability and connected to the neuron. The values used for the model are summarized in Table 1.
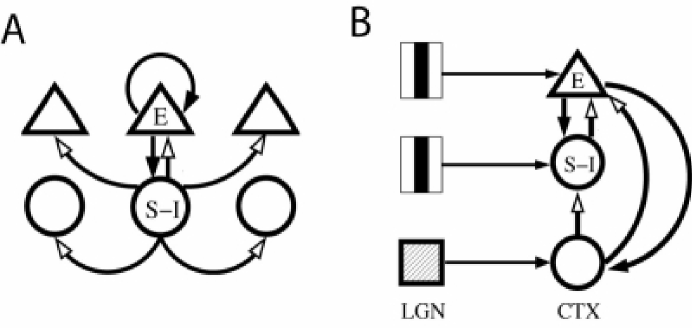
For the ’complex’ version of the model, referred to as the complex ring model, 11 inhibitory cells with complex RFs were added to each column. These cells were labeled by the preferred orientation of the column to which they were assigned. They received LGN inputs from ON and OFF cells in a 3 by 3 degrees area centered on the neuron’s receptive field center (Figure 2 B). The intracortical connections between complex and simple cells did not depend on the difference between the preferred orientation of the pre- and postsynaptic neuron (formally: and ). There was an asymmetry in the connection between inhibitory neurons with a simple receptive field (SI) and those with a complex receptive field (CI). Most inhibitory inputs to CI cells came from other CI cells, but a significant fraction of inhibitory inputs to SI cells came from CI cells (Table 2). The excitatory cells received inputs from both CI and SI cells.
| Type | ||||
|---|---|---|---|---|
| (rad) | (rad) | |||
| LGNE | 14 | 12 | – | – |
| LGNSI | 8 | 8 | – | – |
| LGNCI | 8 | 4 ON, 2 OFF | – | – |
| EE | 6 | 36 | 0.1 | 0.7 |
| ESI | 1 | 56 | 0.1 | 0.7 |
| ECI | 1 | 56 | ||
| SIE | 20 | 19.6 | 1 | 1.5 |
| CIE | 20 | 4.4 | ||
| SISI | 4 | 26.25 | 1 | 1.5 |
| SICI | 4 | 0.76 | ||
| CISI | 4 | 13.75 | ||
| CICI | 4 | 39.24 |
2.2 Calculation of LGN spike trains used as input to the cortical neurons.
The LGN cells were represented by non-separable spatiotemporal filters, which were defined in terms of a Gaussian spatial filter and an alpha-type temporal filter . Specifically, . Here and are defined with respect to the receptive field center of the LGN cell. Parameters values are , , , ms, ms and the delay between the surround and center response is ms. The firing rate of the ON cells is and for the OFF cells it is . In these expressions Hz is the baseline firing rate of thalamic neurons (Somers et al., 1995), is the linear contrast, a scaling factor between 0 and 1 (0 and 100%), is the stimulus waveform (see below), is the scalar filter output determined as a sum across space and a convolution in time, is a scaling factor such that is 50 Hz during the sustained part of the response to the vertical bar stimulus (see below), and denotes rectification. The spike trains for LGN neurons are obtained as a Poisson process with a time-varying rate given by or for ON and OFF cells, respectively. The filter is 64 ms long (sampling rate is 1 kHz), shifting the stimulus onset in the filtered temporal waveform by 32 ms. Hence, in combination with the 5 to 10 ms axonal conduction delay (see Table 1), stimulus-onset reached cortical neurons after a 40 ms delay.
2.3 Stimulus generation
The stimulus was represented as a spatio-temporal waveform , with a pixel value of zero representing the gray background. A vertical bar of 1 by 3 degrees was generated by setting the values of equal to one for , and during either a 300 ms long period starting at ms or 400ms, or a 600ms period starting at ms. We used a temporal resolution of 1 ms and a spatial resolution of for the stimulus matrix.
2.4 Neuron and synapse models
The neurons were represented by Hodgkin-Huxley-style models. For the inhibitory neuron, we used the model in (Wang and Buzsáki, 1996) and for the excitatory neuron, we used the model in (Golomb and Amitai, 1997; Golomb, 1998). The AMPA-type excitatory and fast GABA-type inhibitory synapses were also taken from (Golomb and Amitai, 1997; Golomb, 1998). The implementation details and equations for the cell and synapse model were given in a previous publication and are not repeated here (Buia and Tiesinga, 2005, 2006). The only single-neuron parameters varied during the course of the simulations reported here are the level of depolarizing current , and to the complex inhibitory, simple inhibitory and excitatory neurons, respectively, and for the excitatory cells, the maximum conductance (standard value 0.075) of slow potassium current responsible for adaptation (Golomb and Amitai, 1997; Golomb, 1998), and the decay time of the corresponding kinetic variable (standard value: ms). NMDA synapses were implemented according to (Golomb and Amitai, 1997; Golomb, 1998) with a time-scale of 149 ms. We fixed their unitary strength to 32% of the strength of the AMPA conductance.
2.5 Calculated quantities.
Spike times were determined as the times the voltage crossed 0 mV from below. The firing rate was the number of spikes produced during the stimulus period divided by its duration. The rates were averaged across all neurons of a given type (excitatory, simple inhibitory, complex inhibitory) in a column. A tuning curve was constructed by plotting this firing rate as a function of the preferred orientation of the column. We performed the same analysis on the synaptic inputs that a cortical neuron receives from LGN neurons and other cortical neurons.
For spectral analysis we used the multi taper routines implemented in the Chronux MATLAB toolbox (Mitra and Pesaran, 1999; Jarvis and Mitra, 2001). First, a spike time histogram was constructed for each neuron type by calculating the number of spikes in a 1 ms wide bin. Histograms were normalized by the number of neurons and the bin width in seconds, yielding the time-varying average firing rate expressed in Hz. The power spectrum density of the histograms was calculated using the Chronux routine with a spectral bandwidth , averaged over 5 tapers. In this routine, the length of the time series was increased to twice the next integer power of two by zero-padding. Two types of coherencies were calculated using the routine with the same parameter values as used for the power spectrum. The coherence between histograms of two different types of neurons was calculated. In addition, the coherence between the histogram of the complex inhibitory cells and the spike train of an excitatory neuron was determined and averaged across 100 spike trains randomly picked among the 1764 excitatory cells (we excluded spike trains with no spikes, since these led to division by zero errors).
3 Results
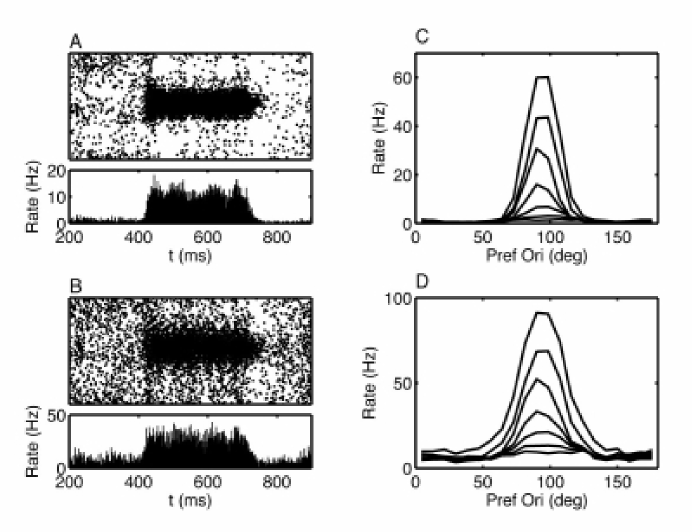
The standard ring model produced an orientation selective response. The rastergram and histogram for the excitatory and inhibitory cells are shown in Figure 3A and B, respectively. The mean firing rate of a column in response to a vertical bar is shown as a function, , of its preferred orientation (Figure 3C, D). Experimentally, an orientation tuning curve, , is obtained by presenting stimuli of different orientation to a single neuron with a specific preferred orientation. Because of the ring symmetry and the fact that here the firing rate of a neuron only depends on the absolute value of the difference between its preferred orientation and the stimulus orientation, these tuning functions are directly related to each other according to the mathematical identity . The tuning function for excitatory neurons was sharper (half width at half height (HWHH) was ) than that for inhibitory neurons (HWHH=). The tuning functions were approximately contrast-invariant. Contrast in the simulations is a linear scaling factor between zero and one, with zero yielding a baseline rate of 15 Hz for all the LGN cells, and one corresponding to the LGN-ON cells firing at 65 Hz in response to a 1 by 3 degrees bar covering their entire RF. This does not take into account the nonlinearity of the contrast response function of LGN neurons (Cheng et al., 1995). These nonlinearities can be accounted for by an appropriate scaling of the -coordinate in our graphs. However, plotting linear contrast makes it easier to distinguish the nonlinearity due to cortical dynamics from that due to the LGN input. Furthermore, the experimental LGN curves were obtained in response to gratings rather than the bars used here and thus may only be qualitatively correct.
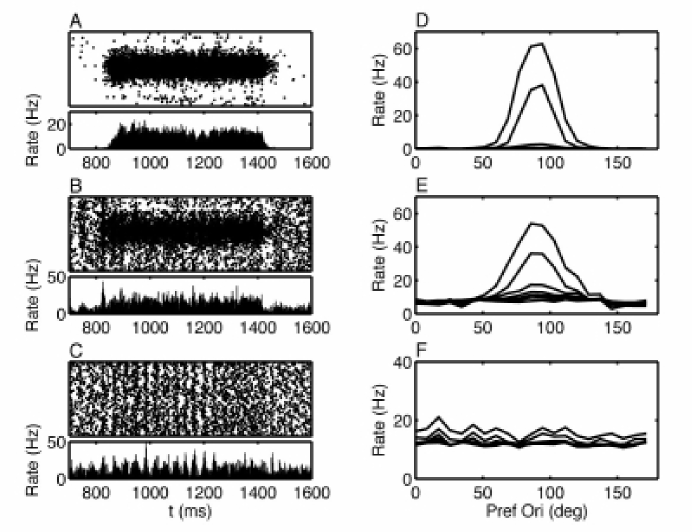
We added the complex inhibitory cells to the network without altering the strength of the recurrent excitatory connections. However, in order to obtain contrast-invariant orientation tuning it was necessary to change the other connections (compare Table 1 with 2). Briefly, the number of inhibitory synapses received by each inhibitory neuron was increased from 8 to 40, the total strength of recurrent inhibition was increased by a factor four, and the unitary strength of the excitatory synapse to inhibitory neurons was halved. The resulting network activity for the non-attended condition is shown in Figure 4. There were three obvious changes compared to Figure 3. First, the tuning was less sharp (Figure 4D, HWHH= for excitatory cells and for inhibitory cells). Second, the contrast sensitivity had decreased (Figure 4D), as responses above 10 Hz were only obtained for contrast values of 30% and higher, compared with 12% for the standard ring model. Third, the maximum rate of inhibitory neurons had decreased from 90 Hz to 50 Hz (Figure 4E). The complex cells were not orientation-selective and their firing rate varied only weakly with contrast (Figure 4F). For a 100% contrast stimulus (Figure 4C), the complex cells were weakly synchronized with an oscillation frequency of about 28 Hz. For lower contrast, the complex cells were not synchronized (see below and Figure 8). When the CI network is in the non-attended condition, an increase in the level of depolarizing current or in the amount of excitatory inputs will synchronize it (see (Tiesinga, 2004)).
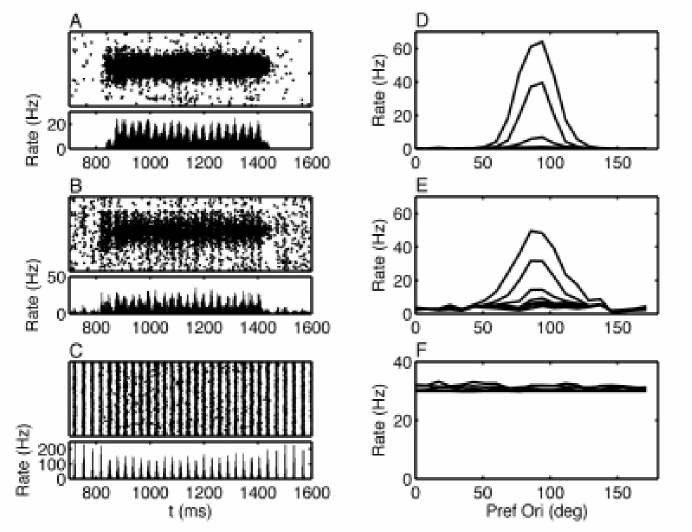
To mimic the effects of attention the depolarizing current to the CI cells was increased from to 0.9 (Figure 5). The CI neurons were synchronized in the prestimulus period and remained synchronized during the stimulus presentation (Figure 5C). In response to the oriented stimulus, the excitatory and simple inhibitory cells increased their rate and became synchronized. The orientation tuning functions (Figure 5D) were virtually identical to those in the non-attended condition (Figure 4D).
The effect of attention on the contrast response functions was determined for neurons whose preferred orientation matched the stimulus orientation (Figure 6A-C). For contrasts up to 48% (at a firing rate of 36.2 Hz), the firing rate of the excitatory cells increased nonlinearly with contrast (Figure 6A). For higher contrast, the rate of increase of the firing rate with contrast leveled off, yielding approximately 64 Hz at 100% contrast. Note that for even higher LGN firing rates, corresponding to contrast values larger than 100%, the firing rate still increased with contrast. The CRF in the attended condition is almost the same: the difference can be described as a small leftward shift of 5% with respect to the curve in the non-attended condition. The CRF of the SI cells was reduced in the attended condition compared with the non-attended condition (Figure 6B). The firing rate of the CI cells was only weakly contrast dependent but was significantly increased with attention (Figure 6C).
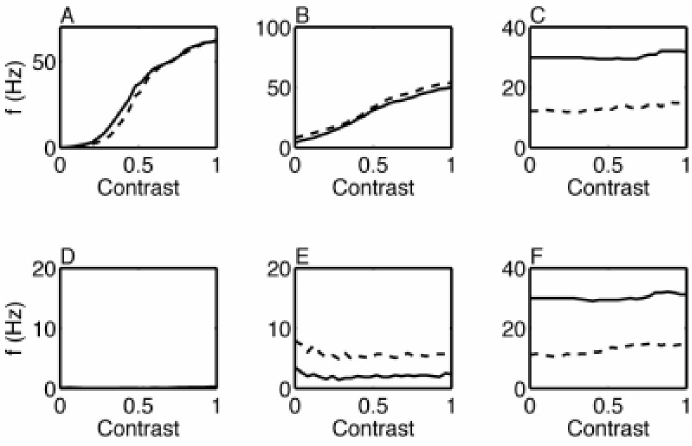
The excitatory firing rate was not altered by attention because of the balance between two effects. The increased firing rate of CI cells increases the amount of inhibition the excitatory cells receive directly from CIs, but it also decreases the firing rate of SI cells, which decreases the amount of SI inhibition to the excitatory cells. The overall effect is not straightforward because the degree of synchrony of the inhibitory inputs also varied, which by itself, even in the absence of any rate changes, could modulate the postsynaptic neuron’s firing rate (see (Tiesinga et al., 2005)). The precise balance depends on how much of the inhibitory input to the SI cells comes from the CI cells. For the present parameter setting, 34% comes from CI cells (Table 2). When the fraction of inputs coming from the CI cells was increased, the firing rate of the excitatory cells increased significantly with attention. This parameter setting may thus be more appropriate for cortical areas downstream of V1.
The nonlinearity present in the CRF for low contrast depends on the strength of recurrent excitation. For low contrast, the firing rate elicited in response to the stimulus grew over time, because of the recurrent excitation, to reach its maximum 100 ms or more after response onset. For this range of contrast values, the CRF increased steeply with contrast. For higher contrast, or a higher unitary strength of excitatory synapses, the firing rate reached its maximum value sooner in time. The leveling-off of the rate of increase of the CRF was associated with the firing rate reaching its maximum value shortly after response onset and a change in the dynamics of the interneurons. Specifically, in the attended state, the complex interneurons increased their firing rate and oscillation frequency but their precision was decreased (see below). In the non-attended state, the simple inhibitory cells increased their firing rate.
Figure 6D-F shows the CRF for neurons that prefer a horizontal orientation, which is orthogonal to the presented stimulus orientation. The excitatory cells did not fire for any value of the contrast (Figure 6D), whereas the simple inhibitory cells fired but their firing rate decreased as a function of contrast (Figure 6E). In the attended condition their CRF was shifted downward by approximately 4 Hz compared with the non-attended condition. The complex cells labeled as preferring horizontal behaved exactly the same as the ones shown in Figure 6C because they were not orientation selective.
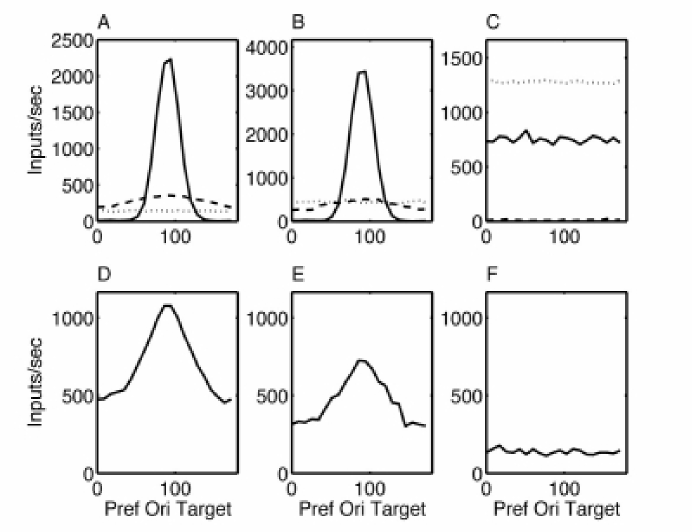
We studied the tuning of synaptic drives from the LGN, SI, CI and E populations by calculating for a given stimulus orientation the rate of inputs to a neuron as a function of its preferred orientation (Figure 7). Like the orientation tuning curves discussed before, these curves can be reinterpreted as the input rate to one specific column as a function of stimulus orientation. The excitatory neurons received moderately tuned input from the LGN (Figure 7D), sharply tuned input from other excitatory neurons (Figure 7A, solid line), and weakly tuned input from simple inhibitory cells (Figure 7A, dashed line). The input from complex inhibitory cells was not orientation-tuned (Figure 7A, dotted line). The simple inhibitory cells received similarly tuned inputs (Figure 7B and E), except that the rate of the LGN inputs was lower because fewer LGN neurons project to the interneurons (Table 2), whereas the rate of excitatory inputs was higher. The inhibitory inputs from complex cells dominated those coming from the simple inhibitory cells. None of the synaptic inputs to complex cells were orientation-tuned (Figure 7C and F).
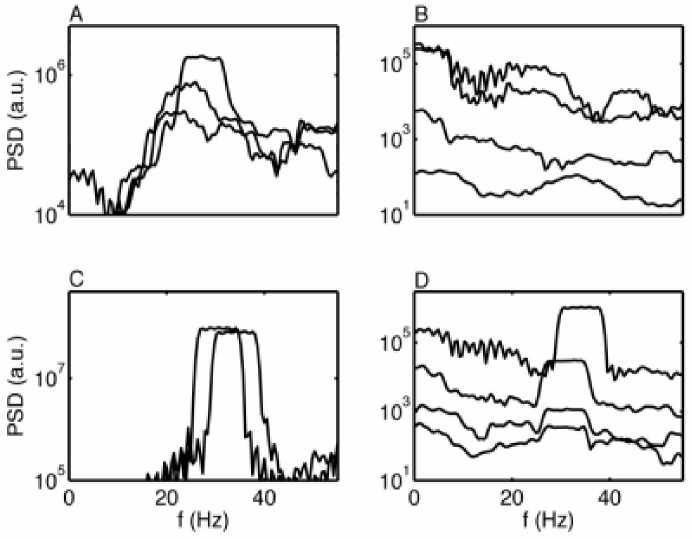
We estimated the temporal modulation of synchrony using a multi-taper spectrogram of the spike time histogram of the E, SI and CI populations. The LFP is hypothesized to reflect the synaptic currents to neurons in the neighborhood of the electrode (Liu and Newsome, 2006). Hence, when the spike time histograms for each population are filtered by the corresponding synaptic time constants and added together with the appropriate weights, they might behave similar to the LFP. We therefore refer to the (unfiltered) spike time histogram as the estimated LFP, eLFP for short. In the non-attended condition (Figure 8A), complex cells show power in the frequency range between 22 to 28 Hz which grows in amplitude and frequency as a function of contrast. The corresponding oscillations are only visible in the spike time histogram for the 100% contrast stimulus (Figure 4C). Power at this frequency was absent or barely detectable in the simple inhibitory and excitatory cells (Figure 8B). In the attended state (Figure 8C and D), the complex cells were synchronized during the entire period, including when there was no stimulus present. During stimulus presentation the synchrony was maintained, but for higher contrast the oscillation frequency increased whereas its power decreased slightly (Figure 8C). The simple inhibitory and excitatory cells followed the CI generated rhythm when they spiked, that is, during the stimulus period. The gamma-frequency range power in the eLFP thus increased with contrast (Figure 8D).
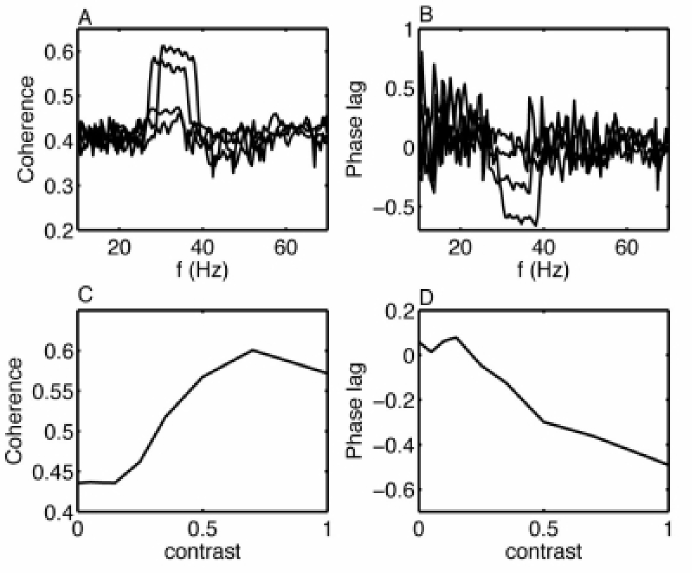
The coherence between the excitatory and inhibitory population was quantified using the multi-taper coherency (Mitra and Pesaran, 1999; Jarvis and Mitra, 2001). We calculated the coherencies between the spike time histograms (not shown) as well as between the excitatory spike trains and the eLFP of the CI cells (Figure 9). The latter measure is similar to the spike field coherence used in (Fries et al., 2001). The coherence is a complex quantity – its absolute value represents the strength of the coherence (Figure 9A and C) and its phase is proportional to the delay between the activity of the two populations (Figure 9B and D). During the stimulus period in the attended state, the coherence showed a clear peak for frequencies between 28 and 40 Hz (Figure 9A) with the CIs lagging the excitatory neurons, as is indicated by the negative phase (Figure 9B). The coherence grew with contrast, leveling off at 70% contrast (Figure 9C). Likewise, the phase lag increased, becoming more negative with contrast (Figure 9D). In the non-attended state, the level of coherence was not significant when tested at a p-value of 0.05. However, in the 22 to 32 Hz frequency range, there was coherence between the eLFPs of the excitatory and CI neurons (not shown).
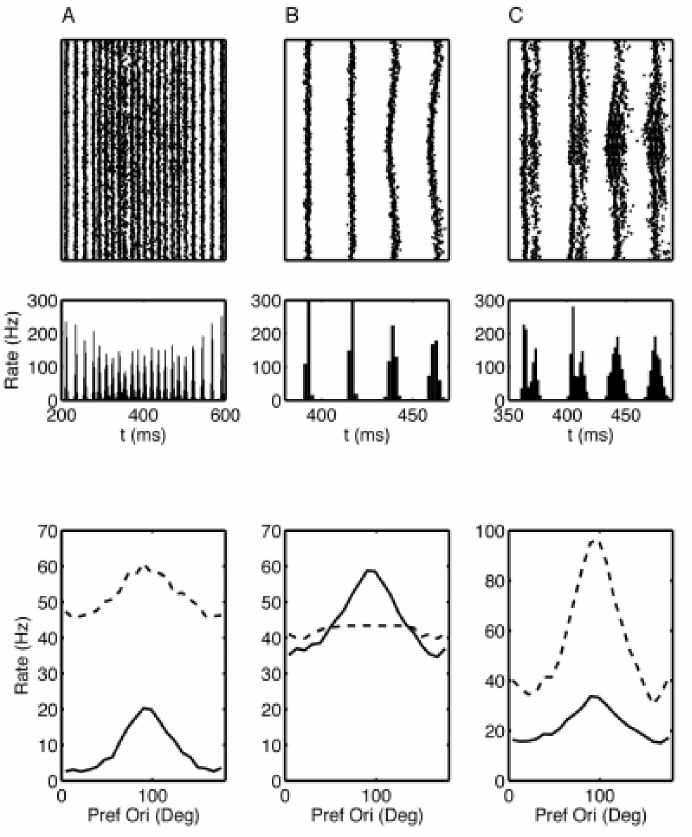
Is it possible to obtain synchrony modulation without adding complex cells to the network? Theoretical and computational studies have identified two different ways of obtaining synchronous oscillations in the gamma frequency range (Wang and Buzsáki, 1996; White et al., 1998; N, 2000; Tiesinga et al., 2001; Aradi and Soltesz, 2002; Bartos et al., 2002; Borgers and Kopell, 2003; Brunel and Wang, 2003; Hansel and Mato, 2003; Borgers and Kopell, 2005; Vida et al., 2006). In the first one, ”PING” (Borgers and Kopell, 2003), a synchronous volley of spikes from excitatory cells elicits a volley of spikes from the inhibitory cells, which shuts down the network for approximately a gamma period, 25 ms, after which the cycle starts anew. For this rhythm to be stable, the inhibitory cells should not be able to spike before the synchronous excitatory volley arrives (Borgers and Kopell, 2005). In the network studied here, excitatory and inhibitory cells are both driven by almost simultaneous LGN inputs that can make them spike even without intracortical excitation, suggesting that the PING mechanism might not be effective in this network architecture. In the second one, ”ING”, the inhibitory network synchronizes by way of mutual inhibition (Wang and Buzsáki, 1996). This rhythm requires about one hundred neurons and a high degree of interconnectedness (Wang and Buzsáki, 1996; Golomb and Hansel, 2000). Furthermore, it can only exist when the random background activity (noise) and the degree of heterogeneity (differences in intrinsic excitability) are small enough (Wang and Buzsáki, 1996; White et al., 1998; Tiesinga and José, 2000). It is the heterogeneity that posed the main problem in our explorations of the standard ring model. In Figure 7B and D the rates of intracortical and LGN inputs to interneurons are shown. The interneurons whose preferred orientation matched the stimulus orientation received much stronger inputs from the excitatory neurons and LGN neurons than did those whose preferred orientation was different from the stimulus orientation. The intracortical connections contributed more to the heterogeneity than the LGN inputs. We explored how far we could get, using only simple cells, towards our goal of finding a network that is synchronous in the prestimulus period and remains synchronous after the onset of the stimulus. The number of inhibitory cells was tripled to 63 per column and the number of inhibitory synapses onto each interneuron was increased to 128. Since the intracortical inputs caused the most heterogeneity, the intracortical connections were either made independent of the difference in orientation preference between the presynaptic cell and the postsynaptic cell or their unitary strength was reduced. In addition, the unitary strength of the thalamocortical synapses was reduced slightly. We found three ways in which the increase in heterogeneity associated with stimulus onset could be absorbed by the network without losing synchrony. First, the network could increase its oscillation frequency (Figure 10A). Second, it could decrease the latency of the interneurons whose preferred orientation matched that of the stimulus without changing the firing rate (Figure 10B). Third, it could increase the number of spikes the interneuron produces on each cycle without changing the oscillation (Figure 10C). The parameter settings are summarized in Table 3.
| E to E | E to I | I to E | I to I | |||
| () | () | () | () | () | () | |
| A | 2 | 20 | 5 | 3 | 0 | 2 |
| B | 1.2 | 1 | 2 | 3 | 1.1 | 2 |
| C | 2 | 20 | 5 | 3 | 0.7 | 0.5 |
In case 1 (Figure 10A), the interneurons received a large depolarizing drive and the mutual inhibition was strong. As a result, the interneurons could synchronize without strong LGN inputs. The intracortical connections were made untuned, that is, the connection probability did not depend on the difference in preferred orientation between the presynaptic neuron and the postsynaptic neuron. When the vertical bar came on, it increased the rate of the interneurons with a preferred orientation close to . These neurons led the oscillation, thus increasing its frequency. Because of the strong mutual inhibition the interneurons with preferred orientations farther from remained entrained to the sped-up rhythm, but they occasionally skipped a cycle. The modulation of interneuron firing rate with preferred orientation was weak: the dynamic range – the difference between the highest and lowest firing rate – was about 15 Hz. This modulation was on top of a high baseline rate of about 46 Hz. The dynamic range of the excitatory neurons was similar, around 18 Hz, with a baseline rate of 2.5 Hz.
For case 2 (Figure 10B), the interneurons still received a large depolarizing current, but now the excitatory neurons also received a depolarizing current. The intracortical connections were made orientation-selective again, but the strength of all intracortical connections was reduced except for the strength of the mutual inhibition, which was kept the same. For these parameters, the excitatory neurons fired at a high rate even before stimulus onset and the network was synchronized. When the vertical bar came on, it increased the firing rate of the excitatory neurons with an orientation preference close to . However, because the strength of the excitatory synapses on the interneurons was weak, the stimulus onset did not increase interneuron firing rate, rather it decreased the spiking latency of interneurons preferring vertical bars compared with those that preferred different orientations. The inhibitory cells were not orientation-selective in the classical sense since their firing rate did not change with stimulus orientation. The dynamic range of the excitatory neuron was similar to that in case 1, about 24 Hz, but it sat on top of a much higher baseline rate of 35 Hz.
For case 3 (Figure 10C), the depolarizing current to excitatory and inhibitory neurons was reduced. The unitary strength of the intracortical connections was returned to their values for case 1, but they remained orientation-selective as in case 2. Before stimulus onset, the excitatory and inhibitory neurons were synchronized with an oscillation frequency of about 25 Hz. The excitatory neurons fired one spike on each cycle and led the interneurons, which fired two spikes on each cycle. When the vertical bar stimulus came on, the interneurons with an orientation preference close to increased their firing rate and spiked three times on each cycle, whereas the interneurons preferring orthogonal orientations reduced their rate to about one spike per cycle. The oscillation frequency increased slightly to 28.6 Hz. The excitatory neurons preferring vertical stimuli also increased their firing rate, but they still spiked at most once on each oscillation cycle. The dynamic range of the interneurons was large, 66 Hz, on top of a baseline rate of about 31 Hz, whereas the excitatory neurons had a small dynamic range of about 19 Hz on top of a 15 Hz baseline.
The outcome of this exploration is that it is possible to modulate synchrony. However it is not possible, at the same time, to significantly sharpen the orientation tuning of cortical neurons compared with that of the LGN inputs by way of recurrent excitation and to have a large dynamic range of the firing rate.
4 Discussion
Multiple features of a visual stimulus are represented in the neural activity which it elicits in the visual pathway. These features include orientation, luminance contrast and whether the stimulus is in the focus of spatial attention. The most frequently used measure of neural activity is firing rate. Consider an orientation-selective neuron that has a baseline rate of 5 Hz, responds to a stimulus that matches its preferred orientation with 30 Hz if the stimulus is at 50% contrast and with 60 Hz if it is at 100% contrast. If a rate of 25 Hz is measured, what could the stimulus have been? It could have been a high contrast stimulus with an orientation different from the neuron’s preferred orientation, or a low contrast stimulus with the neuron’s preferred orientation, or a low contrast stimulus that was in the focus of attention. Or it could be that no stimulus was presented at all, but that the neuron’s baseline firing rate increased because of general arousal. How does the visual system disambiguate the different possible meanings of such a firing rate response? And, are the changes in activity due to stimulus identity, stimulus strength and the focus of attention generated by distinct circuitry? The answer to the first question is that the population activity must be used, with the identity of the neurons that are most strongly activated and the degree of coherence/correlation between them being the most significant aspect of the population activity. So far, electrophysiological recordings in non-human primates have only offered a glimpse of the richness of the population response. Nevertheless it has become clear that in the primary visual cortex of anesthetized macaque monkeys the LFP power in the gamma frequency range increases with contrast (Henrie and Shapley, 2005), whereas the gamma-frequency-band coherence between a neuron’s spike train and the LFP increases with attention (Fries et al., 2001; Bichot et al., 2005). Thus, stimulus strength and the focus of attention modulate neural correlations (Salinas and Sejnowski, 2001). There is no definite answer to the second question, primarily because there is a lack of models and experiments that have addressed the issue of how attention, contrast and stimulus identity interact. This study is our first attempt to resolve this issue.
Our goal was to determine how the effects of attention could be incorporated in a model that produces contrast-invariant orientation-selective responses. The model needed to reproduce the following observations. First, contrast-invariant orientation tuning curves should have a half width at half height between and (Gur et al., 2005). Second, the power of the local field potential (LFP) in the gamma-frequency should increase with contrast (Henrie and Shapley, 2005). Third, the width of the orientation curve should not change with attentional condition (McAdams and Maunsell, 1999). Fourth, attention should induce only small changes in the firing rate of neurons in responding to a simple stimulus (McAdams CJ, 2005). Fifth, attention should modulate the power of the LFP, as well as the coherence of spike trains with the LFP, in the gamma frequency range (Fries et al., 2001; Bichot et al., 2005; Taylor et al., 2005). We show that it is easiest to assume the existence of interneurons with complex receptive field characteristics, that are weakly or not at all orientation-selective and that show a modest increase in firing rate with contrast, but that are strongly modulated by attentional state. We have not conclusively shown that similar dynamics could not be achieved using only excitatory and inhibitory cells with simple receptive field characteristics, but so far we have not been successful in finding such a network that behaves appropriately. The reason for this is that the inhibitory neurons had to serve two functions. They needed to sharpen orientation-selectivity and they needed to synchronize. Synchrony develops in interneuron networks when (1) there are enough interneurons, about one hundred (Wang and Buzsaki, 1996), (2) they are well connected, about sixty synapses per neuron (Wang and Buzsáki, 1996), (3) the level of background activity, noise, is low enough (Tiesinga and José, 2000) and (4) the degree of heterogeneity is low enough (Wang and Buzsáki, 1996; White et al., 1998). Not only does the variability in intrinsic properties of neurons contribute to the heterogeneity, but the inhomogeneous activation of neurons also contributes because of their different preferred orientations. Our solution was to assign a different interneuron to each function. In experiments, two types of interneurons were found in layer 4 of cat primary visual cortex in approximately equal proportions (Hirsch et al., 2003). One had a simple receptive field and was orientation-selective, whereas the other had a complex receptive field and was not orientation-selective. In a recent model these complex interneurons were shown to be useful for contrast-invariant orientation tuning (Lauritzen and Miller, 2003). The question remains whether these complex interneurons also exist in layer 4 of primate visual cortex. The mechanism proposed here predicts that there is a pool of interneurons with complex RF characteristics that increases their rate with attention and another pool of interneurons with simple RFs that decreases their rate with attention.
We studied the behavior of the model in two operating regimes. In the first, the activity before stimulus onset was asynchronous, but the onset of a sufficiently high contrast stimulus led to weak synchronous oscillations in the spike time histogram of complex inhibitory cells. Hence, the gamma-frequency power in the eLFP associated with the CI cells increased with stimulus contrast, consistent with the previously mentioned experimental results (Henrie and Shapley, 2005). We propose that this parameter setting represents the non-attended state. In the second, the complex cell activity was synchronous before and also during stimulus presentation, but the oscillation frequency increased during the stimulus presentation when the contrast was high enough. The excitatory cells were also synchronized. Their rate was low for low contrast, but it increased with contrast. As a result, the coherence between excitatory activity and the eLFP (from CI cells) increased with contrast. We propose that this parameter setting represents the attended state. The network can be switched from the non-attended to attended state solely by increasing the drive to the complex interneurons. This drive could be supplied by various subcortical (Freund and Meskenaite, 1992) and cortical feedback projections (Gonchar and Burkhalter, 1999, 2003).
The preceding discussion has focused on the modulation of synchrony by attention. In cortical areas V2, V4 and MT, changes of firing rate with spatial attention have been reported (Luck et al., 1997; McAdams and Maunsell, 1999; Treue and Maunsell, 1999; Reynolds et al., 2000; Williford and Maunsell, 2006). In V1, no clear evidence for firing rate changes with attention have been found when using simple stimuli (McAdams CJ, 2005) (but see (Roelfsema et al., 2004; Khayat et al., 2006)). However, attention may cause changes in synchrony in V1, which could lead to firing rate increases downstream (Tiesinga, 2004). Hence, our parameter settings for the V1 model were chosen such that there was little change in the CRF of excitatory neurons whose preferred orientation matched the stimulus orientation. This was achieved by tuning the number of synapses from CI to SI cells such that the increase in inhibition from CI cells to the excitatory cells with attention was balanced by the decrease in inhibition from SI cells. An increase in excitatory activity with attention, as is observed in V4, can be obtained in this type of network by decreasing the fraction of synapses on SI neurons coming from CI cells.
We used the ring model to generate orientation selective neurons. The ring model has experimental support (Tsodyks et al., 1999; Kenet et al., 2003) and has been used previously in large-scale model simulations (Somers et al., 1995). There are alternative models, some of which require strong recurrent excitation and inhibition (McLaughlin et al., 2000; Marino et al., 2005), others of which are based primarily on the selectivity of thalamic inputs (Troyer et al., 1998; Ferster and Miller, 2000). The actual situation may lie between these two extreme cases (Monier et al., 2003; Teich and Qian, 2006). We have chosen the ring model as the first case to study, but it is of interest to determine how the considerations presented here apply to the alternative models.
Experiments with multi-electrode arrays in awake behaving primates are presently being conductedin a number of labs, making it possible to record from multiple neurons simultaneously during an attention-demanding task. The model can potentially be useful for these experiments since it predicts how the coherence between neurons changes with attention and contrast and how it depends on the difference in stimulus preference between the neurons.
Acknowledgements: This work was supported in part by start-up funds from the University of North Carolina at Chapel Hill and by the Human Frontier Science Program.
References
- Abbott et al. (1997) Abbott, L., Varela, J., Sen, K., Nelson, S., 1997. Synaptic depression and cortical gain control. Science 275, 220–224.
- Aradi and Soltesz (2002) Aradi, I., Soltesz, I., 2002. Modulation of network behaviour by changes in variance in interneuronal properties. J Physiol 538, 227–251.
- Bartos et al. (2002) Bartos, M., Vida, I., Frotscher, M., Meyer, A., Monyer, H., Geiger, J., Jonas, P., 2002. Fast synaptic inhibition promotes synchronized gamma oscillations in hippocampal interneuron networks. Proc Natl Acad Sci 99, 13222–13227.
- Ben-Yishai et al. (1995) Ben-Yishai, R., Bar-Or, R., Sompolinsky, H., 1995. Theory of orientation tuning in visual cortex. Proc Natl Acad Sci 92, 3844–3848.
- Bichot et al. (2005) Bichot, N., Rossi, A., Desimone, R., 2005. Parallel and serial neural mechanisms for visual search in macaque area v4. Science 308, 529.
- Borgers and Kopell (2003) Borgers, C., Kopell, N., 2003. Synchronization in networks of excitatory and inhibitory neurons with sparse random connectivity. Neural Comput 15, 509–538.
- Borgers and Kopell (2005) Borgers, C., Kopell, N., 2005. Effects of noisy drive on rhythms in networks of excitatory and inhibitory neurons. Neural Comput 17, 557–608.
- Brunel and Wang (2003) Brunel, N., Wang, X., 2003. What determines the frequency of fast network oscillations with irregular neural discharges? i. synaptic dynamics and excitation-inhibition balance. J Neurophys 90, 415–430.
- Buia and Tiesinga (2005) Buia, C., Tiesinga, P., 2005. Rapid temporal modulation of synchrony in cortical interneuron networks with synaptic plasticity. Neurocomputing 65, 809–815.
- Buia and Tiesinga (2006) Buia, C., Tiesinga, P., 2006. Attentional modulation of firing rate and synchrony in a model cortical network. J Comput Neurosci 20, 247–264.
- Cheng et al. (1995) Cheng, H., Chino, Y., Smith, E. r., Hamamoto, J., Yoshida, K., 1995. Transfer characteristics of x lgn neurons in cats reared with early discordant binocular vision. J Neurophysiol 74, 2558–2572.
- Echegoyen and Soltesz (2005) Echegoyen, J., Soltesz, I., 2005. Mini-i on epilepsy. focus on ”changes in mipscs and sipscs after kainate treatment: evidence for loss of inhibitory input to dentate granule cells and possible compensatory responses”. J Neurophysiol 94, 903–904.
- Ferster and Miller (2000) Ferster, D., Miller, K., 2000. Neural mechanisms of orientation selectivity in the visual cortex. Annu Rev Neurosci 23, 441–471.
- Freund and Meskenaite (1992) Freund, T., Meskenaite, V., 1992. Gamma-aminobutyric acid-containing basal forebrain neurons innervate inhibitory interneurons in the neocortex. Proc Natl Acad Sci 89, 738–742.
- Fries et al. (2001) Fries, P., Reynolds, J., Rorie, A., Desimone, R., 2001. Modulation of oscillatory neuronal synchronization by selective visual attention. Science 291, 1560–1563.
- Golomb (1998) Golomb, D., 1998. Model of neuronal transient synchrony during propagation of activity through neocortical circuitry. J. Neurophysiol. 79, 1–12.
- Golomb and Amitai (1997) Golomb, D., Amitai, Y., 1997. Propagating neuronal discharges in neocortical slices: Computational and experimental study. J. Neurophysiol 78, 1199–1211.
- Golomb and Hansel (2000) Golomb, D., Hansel, D., 2000. The number of synaptic inputs and the synchrony of large sparse neuronal networks. Neural Comput 12, 1095–1139.
- Gonchar and Burkhalter (1999) Gonchar, Y., Burkhalter, A., 1999. Connectivity of gabaergic calretinin-immunoreactive neurons in rat primary visual cortex. Cereb Cortex 9, 683–696.
- Gonchar and Burkhalter (2003) Gonchar, Y., Burkhalter, A., 2003. Distinct gabaergic targets of feedforward and feedback connections between lower and higher areas of rat visual cortex. J Neurosci 23, 10904–10912.
- Gur et al. (2005) Gur, M., Kagan, I., Snodderly, D., 2005. Orientation and direction selectivity of neurons in v1 of alert monkeys: functional relationships and laminar distributions. Cereb Cortex 15, 1207–1221.
- Hansel and Mato (2003) Hansel, D., Mato, G., 2003. Asynchronous states and the emergence of synchrony in large networks of interacting excitatory and inhibitory neurons. Neural Comput 15, 1–56.
- Henrie and Shapley (2005) Henrie, J., Shapley, R., 2005. Lfp power spectra in v1 cortex: the graded effect of stimulus contrast. J Neurophysiol 94, 479 – 490.
- Hirsch et al. (2003) Hirsch, J., Martinez, L., Pillai, C., Alonso, J., Wang, Q., FT, S., 2003. Functionally distinct inhibitory neurons at the first stage of visual cortical processing. Nat Neurosci 6, 1300–1308.
- Jarvis and Mitra (2001) Jarvis, M., Mitra, P., 2001. Sampling properties of the spectrum and coherency of sequences of action potentials. Neural Comput 13, 717–749.
- Kenet et al. (2003) Kenet, T., Bibitchkov, D., Tsodyks, M., Grinvald, A., Arieli, A., 2003. Spontaneously emerging cortical representations of visual attributes. Nature 425, 954–956.
- Khayat et al. (2006) Khayat, P., Spekreijse, H., Roelfsema, P., 2006. Attention lights up new object representations before the old ones fade away. J Neurosci 26, 138–142.
- Lauritzen and Miller (2003) Lauritzen, T., Miller, K., 2003. Different roles for simple-cell and complex-cell inhibition in v1. J Neurosci 23, 10201–10213.
- Liu and Newsome (2006) Liu, J., Newsome, W., 2006. Local field potential in cortical area mt: stimulus tuning and behavioral correlations. J Neurosci 26, 7779–7790.
- Llinas et al. (2005) Llinas, R., Urbano, F., Leznik, E., Ramirez, R., van Marle, H., 2005. Rhythmic and dysrhythmic thalamocortical dynamics: Gaba systems and the edge effect. Trends Neurosci 28, 325–333.
- Luck et al. (1997) Luck, S., Chelazzi, L., Hillyard, S., Desimone, R., 1997. Neural mechanisms of spatial selective attention in areas v1, v2, and v4 of macaque visual cortex. J Neurophys 77, 24–42.
- Marino et al. (2005) Marino, J., Schummers, J., Lyon, D., Schwabe, L., Beck, O., Wiesing, P., Obermayer, K., Sur, M., 2005. Invariant computations in local cortical networks with balanced excitation and inhibition. Nat Neurosci 8, 194–201.
- Markram et al. (2004) Markram, H., Toledo-Rodriguez, M., Wang, Y., Gupta, A., Silberberg, G., Wu, C., 2004. Interneurons of the neocortical inhibitory system. Nat Rev Neurosci 5, 793–807.
- McAdams and Maunsell (1999) McAdams, C., Maunsell, J., 1999. Effects of attention on orientation-tuning functions of single neurons in macaque cortical area v4. J Neurosci 19, 431–441.
- McAdams CJ (2005) McAdams CJ, R. R., 2005. Attention modulates the responses of simple cells in monkey primary visual cortex. J Neurosci 25, 11023–11033.
- McLaughlin et al. (2000) McLaughlin, D., Shapley, R., Shelley, M., Wielaard, D., 2000. A neuronal network model of macaque primary visual cortex (v1): orientation selectivity and dynamics in the input layer 4calpha. Proc Natl Acad Sci 97, 8087–8092.
- Mitra and Pesaran (1999) Mitra, P., Pesaran, B., 1999. Analysis of dynamic brain imaging data. Biophys J 76, 691–708.
- Monier et al. (2003) Monier, C., Chavane, F., Baudot, P., Graham, L., Fregnac, Y., 2003. Orientation and direction selectivity of synaptic inputs in visual cortical neurons: A diversity of combinations produces spike tuning. Neuron 37, 663–680.
- N (2000) N, B., 2000. Dynamics of sparsely connected networks of excitatory and inhibitory spiking neurons. J Comput Neurosci 8, 183–208.
- Reynolds et al. (2000) Reynolds, J., Pasternak, T., Desimone, R., 2000. Attention increases sensitivity of v4 neurons. Neuron 26, 703–714.
- Roelfsema et al. (2004) Roelfsema, P., Lamme, V., Spekreijse, H., 2004. Synchrony and covariation of firing rates in the primary visual cortex during contour grouping. Nat Neurosci 7, 982–991.
- Salinas and Sejnowski (2001) Salinas, E., Sejnowski, T., 2001. Correlated neuronal activity and the flow of neural information. Nat Rev Neurosci 2, 539–550.
- Santhakumar and Soltesz (2004) Santhakumar, V., Soltesz, I., 2004. Plasticity of interneuronal species diversity and parameter variance in neurological diseases. Trends Neurosci 27, 504–510.
- Somers et al. (1995) Somers, D., Nelson, S., Sur, M., 1995. An emergent model of orientation selectivity in cat visual cortical simple cells. J. Neurosci. 15, 5448–5465.
- Taylor et al. (2005) Taylor, K., Mandon, S., Freiwald, W., Kreiter, A., 2005. Coherent oscillatory activity in monkey area v4 predicts successful allocation of attention. Cereb Cortex 15, 1424–1437.
- Teich and Qian (2006) Teich, A., Qian, N., 2006. Comparison among some models of orientation selectivity. J Neurophysiol 96, 404–419.
- Tiesinga (2004) Tiesinga, P., 2004. Chaos-induced modulation of reliability boosts output firing rate in downstream cortical areas. Physical Review E 69, 031912.
- Tiesinga et al. (2001) Tiesinga, P., Fellous, J.-M., José, J., Sejnowski, T., 2001. Computational model of carbachol-induced delta, theta and gamma oscillations in the hippocampus. Hippocampus 11, 251–274.
- Tiesinga et al. (2005) Tiesinga, P., Fellous, J.-M., Salinas, E., José, J., Sejnowski, T., 2005. Inhibitory synchrony as a mechanism for attentional gain modulation. J Physiol (Paris) 98, 296–314.
- Tiesinga and José (2000) Tiesinga, P., José, J., 2000. Robust gamma oscillations in networks of inhibitory hippocampal interneurons. Network 11, 1–23.
- Treue and Maunsell (1999) Treue, S., Maunsell, J., 1999. Effects of attention on the processing of motion in macaque middle temporal and medial superior temporal visual cortical areas. J Neurosci 19, 7591–7602.
- Troyer et al. (1998) Troyer, T., Krukowski, A., Priebe, N., Miller, K., 1998. Contrast-invariant orientation tuning in cat visual cortex: thalamocortical input tuning and correlation-based intracortical connectivity. J Neurosci 18, 5908–5927.
- Tsodyks et al. (1999) Tsodyks, M., Kenet, T., Grinvald, A., Arieli, A., 1999. Linking spontaneous activity of single cortical neurons and the underlying functional architecture. Science 286, 1943–1946.
- Varela et al. (1997) Varela, J., Sen, K., Gibson, J., Fost, J., Abbott, L., Nelson, S., 1997. A quantitative description of short-term plasticity at excitatory synapses in layer 2/3 of rat primary visual cortex. J Neurosci 17, 7926–7940.
- Vida et al. (2006) Vida, I., Bartos, M., Jonas, P., 2006. Shunting inhibition improves robustness of gamma oscillations in hippocampal interneuron networks by homogenizing firing rates. Neuron 49, 107–117.
- Wang and Buzsáki (1996) Wang, X., Buzsáki, G., 1996. Gamma oscillation by synaptic inhibition in a hippocampal interneuronal network model. J. Neurosci. 16, 6402–6413.
- White et al. (1998) White, J., Chow, C., Ritt, J., Soto-Treviño C, Kopell, N., 1998. Synchronization and oscillatory dynamics in heterogeneous, mutually inhibited neurons. J Comput Neurosci 5, 5–16.
- Williford and Maunsell (2006) Williford, T., Maunsell, J., 2006. Effects of spatial attention on contrast response functions in macaque area v4. J Neurophysiol 96, 40–54.