A Physical Theory of the Competition that Allows HIV to Escape from the Immune System
Abstract
Competition within the immune system may degrade immune control of viral infections. We formalize the evolution that occurs in both HIV-1 and the immune system quasispecies. Inclusion of competition in the immune system leads to a novel balance between the immune response and HIV-1, in which the eventual outcome is HIV-1 escape rather than control. The analytical model reproduces the three stages of HIV-1 infection. We propose a vaccine regimen that may be able to reduce competition between T cells, potentially eliminating the third stage of HIV-1.
pacs:
87.10.+e, 87.15.Aa, 87.17.-d, 87.23.KgOur immune system is highly effective in suppressing most viral infections, due to the many different T cells that exist in the repertoire of one person. While many different T cells can recognize a virus, only those of highest affinity respond in large numbers and participate in eliminating the virus. One limitation of our immune system stems from the competition among T cells of similar specificity for the virus. For a series of discrete infections over time, competition in the immune system is associated with the phenomenon of deceptive imprinting Kohler et al. (1994), or original antigenic sin, and has been characterized by a random energy model Deem and Lee (2003). Original antigenic sin is the tendency for memory immune cells produced in response to a first viral infection to suppress the creation of new immune cells in response to a second infection with a related strain. Moreover, while they are used, these memory immune cells may not be optimal for control of this second, different viral strain. Another form of competition in the immune system occurs when several viral strains simultaneously infect one person. In this case, the T cells compete to recognize the different strains, and recognition of all strains may not be uniformly effective. This immunodominance of one strain over others means that the immune response to multiple infections is not a simple superposition of the responses to each individual infection Zhou and Deem (2006).
For a chronic infection with a mutating virus, the effects of competition are more subtle. Since the infection changes slowly over months or years, there may be no apparent original antigenic sin, as the immune system slowly updates itself in an attempt to clear the virus. If the virus evolves mainly through point mutation, the mutants will be only slightly different from their parents and can still be eliminated by the memory T cells. Moreover, whenever a sufficiently new viral strain emerges through the accumulation of point mutations that cannot immediately be cleared by the immune system, there is enough time for the immune system to create new T cells against the new strain since the infection is chronic. Therefore, competition might represent a relatively small weakness of the immune system against chronic infections. However, when facing HIV-1, any trivial weakness may become the immune system’s Achilles’ heel. A typical HIV-1 infection is characterized by three phases. See Fig. 1.
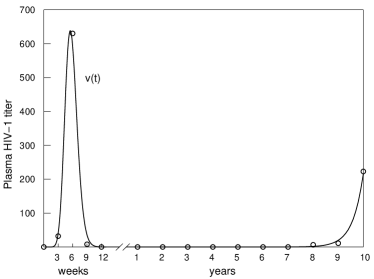
The viral load initially increases dramatically in the first viremia, followed by a sharp decline due to immunological control. Thereafter, a long period of clinical latency lasts for 6–10 years with small viral load. Finally, the HIV-1 viral load climbs up again in the final viremia, in the onset of AIDS. Most modeling works focus on the first viremia (e.g., Perelson (2002); Rouzine et al. (2006)). In Kamp and Bornholdt (2002), the second and third stages were modeled but without the first stage. The entire time course has been difficult to reproduce faithfully by a unified mathematical model, probably due to the disparate dynamics of the three phases. To describe each phase, a different set of parameters has been given. The three stage dynamics is reproduced by computational models in Hershberg et al. (2001); Zorzenon dos Santos and Coutinho (2001), but the mapping between parameters and physiology remains to be fully established in those models Strain and Levine (2002).
In this letter, we develop an analytical, physical theory of the immune response that explains HIV-1 pathogenesis. A key concept in the model is a population of viruses with different sequences that arise due to viral evolution, termed the viral quasispecies. Since HIV-1 and the immune system are well-matched competitors, the viral quasispecies and its dual, the lymphocyte quasispecies, should be equally well matched. These considerations lead to a theory with a large number of dynamical equations, which is reduced to a low dimensional model by symmetry. The model fits well with the standard HIV-1 data of the entire infection time course, and the parameters are all biologically reasonable. A novel equilibrium between the immune system and virus quasispecies is found, which, instead of fixing the viral load, favors viral escape.
We let () denote the HIV-1 quasispecies . We let denote the concentration, or load, of . We let denote the total viral load. We let denote the T cell, or effector T lymphocyte, that is specific for . We let denote the concentration of this T cell, and we let denote the total T cell concentration. We let denote the affinity between the T cell and the virus . As a fairly generic assumption, we take , where is the Hamming distance between and . Since roughly two amino acid substitutions still permit recognition, we expect to be on the order of . The () represent cross-reactivities, which are generally beneficial for the immune system because they offer additional killing. However, the side effect of cross-reactivity is that it induces competition when the T cells expand in concentration during the activation phase of the immune response.
We first hypothesize an ideal immune system that has the following properties: (i) There is no competition among the different T cells. This allows for the free development of effector T cells whose total concentration will reach its maximum capacity, . For a realistic system, we will find due to competition. (ii) There is no bias toward any viral quasispecies in generating its corresponding effector cells. Therefore one has . Since , one has .
The real immune system and the competition induced in the response to HIV-1 are modeled as follows. Compared to cytotoxic T cell lymphocytes (CTLs), antibodies are much less effective in controlling HIV-1. Therefore, we focus on the CTL responses, and a virus is accordingly identified by its epitope that stimulates CTLs. The epitope is 8–11 amino acids long, and in our model we assume . The initial strain of virus is denoted by . The assumption of an unique initial strain is based on the bottleneck effect Manrubia et al. (2005) and the reversion effect due to lack of CTL pressure at infection Kent et al. (2005). We assume that at each of the sites on the epitope there are possible amino acid substitutions. The quasispecies space size is thus . We use because each site can accept few substitutions to keep the virus viable. We find that the simulation results are not sensitive to . The subscript of is in the range and can be written in form of a -radix number , with . The Hamming distance between epitopes is , where is the Kronecker delta. The model is
| (1) | |||||
| (2) |
for , with the initial condition , and . Previous models have assumed linear suppression ( const) and not tracked both viral and T cell quasispecies evolution Perelson (2002).
In Eq. (1), is the replication rate of . The wild type replicates the fastest, and mutation away demands some fitness cost. The term is the rate of mutation of the amino acids at any one of the sites into any one of the other amino acids (per amino acid per day). The term thus represents mutation away from quasispecies to its neighbors (efflux). The term represents the reverse process (influx), where is the sum over all viral species a unit Hamming distance away from . The term represents the lysis ratio of targeted cells harboring , where The derivation of follows as in Park and Deem (2004) by treating the competitive binding process as a Langmuir adsorption isotherm of the CTLs onto targeted cells that are infected with . The concentration and affinity here are dimensionless, while in Park and Deem (2004) their physical values and are used. That is, . We let and denote the maximum values of concentration and affinity, respectively. We, thus, obtain . Typical concentrations are on the order of mol/l, typical binding constants are on the order of l/mol, and so we expect to be on the order of unity. Indeed, to fit clinical data, we will find . The coefficient is the rate of clearance of virus released from targeted cells that are being lysed, and to fit clinical data, we will find day-1, close to a previous estimation of 4.3 day-1 Nelson et al. (2001).
The first part of the right hand side of Eq. (2) represents a delay process with time constant , since the immune system always lags in response to viral changes. The term , which equals in an ideal immune system, now serves as the moving target for to catch. Moreover, the tracking of the virus by the immune system is disturbed by the competition , where represents competition from the other T cells. This term has been used in studying the competition within an ecosystem Bastolla et al. (2005). The T cells that develop into , must be stimulated by . However, since () can occupy , a delay in the maturation of the T cell precursors into can occur.
The number of non-linear equations in the model is , which is difficult for analysis and computation. However, there is apparent symmetry in these equations: and as long as . That is, all the viruses that have an identical distance to the wild type have the same dynamics and can be put into the same group. We let () denote the number of elements in the viral (CTL) group , one has and for any satisfying , where and . By substituting and into Eqs. (1, 2) and noting that , one obtains
| (3) | |||||
| (4) |
for , where . To obtain from , the following two steps are performed. The first step is to rearrange the equation for by summing up all the that have the same , namely to obtain . To be specific, let us consider with and a specific , must satisfy . To obtain a with and , some 0’s or 1’s in this expression for need to be changed, and the number of ways to realize this is , where corresponds to changing of the 0’s into non-0; corresponds to flipping of the 1’s into 0; corresponds to changing of the remaining 1’s into digits other than 0 and 1. The restrictions are and , from which one solves and . Therefore one obtains . The second step is to sum up all terms that have the same . That is, to obtain the matrix that is defined by . By substituting the expression of into the expression for one obtains .
The model parameters are determined as follows. The term is the mutation rate per amino acid site per day. The conventional HIV-1 mutation rate is per nucleotide base per replication Huang and Wooley (2005). Given that one replication cycle is about one day, one amino acid has 3 nucleotide bases, and about nucleotide mutations are nonsynonymous, one has per amino acid per day. The other parameter values are estimated by fitting the standard data given by Pantaleo et al. (1993). The viral load data is in terms of the plasma HIV-1 titer, which is two raised to the number of serial dilutions that result in undetectable virus. In the first viremia phase, the mutation has not yet taken significant effect, Eqs. (1,2) can be simplified as and . Since the CTL response peaks (i.e., approaching 1) at 9 to 12 weeks after the initial infection Abbas (2000), we calculate from that is 0.033 day-1. By noting that the first viremia peaks roughly at week 6 with plasma virus titer reaching 630 and declines by week 12, we find , day-1, , and . The fitting of the latency and the final viremia phases requires , , and . As discussed above, only and lack comparison to literature values.
Eqs. (3, 4) are still difficult for analysis because shows up in the denominator of Eq. (4). By summing Eq. (3) over , one obtains
| (5) |
By defining and plugging into Eq. (3), one obtains
| (6) | |||||
| (7) |
which are regular nonlinear ODEs. By integrating the above equations we find that and approach the fixed point , as early as day 600. The eigenvalues of the Jacobian matrix evaluated at the fixed point are all negative, indicating that the fixed point is stable. That is, an equilibrium has been reached between the HIV-1 quasispecies and the immune system T cell quasispecies. This result holds even as the viral load itself increases exponentially. All quasispecies escape at the same rate, with their relative proportions fixed. To calculate the rate of escape, Eq. (5) is converted into , where
| (8) |
Because the viral quasispecies converges, will eventually converge to a constant . Replacing by the fixed value , one obtains day-1. Because the equilibrium begins early, we conclude that the majority of latent phase, which was previously mysterious, follows the same simple dynamics as the final viremia phase. This result explains the observation Mellors et al. (1996) that the lifespan of HIV patients is inversely correlated with the minimum viral load that happens at about day 150 and is a direct result of the primary immune response. Because the onset time to the final phase scales as , the smallness of significantly amplifies the life span dependence on .
By incorporating immune competition, we now have a physical theory based upon an analytical model. Upon infection, the virus proliferates with a large rate around day-1, because the immune response has not been fully established. At about week 6, the immune system brings the virus down to a trace level. However, the ever increasing viral genetic diversity induces competition among CTLs, which degrades the quality of immune control. Both a viral and a T cell quasispecies are established. The concentrations of different CTLs become fixed, as well as the percentages of different viral quasispecies. However, the virus escapes exponentially. Interestingly, it is this underlying pair of quasispecies that drives the seemingly nonequilibrium process. While small, has become the Achilles’ heel of the immune system. Competition among T cells may exert a small influence for many diseases, but is fatal for HIV-1.
Our analysis predicts that competition among CTLs has a pivotal role on viral dynamics. The function is shown in Fig. 2.

One sees that as , or the level of competition, increases, the escape rate increases significantly. For the ideal immune system, and , suggesting that the ideal immune system can control HIV-1 infection. Even for the real immune system, the smallness of implies that HIV-1 and the immune system are well-matched competitors. When all antigens are simultaneously present, competition among T cells for activation and division occurs, and is large. By vaccinating to different lymph nodes with the different HIV antigens likely to occur, competition between T cells is reduced, and T cells that recognize each of the different antigens may be produced at high concentration Zhou and Deem (2006), and so . In this case the virus never rises again after week 12. The regimen should be designed such that its components are given according to the fixed viral quasispecies. According to our simulation, the final viral percentages other than and are negligible. As for sensitivity to the parameters, if or are increased, in which case the data of Fig. 1 are not fit so well, also becomes non-negligible. We thus propose a vaccine regimen that includes not only the wild type but also the quasispecies. This vaccine must be given before the eventual evolution of the quasispecies viral strains to avoid immunodominance. If the vaccine were given after evolution of the species, then competition would be unavoidable due to prior exposure of the immune system to the multiple viral strains.
References
- Kohler et al. (1994) H. Kohler, S. Muller, and P. L. Nara, Immunol. Today 15, 475 (1994).
- Deem and Lee (2003) M. W. Deem and H. Y. Lee, Phys. Rev. Lett. 91, 068101 (2003).
- Zhou and Deem (2006) H. Zhou and M. W. Deem, Vaccine 24, 2451 (2006).
- Pantaleo et al. (1993) G. Pantaleo, C. Graziosi, and A. Fauci, N. Eng. J. Med. 328, 327 (1993).
- Perelson (2002) A. S. Perelson, Nature Rev. Immunol. 2, 28 (2002).
- Rouzine et al. (2006) I. M. Rouzine, R. A. Sergeev, and A. I. Glushtsov, Proc. Natl. Acad. Sci. U.S.A. 103, 666 (2006).
- Kamp and Bornholdt (2002) C. Kamp and S. Bornholdt, Proc. R. Soc. Lond. B 269, 2035 (2002).
- Hershberg et al. (2001) U. Hershberg, Y. Louzoun, H. Atlan, and S. Soloman, Physica A 289, 178 (2001).
- Zorzenon dos Santos and Coutinho (2001) R. M. Zorzenon dos Santos and S. Coutinho, Phys. Rev. Lett. 87, 168102 (2001).
- Strain and Levine (2002) M. C. Strain and H. Levine, Phys. Rev. Lett. 89, 219805 (2002).
- Manrubia et al. (2005) S. C. Manrubia, C. Escarmis, E. Domingo, and E. Lazaro, Gene 347, 273 (2005).
- Kent et al. (2005) S. J. Kent, C. S. Fernandez, C. J. Dale, and M. P. Davenport, Trends Microbio. 13, 243 (2005).
- Park and Deem (2004) J. M. Park and M. W. Deem, Physica A 341, 455 (2004).
- Nelson et al. (2001) P. W. Nelson, J. E. Mittler, and A. S. Perelson, J. AIDS 26, 405 (2001).
- Bastolla et al. (2005) U. Bastolla, M. Lssig, S. C. Manrubia, and A. Valleriani, J. Theor. Biol. 235, 521 (2005).
- Huang and Wooley (2005) K. J. Huang and D. P. Wooley, J. Virol. Methods 124, 95 (2005).
- Abbas (2000) A. K. Abbas, Cellular and Molecular Immunology (W. B. Saunders Company, Philadelphia, 2000).
- Mellors et al. (1996) J. W. Mellors, C. R. R. Jr, P. Gupta, R. M. White, J. A. Todd, and L. A. Kingsley, Science 272, 1167 (1996).