An algorithm for real-time estimation of Mezcal fermentation parameters based on redox potential measurements
Abstract
We describe an algorithm for the continuous monitoring of the biomass and ethanol concentrations as well as the growth rate in the Mezcal fermentation process. The algorithm performs its task having available only the on-line measurements of the redox potential. The procedure combines an artificial neural network (ANN) that relates the redox potential to the ethanol and biomass concentrations with a nonlinear-observer-based algorithm that uses the ANN biomass estimations to infer the growth rate of this fermentation process. The results show that the redox potential is a valuable indicator of the metabolic activity of the microorganisms during the Mezcal fermentation. In addition, the estimated growth rate can be considered as a direct evidence of the presence of mixed culture growth in the process. Usually, mixtures of microorganisms could be intuitively clear in this kind of processes, however the total biomass data do not provide definite evidence by themselves. In this paper, the detailed design of the software sensor is presented, as well as its experimental application at the laboratory level.
Keywords: Mezcal; mixed cultures; software sensor; redox potential; growth rates
1 Introduction
Mezcal is a Mexican distilled spirit produced from the core of the Agave plant (the “piñas”). Several species are used for the Mezcal production, i.e., Agave salmiana, potatorum, angustifolia, tequilana, etc, and each produces a slightly different Mezcal. Therefore, the tequila can be considered a regional type of Mezcal, restricted to the usage of Agave tequilana as raw material [1]. It is important to mention that during this Mezcal fermentative process the syrup obtained from the juice of cooked “piñas” is left to naturally (spontaneously) ferment. By natural alcoholic fermentations we refer to the ones that start by themselves when a wide spectrum of different microorganisms starts fermenting. Therefore, the fermentation of Agave syrup into Mezcal is a complex biochemical process involving a whole realm of interactions between microorganisms.
During fermentation, the microorganisms employ sugars and other constituents of Agave syrup as substrate for their growth, converting them into ethanol, carbon dioxide, higher alcohols and their esters, and other metabolic compounds that contribute to the chemical composition and sensory qualities of the Mezcal [2]. We also notice that the qualitative and quantitative composition of the microbiota in fermenting musts could depend on the following factors: region of the Agave origin, production procedure, initial cell concentration, temperature, and ethanol concentration. As consequence, the organoleptic properties are also the result of the diversity and composition of microorganisms and their dynamics and frequency of occurrence. Consequently, this fermentative process is a vital stage in Mezcal making. Thus, it is very important to know more about the dynamics of the entire microflora during the alcoholic fermentation process. In other words, an algorithm that enables a monitoring process could be fundamental for a quality control that ensures, at least, homogeneity in the final product.
Nevertheless, a bottleneck in all biochemical monitoring process is often the lack of sensors for biological variables. Moreover, it is a well-known issue that in order to monitor many biotechnological processes, the problem of growth rates estimations represent a strategic feature. That is why several techniques have been developed to estimate on line the biological variables from the available measurements, which are usually dealing with physicochemical variables. Depending on the obtainable information about the process, there exist many possible types of estimators that can be used [3], [4], [5].
Previously, various attempts of relating the redox potential to fermentation processes have been made taking into account that redox potential assesses the growth ability of microorganisms, as well as the physiological activity in a given environments [6], [7], [8], [9]. Particularly, the practical significance of redox potential and oxygen content at various stages of winemaking was examined by [10]. Many chemical, enzymatic and biological processes in wine are correlated with the oxidative state of the wine.
Monod kinetics, which were originally derived from laboratory experiments with pure cultures and single substrates, are frequently applied to describe the behavior of undefined mixed cultures growing with single substrates or complex substrate mixtures [11], [12], [13]. In this case, the growth parameters that have been used represent overall values reflecting the growth constants of many different strains with respect to the multicomponent substrate and the frequencies and concentrations of both the different substrates and microbial strains. Nevertheless, it is well known from control processes that an accurate model leads to better control design and therefore to better closed-loop performance. There is recent progress shedding light on the dynamical processes underlying the growth of mixed culture in a mixture of substrates [14], [15]. However, under such complex situations, the accurate determination of the growth rates is still an open subject.
The work is organized as follows. Section 2 is devoted to a concise presentation of the fermentation experiment performed to illustrate our approach. The software sensor, which is a combination of an ANN and an adaptive observer scheme, is described in subsection 2.4. The results obtained by applying this software sensor to the Mezcal fermentation process together with a number of comments are included in Section 3. The paper ends up with the concluding remarks.
2 Materials and Methods
2.1 Microorganism and culture conditions
In order to evaluate experimentally the performance of the estimation algorithm, we performed six individual batch experiments using inocula of native microorganisms (without the addition of any commercial strain). The must (Agave syrup) was obtained from Agave salmiana, a species from the Mexican plateau (or altiplano) of the geographical region of San Luis Potosí. This must was centrifuged at and stored in a frozen state at prior to experiments.
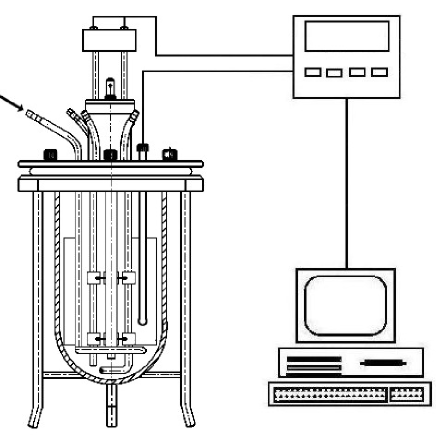
The batch fermentations were carried out in a bioreactor (Applikon, Schiedam, the Netherlands) of liter. The bioreactor is equipped with pH and redox sterilizable electrodes (Pt-Ring, Applisens, Sensor Innovation, Applikon). The electrodes are connected to a console for data acquisition (Bioexpert, Data Acquisition Control Program, Version 1.1x, Applicon), a device which is connected to a computer where the data are stored and computed.
The bioreactor was filled with of must as a culture medium, of the inoculum in its exponential growing phase (biomass ) and % of ammonium sulfate at final concentration. The initial conditions of the fermentation were settled at a temperature of and initial sugar concentration of . The pH does not show a dynamic evolution, maintaining itself at a value of during the whole process. For a schematic representation of the experimental setup and the data acquisition system see Fig. 1.
2.2 Analytical procedures and measurements
The batch processes have been monitored for hours, through sampling under sterile conditions. In order to quantify biomass and ethanol concentrations, samples of culture was removed every . The samples were cleared by centrifugation at for minutes at room temperature. The next step was to collect the supernatant phase and store it frozen at prior to be analyzed. The obtained pellet was resuspended in distilled water in order to proceed with the biomass analysis.
2.2.1 Biomass and ethanol quantification
The biomass measurements have been performed using (varian) UV spectroscopy at . The obtained values were interpolated with a standard curve of cell dry weight concentration.
For the determination of the ethanol, 1 of each sample with a final dilution 1:10 and 1 of 1-butanol in vortex motion for 5 and followed by centrifugation at 6000 for 5 . The organic phase was analyzed by gas chromatograpy (6890N Agilent technologies, Wilmington, DE) provided with a capilar column HP-Innowax ( i.d., film thickness; Agilent technologies, Wilmington, DE) and an auto-sampler (Agilent technologies, Wilmington, DE) with a split relation of .
The chromatographic conditions were for , increased at the rate of up to , and maintained at the latter temperature for . The carrier gas was helium at a flow rate of . The temperatures of the injector and flame ionization detector (FID) were set at and , respectively. The ethanol concentration of the samples was determined by means of a calibration curve of known standard solutions of ethanol.
2.3 Redox potential
The measurement of redox potential is relatively fast, accurate, and reliable and its values give an insight into the oxidation process as well as the inherent ability of reduction in the process, which is well established in the case of wine [10]. We mentioned that improvements in manufacturing processes and equipment have allowed beer, wine, as well as Mezcal producers to increase both the quantity and quality of these products. It is crucial for the commercial competition to maintain good quality control practices. Higher good-quality productions of the manufacturing plants require faster and more sophisticated analytical techniques to achieve them.
The measured values of the redox potential can give information on redox reactions in wine, which have an important influence on its quality and stability [10]. During storing and aging of wine, oxidation and reduction processes affect the character and taste of wine to a considerable extent [10], [9]. We surmise that the same features could occur in the case of the Mezcal making. Checking this assumption is one of the main goals of this research. In the case of tequila, there exist previous efforts to understand the relation of the organoleptic properties with the process stages [17], [18], [19], [20]. However, both for Tequila and Mezcal there is no previous report of an online-measured variable that allows its fermentation monitoring in real time.
The redox potential measurements were acquired periodically each during , and the data were stored and computed on-line in a PC (see Fig. 1).
2.4 The Software Sensor
By the software sensor we mean the algorithm generated by the coupling of the ANN and the adaptive observer. In this section we develop step by step this type of algorithm. First, we present the mathematical model that stays as the background of our approach. Then we explain the relationship with the measured output, the redox potential, and the ANN scheme. We end the section with a discussion of the adaptive scheme used to infer the growth rate function.
2.4.1 Mathematical model of the fermentation process
Batch microbial growth in a completely stirred bioreactor is commonly described by the following differential equations [3], [16]
where represent the total biomass concentration (), refers to the total substrate concentration () and is the product concentration () (ethanol in this case), represents the biomass yield, the product yield and is the growth rate. All the parameters that have been used represent overall values reflecting the many different strains with respect to the multicomponent substrate. It is important to note that the scheme here proposed do not need the values of or and is inferred by means of the software sensor.
2.4.2 Artificial neural network
In order to relate the redox measurements to the ethanol and biomass concentration an ANN procedure is applied. The methodology that we carried out includes a forward-propagation training algorithm for the ANN using some of our experimental data. In order to perform our task we construct a model of the following form:
| (1) |
where represents the redox potential measurement data (), is the set of biomass concentration data () and the function is approximated by means of the ANN procedure. The ANN architecture is of the standard type [22] with a single ANN hidden-layer containing 10 units. The same scheme was used for the case of the ethanol but using as the ANN model.
Each unit of this network uses a sigmoid function as the activation function. On the other hand, the output contains a linear activation function, in our case the identity. The feed-forward training algorithm considered here is the conjugate gradient method [23]. Three of the six individual batch experiments were used to provide data for the training process. The error given by the ANN after the training was as low as 0.0029.
2.4.3 The adaptive observer
The analysis of the adaptive observer scheme used here is based on the following realistic assumptions:
-
(A1)
The specific growth rate is positive and bounded, that is an unknown exists such that .
-
(A2)
There is no growth without substrate: .
-
(A3)
The time derivative of is bounded: , where .
2.4.4 On-line estimation of from measurements of
Since is available through the neural algorithm mentioned previously, we can now rewrite the output of the system as:
| (2) |
where is the set of on-line measurements of the system which is available indirectly through ANN means. Then, according to the discussion in [3], the following algorithm can be used to estimate :
where and represent the estimated value of and , respectively. The constants and must be chosen such that:
| (3) |
The above condition ensures the asymptotic convergence of the observer error to a neighborhood of zero ([3]).
3 Results and Discussion
In the previous section, the general idea as well as the detailed steps for the construction of the software sensor have been given. To complete the analysis of the approach, this section presents the experimental results obtained at the laboratory level at which the software sensor was tested.
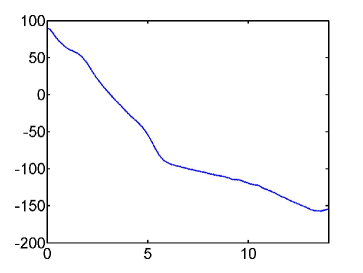
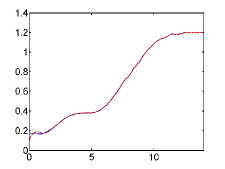
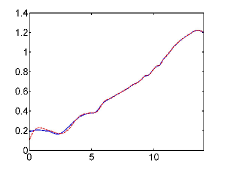
In total, six series of experiments of Mezcal fermentation at temperature of were performed. The temperature has been maintained constant using a heat exchanger device, see Fig. 1. First, we performed three experiments to generate the necessary biomass and ethanol concentration data for the training of the ANN. Once the error given by the ANN goes below the value of biomass units, the adaptive scheme was added to complete the software sensor procedure. Then, three more experiments were carried out for further testing the scheme. The results concerned with the performance of the ANN to infer the ethanol and biomass concentrations from the redox potential measurements are presented in Figs. 2 and 3, where one can appreciate the degree of accuracy of the algorithm. Notice that Fig. 3 presents several slope changes that do not allow a direct inference of the presence of a mixture of microorganisms during the fermentation process.
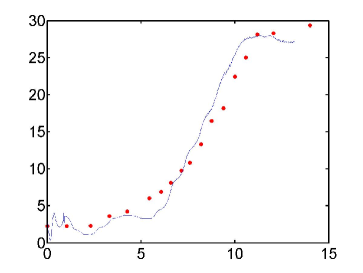
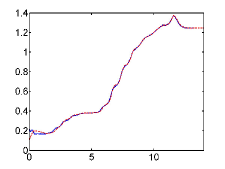
Although the main goal is to estimate , the biomass estimation is also performed, and the difference between this estimation and the value predicted by the ANN procedure is used as a correction term in the algorithm. Figure 4 shows the ability of the software sensor to rebuild the biomass concentration data. It should be highlighted that the simplicity associated with the implementation of this algorithm and the fact that a single measured signal, the redox potential, is needed are very promising features from the technological and industrial standpoints.
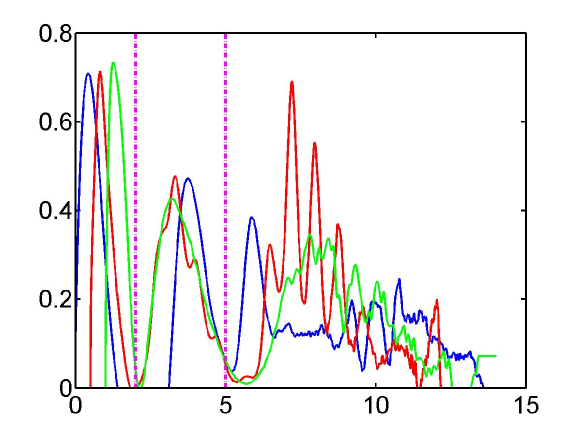
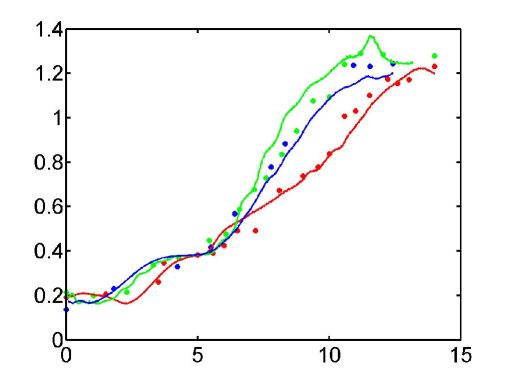
In Fig. 5, it is possible to distinguish three regions, labeled as , and . In general terms, in region one is not able to get any conclusion on the dynamical behavior of the process since during the corresponding time span the observer has a transient behavior. The span of time corresponding to region is given by the time that the observer takes up to minimize the error between its estimated biomass concentration and that given by the ANN procedure.
On the other hand, we associate regions and with the presence of two different groups of microorganisms, namely bacteria and yeasts. This assumption is based on the fact that the growth rate of bacteria is faster than that of yeasts. Thus, from Fig. 5, the presence of a mixed culture growth comes out naturally, a fact which is not so obvious when one examines only the biomass data given in Fig. 3. Note in addition that the end of the fermentation process is quite clear in Fig. 5.
4 Conclusions
In this work, we have shown that in the Mezcal fermentation process the redox potential can give relevant information on the metabolic activity of the involved microorganisms, including both ethanol and biomass concentration. Besides, the problem of estimating the specific growth rates in the Mezcal fermentation process has been addressed through a combination of a simple ANN procedure and a nonlinear observer algorithm. Moreover, the strategy presented here detects in a clear way the end of this fermentative process. The latter fact is quite relevant from the production point of view since it is the basic piece of information by which one can save time and avoid the degrading process due to the conversion of the ethanol into acetic acid. This leads to an improvement in the quality of the product. In addition, the computational scheme provides a very appropriate tool for a fast and reliable quality control and can be used to ensure the homogeneity of the final product. The methodology presented in this paper is general and can be also used in automatic control applications.
References
- [1] Cedeño M (1995) Tequila Production. Crit Rev Biotechnol 15: 1-11
- [2] De León-Rodríguez A, González-Hernández L, Barba de la Rosa AP, Escalante-Minakata P, López MG (2006) Characterization of volatile compounds of Mezcal, an ethnic alcoholic beverage obtained from Agave Salmiana. J Agric Food Chem 54: 1337-1341
- [3] Bastin G, Dochain D (1986) On-line estimation of microbial specific growth rates. Automatica 22(6): 705-709
- [4] Locher G, Sonnleitner B, Fiechter A (1992) On-line measurement in biotechnology: techniques. J Biotechnol 25: 23-53
- [5] Farza M, Busawon K, Hammouri H (1998) Simple nonlinear observers for on-line estimation of kinetic rates in bioreactors. Automatica 34(3): 301-318
- [6] Kwong SCW, Randers L, Govin R (1992) On-line assessment of metabolic activities based on culture redox potential and dissolved oxygen profiles during aerobic fermentation. Biotechnol Prog 8: 576-579
- [7] Berovič M (1999) Scale-up of citric acid fermentation by redox potential control. Biotech and Bioeng 64(5): 552-557
- [8] van Dijk C, Ebbenhorst-Selles T, Ruisch H, Stolle-Smits T, Schijvens E, van Deelen W, Boeriu C (2000) Product and redox potential analysis of Sauerkraut fermentation. J Agric Food Chem 48: 132-139
- [9] Cheraiti N, Guezenec S, Salmon JM (2005) Redox interactions between Saccharomyces cerevisiae and Saccharomyces uvarum in mixed culture under enological conditions. Appl Environmental Microbiol 71(1): 255-260
- [10] Kukec A, Berovič M, Čelan S, Wondra M (2002) The role of on-line redox potential measurement in Sauvignon blanc fermentation. Food Technol Biotechnol 40(1): 49-55
- [11] Novák L, Larrea L, Wanner J (1994). Estimation of maximum specific growth rate of heterotrophic and autotrophic biomass: a combined technique of mathematical modelling and batch cultivations. Water Sci Technol 30: 171-180
- [12] Wanner J (1994) Activated Sludge Bulking and Foaming Control. Technomic Publishing, Lancaster, Pennsylvania
- [13] Gujer W, Henze M, Mino T, Matsuo T, Wentzel MC, Marais GR (1995) The activated sludge model no. 2: biological phosphorus removal. Water Sci Technol 31: 1-11
- [14] Reeves GT, Narang A, Pilyugin SS (2004) Growth of mixed cultures on mixtures of substitutable substrates: the operating diagram for a structured model. J Theor Biol 226: 143-157
- [15] Ibarra-Junquera V, Escalante-Minakata P, Murguía JS, Rosu HC (2006) Inferring mixed-culture growth from total biomass data in a wavelet approach. Physica A 370(2): 777-792
- [16] Nielsen J, Villadsen J, Liden G (2003) Bioreaction engineering principles. Kluwer Academic, Plenum Publishers, New York
- [17] Benn SM, Peppard TL (1996) Characterization of tequila flavor by instrumental and sensory analysis. J Agric Food Chem 44: 557-556
- [18] López MG (1999) Tequila aroma. In: Shahidi F and Ho CT (eds) Flavor Chemistry of Ethnic Foods. Kluwer Academic, Plenum Publishers, New York
- [19] López MG, Dufour JP (2001) Tequilas: Charm analysis of blanco, reposado, and añejo tequilas. In: Leland JV, Schieberle P, Buettner A, Acree TE (eds) Chromatography-Olfactometry. The state of the art. ACS Symposium Series 782. American Chemical Society, Washington DC
- [20] Vallejo-Córdoba B, González-Córdoba AF, Estrada-Montoya MC (2004) Tequila volatile characterization and ethyl ester determination by solid phase microextraction gas chromatography/mass spectrometry analysis. J Agric Food Chem 52: 5567-5571
- [21] Lachenmeier DW, Sohnius EM, Attig R, López MG (2006) Quantification of selected volatile constituents and anions in Mexican Agave spirits (Tequila, Mezcal, Sotol, Bacanora). J Agric Food Chem 54: 3911-3915
- [22] Lapedes AS, Farber RM (1987) Nonlinear signal processing using neural networks: Prediction and system modeling. Los Alamos Report LA-UR-87, 2662
- [23] Rumelhart D, McClelland J (1986) Parallel distributed processing: explorations in microstructure of cognition, Vol. 1: foundations. MIT Press, Cambridge Massachusetts