DF/IST-5.2007
Model for Osteosarcoma-9 as a Potent Factor
in Cell Survival and Resistance to Apoptosis
Ekaterini Vourvouhaki1 ††thanks: E-mail: kvourvouhaki@pasteur.gr, Carla Carvalho2 ††thanks: E-mail: ccarvalho@ist.edu, Paulo Aguiar3 ††thanks: E-mail: paguiar@ibmc.up.pt
1 Hellenic Pasteur Institute, 127 Vasilissis Sofias Ave., 115 21 Athens
2 Departamento de Física, Instituto Superior Técnico, Av. Rovisco Pais, 1049–001 Lisbon
3 Instituto de Biologia Molecular Celular, Rua Campo Alegre 823, 4150–180 Porto
Abstract
In this paper we use a simple model to explore the function of the gene Osteosarcoma-9. We are in particular interested in understanding the role of this gene as a potent anti-apoptotic factor. The theoretical description is constrained by experimental data from induction of apoptosis in cells where OS-9 is overexpressed. The data available suggest that OS-9 promotes cell viability and confers resistance to apoptosis, potentially implicating OS-9 in the survival of cancer cells. Three different apoptosis-inducing mechanisms were tested and are here modeled. A more complex and realistic model is also discussed.
2Corresponding author.
E-mail: ccarvalho@ist.edu
Phone: +351 21 8419077
Fax: +351 21 8419013
I Introduction
Of the various Expressed Sequence Tags of unknown function which appear to be regulated when apoptosis is initiated 1 , one was identified as the gene Osteosarcoma-9 (OS-9 GI:580310), which is mapped to the chromosomal region 12q13-q15. This region is amplified in various human cancers, including sarcomas and osteosarcomas. The observation that none of the known genes in this region is amplified in all tested tumors suggests that other genes must exist that are commonly amplified in different cancer types. The functional analysis of the OS-9 gene is thus of interest for its potential anti-apoptotic role in the development of cancer.
However, little functional data exist for OS-9. The identified sequence homology of OS-9 to both nucleolin and protein tyrosine phosphatase 1B (PTP-1B) was found to entail no functional similarities 8 . Being driven from a TATA-less promoter 11 , however, suggests that OS-9 may be involved in cell-cycle regulated housekeeping or cell viability 8 . More recently, it was reported that OS-9 promotes oxygen-dependent degradation of hypoxia inducible factor (HIF-) via binding to both HIF-1 and the HIF prolyl hydroxylases archenemy1 . This is a surprising result since overexpression of HIF-1 is characteristic of most human cancer and inhibition of HIF-1 impairs tumor growth. A role for OS-9 in the control of tumor progression as a tumor-suppressor gene has also been advanced archenemy2 .
In Ref. os9 the first observational data set on a preliminary functional analysis of the product of the OS-9 gene was presented. The authors used overexpression of OS-9 isoform 2 cDNA in two murine FDC-P1 cell line populations, namely FDB-P1-17V (17V) and FDB-P1-17VIII (17VIII), and siRNA depletion of OS-9 specific mRNA in human umbilical vein endothelial cells (HUVEC) to study the role of OS-9 in induction of apoptosis by three mechanisms: interleukin 3 (IL-3) deprivation of IL-3-dependent murine myeloid cells il3 , staurosporine treatment staurosporine1 ; staurosporine2 and tumor necrosis factor (TNF) treatment tnfalpha . The data on the number of viable and apoptotic cells in the two OS-9-overexpressed cell line populations were obtained from trypan blue exclusion analysis and from fluoresence-activated cell sorter (FACS) analysis after treatment with Annexin V and propidium iodide (PI). From the comparison with the cell population having the vector confering the Haemagglutinin (HA) gene only (negative control), the data suggest the following results: 1) promotion of cell viability upon induction of apoptosis by withdrawal of IL-3; 2) promotion of cell resistance to apoptosis upon induction of apoptosis by addition of staurosporine and TNF 3) concentration dependence of resistance to apoptosis by addition of staurosporine; 4) resistance to apoptosis, with HUVEC’S precipitating to apoptosis upon blockage of the OS-9 function; 5) no effect on cell proliferation of any of the mechanisms.
This paper proposes a mechanistic model for the OS-9 functional data presented in Ref. os9 , thus giving theoretical support to the interpretation of the experimental results by E. Vourvouhaki et al. The model is general enough to avoid speculations about the particular dynamics associated with OS-9, but informative to the point of showing, in a quantitative manner, the impact of OS-9 in cell fate. In particular, such a model must reproduce induction of apoptosis upon treatment with an apoptotic agent or upon withdrawal of a vital agent, and explain resistance to apoptosis and cell viability as a consequence of OS-9 overexpression.
This paper is organized as follows. In section II we introduce the minimal model for the kinetics of a population of murine FDC-P1 cells with OS-9 overexpressed when subject to three different mechanisms for induction of apoptosis, namely withdrawal of IL-3, addition of staurosporine and addition of TNF We analyse the biological system as a sequence of biochemical interactions which we then formulate into a mechanistic model encompassed by a system of kinetical equations. In section III we optimize the parameters which describe the experimental results by fitting to the data the kinetical equations. For the optimal values for the parameters, the kinetical equations are expected to model the biological system within the observational errors and the limitations of a theoretical construct, as discussed in section IV.
II Model for OS-9 overexpression in apoptosis induction
In this section we analyse the biological system described by the experimental data in Ref. os9 as a sequence of biochemical interactions modeled by the overexpression of the OS-9 protein in two cell line populations of murine FDC-P1 cells, namely 17V and 17VIII. The level of OS-9 mRNA in 17VIII was confirmed by Real Time Polymerase Chain Reaction (PCR) to be approximately four times that of 17V os9 . Given the lack of knowledge on how the OS-9 protein acts in the cell, the entailed biochemical interactions are reduced to the simplest sensible functional form. In the biological system, we identify two competing effects, namely induction of apoptosis on the one hand, and on the other hand promotion of cell viability and resistance to apoptosis due to OS-9 overexpression.
Apoptosis is induced by the addition of an apoptotic agent, identified as or by the withdrawal of a vital agent to the survival of the cells, identified as . Here we describe induction of apoptosis by a decay rate of viable cells in the presence of an apoptotic agent or absence of a vital agent. These rate parameters are characteristic of the apoptotic mechanism and hence assumed to be dependent on the specific agent.
The cell response to apoptosis induction will depend on the induction mechanism. Thus, addition of an apoptotic agent will provoke the cell to resist apoptosis, in which case we will be assessing the OS-9 action in resistance to apoptosis. Conversely, withdrawal of a vital agent will challenge the cell to strive for survival, in which case we will be assessing the action of OS-9 in promoting cell viability.
These are the basic biochemical interactions which, together with the normal viable cell growth, must be contemplated by any model that attempts to describe the biological system being considered. We now proceed to formulate the simplest possible kinetical model containing just as many parameters as the data readily available allow us to constrain. An extension of such model for an arbitrary number of possible intermediary mechanical interceptions is presented as an illustration of the increased level of data required to constrain an increased level of interaction.
II.1 Kinetical Model
In our first attempt to model the OS9 role, we collapse the biochemical interactions into a minimal set of kinetical equations. This first-order approximation avoids speculation and allows us to concentrate on the effects of OS-9 overexpression on promotion of viability and resistance to apoptosis. In the simplest plausible model, we have three variables: viable cells apoptotic cells and dead cells The evolution in time of the number of cells in each of these cell stages is dependent on the reaction of the cell population to the absence of vital agent or on the interaction with the apoptotic agent , and on the subsequent cell response derived from an OS-9 overexpression.
The biochemical interactions can be analysed in fundamental phenomenological processes which we represent schematically by the following system of kinetical equations:
| (1) | |||||
| (2) | |||||
| (3) |
Here Eqn. (1) corresponds to cell proliferation, Eqn. (2) to apoptosis induction by either addition of an apoptotic agent or withdrawal of a vital agent and Eqn. (3) to cell death. The reactions will now be described in detail.
Viable cells grow at a rate The absence of any effect of the OS-9 overexpression on cell proliferation, as concluded from the DNA content analysis, implies that The effective cell growth, however, depends on the ratio of the number of viable cells to the carrying capacity . As a first approximation, we assume that the cells proliferate effectively at a rate . The choice of the linear functional form for the effective cell proliferation rate on the carrying capacity was motivated by the treatment of various aspects of cancer modeling discussed in References cbc ; mm .
Equation (2) describes the transition from viable cells to apoptotic cells induced by either addition of an apoptotic agent or removal of a vital agent . For both apoptosis induction processes we use the same expression for the conversion rate: The two parameters involved are used to segregate the effect of OS-9 overexpression. The parameter is a function of the OS-9 overexpresssion, ([OS-9]), and takes values in the interval . The parameter absorbs all other contributions to the conversion rate and depends on the specific agent leading to apoptosis. All experimental situations described in this paper use either one of these two induction processes; no experiment uses both. Although both apoptosis-inducing processes have the same rate expression, the interpretation given to the parameter is different. In the case of vital agent withdrawal, the parameter of Eqn. (2) measures promotion of cell viability modulated by the OS-9 overexpression. However, in the case of apoptotic agent addition, reflects resistance of a viable cell to becoming apoptotic. This process must thus take place upstream in the apoptotic signal pathway before the activation of the initiator caspases (caspase-8, -9 and -12) apoptosis .
Cell death, as expressed in Eqn. (3), progresses at a rate given by the expression As done previously, this expression segregates the dependence on OS-9 overexpression. The parameter is a function of the OS-9 overexpression, ([OS-9]), and takes values in the interval . Apoptotic cells will enter the final stage of apoptosis at a rate . Correspondingly, the parameter reflects resistance of an apoptotic cell to entering such stage characterized by the cell turning into an apoptotic body and eventually dying. This effect will take place downstream in the apoptotic signal pathway before the activation of the executioner caspases (caspase-3, -6 and -7) apoptosis .
It is important to emphasise the modulation produced by OS-9 overexpression in these reactions. This modulation is encapsulated in the parameters ([OS-9]) and ([OS-9]), which are such that where denotes the control (normal) expression and all other values reflect a contribution of OS-9 overexpression.
We now proceed to formulate the phenomenological model into a system of differential equations for the three variables. In the case of induced apoptosis by the addition of one apoptotic agent, the interaction can be broken down as follows: a) binding of to b) interception by the OS-9-codified protein of a signal pathway triggered from an effective binding; c) blocking of apoptosis induction in or blocking of necrosis induction in depending on the position in the signal pathway of the interception; d) survival or death of
For a contact rate molecules of the apoptotic agent will bind to a cell per unit time. If we assume that from each contact point a signal for apoptosis is always started, then will be the number of triggered apoptotic signals per unit time. Before starting the upstream apoptosis-inducing caspase chain reaction, apoptotic signals interact with a molecule of the OS-9-codified protein per unit time, resulting in the interruption of the signal pathway. The remaining signals will successfully induce apoptosis. In cells where apoptosis has already been triggered, and in the absence of OS-9 overexpression, the final stage of apoptosis is reached at a rate In the presence of OS-9 overexpression, however, for successful OS-9-led interruption of a downstream signal for necrosis, the final stage of apoptosis will instead be reached at Combining the reactions described above, we find that the variation in time of the number of viable cells is given by
| (4) |
Given the time scale of the experiment, cell decay is rendered negligible and thus unaccounted for. This is supported by the data recorded in the FACS diagrams in Ref. os9 , which suggest that necrosis is sourced by apoptosis rather than by decay. It follows that the number of apoptotic cells will vary in time as
| (5) |
and the number of dead cells as
| (6) |
This is an example of a quasispecies-type system cbc .
In the case of induced apoptosis by withdrawal of a vital agent, the interaction can be broken down in a similar way to the previous case, with the apoptosis signal now being driven through the mitochondria/cytochrome c pathway il3 . The induction of apoptosis can still be described by a decay mechanism of rate This means that apoptoptic signals are triggered per unit time in a cell subject to a vital agent-depleted medium. Of the total apoptotic signals generated, are intercepted by the OS-9 protein, which measures the rate of failure of apoptosis induction.
Both mechanisms discussed here are independent and each comprises either addition of an apoptotic agent or withdrawal of a vital agent. Consequently, we would expect that each highlights an independent function of OS-9, respectively promotion of viability or resistance to apoptosis.
II.2 Chemical Model
The model described in the previous subsection can be regarded as a black box model which acts on a given initial state to reproduce the observed final state in a OS-9-dependent way. If the detailed modus operandus of the OS-9 action in the cell was known, then the system would be approximated by a multiple little black box model, with smaller black boxes describing intermediate reactions triggered by intermediary apoptotic agents and constrained by intermediary initial and final known states. For one intermediary apoptotic agent, in the upstream pathway between the trigger of the exterior apoptotic agent on the membrane of the cell and the interception by the OS-9 protein which binds to the signal at the rate the variation in time of the number of viable cells will be given by
| (7) | |||||
| (8) |
for two intermediary upstream apoptotic agents, and with binding rates and respectively, we have that
| (9) | |||||
| (10) | |||||
| (11) |
and similarly for intermediary chemical agents upstream in the apoptic pathway
| (12) |
To account for the OS-9-modulated interception of the downstream signal pathway we must allow for intermediary downstream necrotic agents, binding to the OS-9 protein at rates It follows that
| (13) |
The role of each of these agents in the transmission of the apoptotic signal must be known and included in the dynamical system. To study the potential role of such a weakly known gene such as the OS-9, this model is therefore inadequate. As the logical extension of the kinetical model to a series of such smaller systems, this model could be applied to a multiple level interaction approach to biological systems with available multiple level data constraints ref . It might also provide further insight into some unexpected results obtained with the kinetical model. We hope to pursue this in the future.
III Experimental and Theoretical Results
In this section we proceed to use the system of first-order, coupled differential equations derived in the previous section to model the data reported in Ref. os9 . This system is used to model the two different apoptotic inducing mechanisms, namely addition of an apoptotic agent or withdrawal of a vital agent. In this paper we shall only use what we called the kinetic model. We want to solve for the time evolution of the number of viable cells and of apoptotic cells using the data in Ref. os9 to constrain the parameters and of the differential equations. In particular we are interested in the values for the parameters and which measure the contribution of the OS-9 overexpression in the system.
The data consist of the average of nine readings of the number of viable cells and the number of apoptotic cells obtained from trypan blue exclusion analysis and from FACS analysis after treatment with Annexin V and PI, all experiments having been performed three times and each in triplicate. The FACS analysis sorts cells that are 1) alive, 2) undergoing apoptosis, 3) undergoing necrosis and that are 4) in between apoptosis and necrosis, thus allowing to discriminate alive, apoptotic and dead cells. The trypan blue exclusion analysis simply separates dead from alive cells, lacking the sophistication and sensitivity to discriminate viable cells from apoptotic cells. In a modeling study that considers all three of the cell stages, the data from the typan blue exclusion analysis are inappropriate for use and hence will not be included here.
The solutions were determined numerically with mathematica (Wolfram Research). For the parameter estimation we implemented a sampling algorithm which calculates a cost function of a list of values for each parameter that we want to estimate. The cost function is defined as the sum of the square of differences between the experimental points and the corresponding points of the solution to the kinetical system. The minimum of the cost function line, or surface, defines the parameter value which optimally fits the experimental data. The precision of the method is defined by the density of points in the search space. The optimal values thus determined for all the parameters were then used to plot the solutions for and which we present in this paper. We applied the algorithm to both the average values and the corresponding maxima and minima encompassed by the error bars. For each data set, we obtained from three to eight estimates for (and depending on) each parameter by fitting the equations to the average and to the extreme data points. The parameters obtained from the average data points were combined to produce the induced average solution (represented by a continuous line); the parameters obtained from the extreme data points were combined to produce the maximum and minimum solutions (represented by dashed lines siding the continuous line), which reflect the propagation of the measurement errors and thus define the induced error interval of all possible curves capable of optimally fitting the data within the experimental errors. All the curves show percentages normalized to the initial number of viable cells,
From the experimental curves we can extrapolate the values for and adjusted to the system. Here we use and From the data on the HA-only marked (negative control) population we estimate the parameters which do not depend on the OS-9 overexpression, namely and We proceed to apply them to the OS-9-overexpressed cell line populations to estimate the parameters which measure the overexpression of OS-9, namely and The data analysis of each apoptosis-inducing mechanism is introduced by the interpretation advanced in Ref. os9 based on a qualitative reading of the experimental results, which we then confront with the interpretation of the quantified, data-constrained parameters of the model.
III.1 Withdrawal of IL-3 in FDC-P1 cells
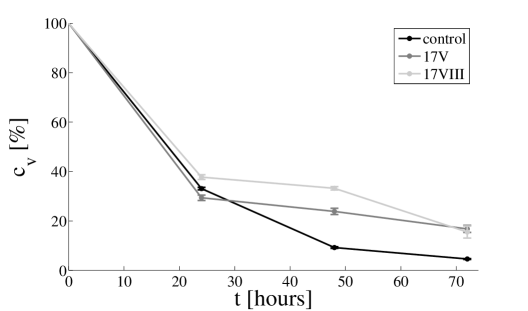
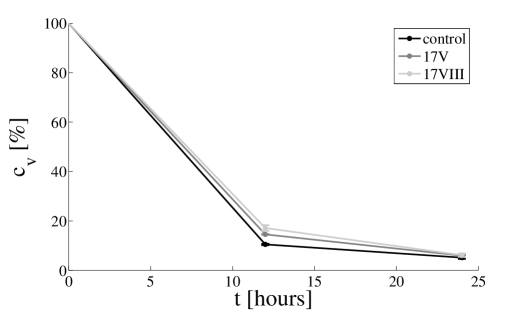
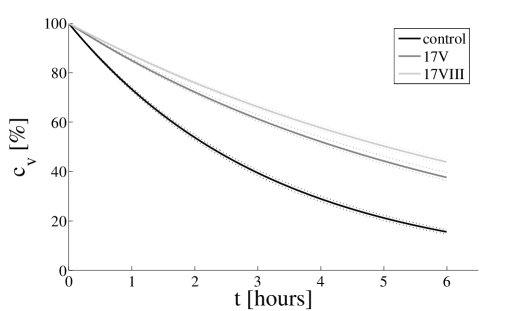
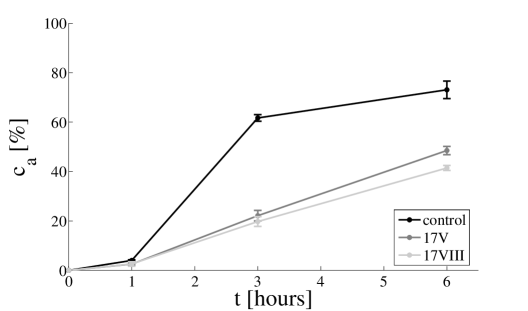
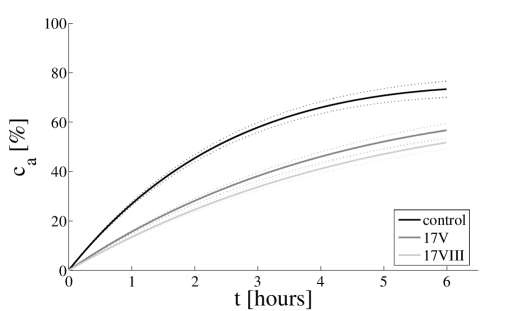
Here we analyse apoptosis induction by IL-3 deprivation of IL-3-dependent cells. The corresponding apoptotic mechanism is that of withdrawal of a vital agent and is described by the system of equations (4–6), with having the interpretation of OS-9 overexpression modulation in cell viability. The experimental results are collected in Figs. 2B and 2C of Ref. os9 , which we reproduce in Figs. 1(a) and 2(a) respectively.
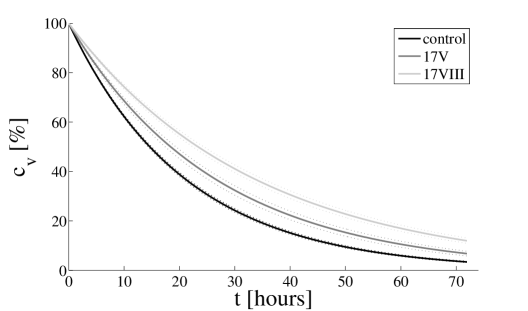
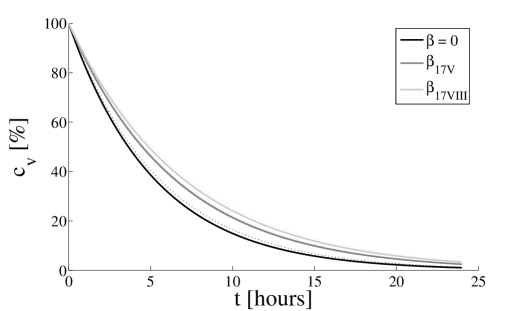
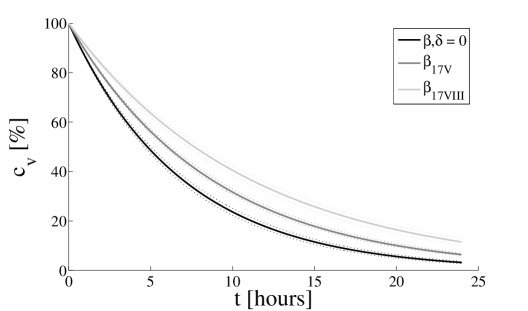
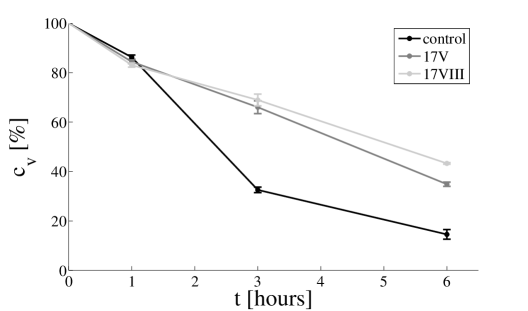
First we solve for given by Eqn. (4) and fit it to the number of viable cells shown in Fig. 1(a). In the absence of OS-9 overexpression this equation has only one free parameter, namely Setting we fit the solution to the curve for the number of viable cells in the HA-only marked cell population to find In the presence of OS-9 overexpression we have additionally the parameter to consider. We now use the results found for to fit to the experimental curve for the number of viable cells in the OS-9-overexpressed cell line populations and thus to find the corresponding We obtain and for the 17V and the 17VIII cell line populations respectively. The resulting plots are depicted in Fig. 1(b).
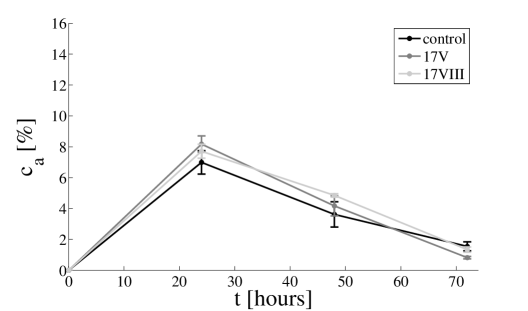
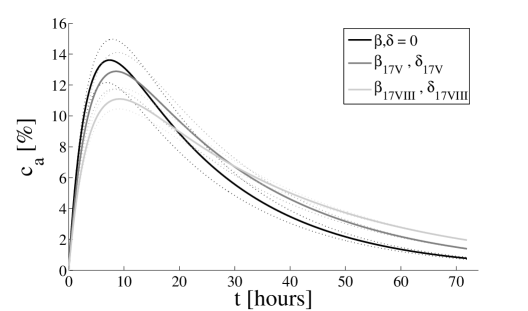
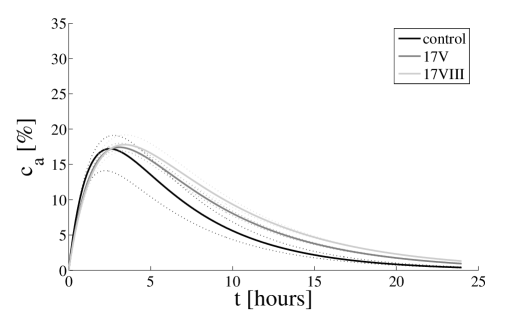
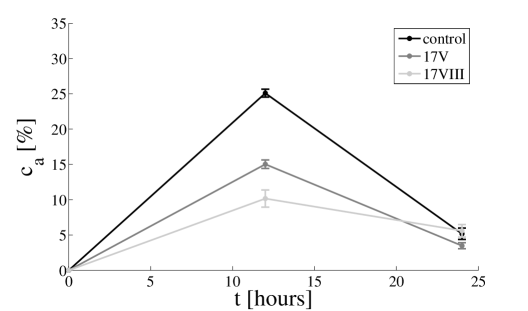
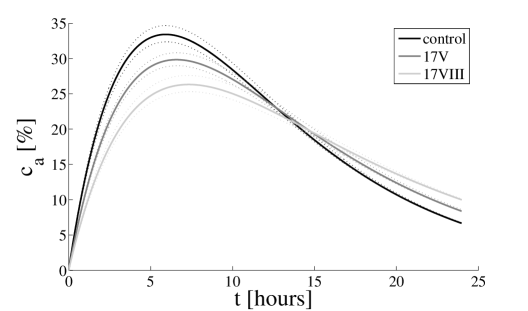
We then solve for given by Eqn. (5) and fit it to the number of apoptotic cells shown in Fig. 2(a) to determine the parameters and Using and setting the fitting of the solution to the number of apoptotic cells in the negative control population gives Substituting now also for the results and the fitting of the solution to the number of apoptotic cells in the OS-9-overexpressed cell line populations gives and respectively. The resulting plots are depicted in Fig. 2(b).
In accordance with the experimental data, our mathematical model returns no significant difference between the number of apoptotic cells in the negative control population and that in the OS-9-overexpressed cell line populations, as illustrated by the shared pattern of the curves. We note that it captures rather closely the crossing point where the number of apoptotic cells in the OS-9-overexpressed cell populations is the same and the starting dominance of the 17V population over the 17VIII population is reversed. As anticipated by E. Vourvouhaki et al. os9 , this case illustrates promotion of cell viability (as shown by ) and possibly downstream resistance to apoptosis (as shown by ). Our mathematical model allows to separate the effect of promotion of viability, as encapsulated in a non-vanishing from the effect of downstream resistance to apoptosis, as encapsulated in a non-vanishing
III.2 Staurosporine treatment in FDC-P1 cells
Here we analyse apoptosis induction by treatment with staurosporine. The apoptotic mechanism is that of addition of an apoptotic agent and is described by the system of equations (4–6), with having the interpretation of OS-9 overexpression modulation in apoptosis resistance. The experimental results are collected in Figs. 5B and 5C of Ref. os9 .
Two different concentrations of staurosporine were considered: and The data for [staurosporine]= are reproduced in Figs. 3(a) and 4(a); the data for [staurosporine]= are reproduced in Figs. 5(a) and 6(a). We do not impose any additional constrain in the system to account for the concentration change. In other words, we let the parameters and absorb the changes induced by the different concentrations.
III.2.1 [Staurosporine]=
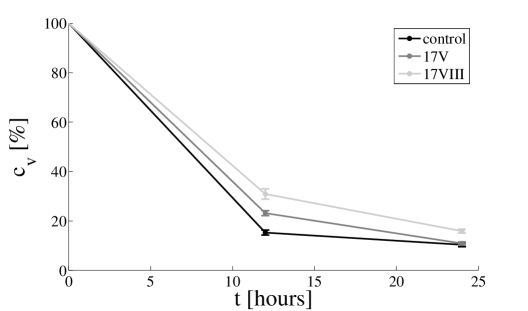
First we solve for for [staurosporine]= given by Eqn. (4), and fit it to Fig. 3(a) to find from in the negative control population, and and from the corresponding OS-9-overexpressed cell line populations. The results are plotted in Fig. 3(b).
We then solve for for [staurosporine]= as given by Eqn. (5), and fit it to Fig. 4(a) in order to determine the parameters and Setting and using we fit the solution to the experimental curve for the number of apoptotic cells in the negative control population and obtain We proceed to fit the solution to the experimental number of apoptotic cells in the OS-9-overexpressed cell line populations, using the values determined above for the other parameters, to find that and The results are plotted in Fig. 4(b).
III.2.2 [Staurosporine]=
First we solve for given by Eqn. (4), and fit the solution to the curves for depicted in Fig. 5(a). Setting we fit the solution to the experimental curve for in the negative control population and find Fitting the solution to the experimental curves for in the OS-9-overexpressed cell line populations with we find and
We then proceed to solve for given by Eqn. (5), and fit the solution to the experimental curves for depicted in Fig. 6(a). Setting and we fit the solution to the experimental curve for in the negative control population and find This value is substantially lower than the one obtained for [staurosporine]= (). This difference emphasises the strong dependence of cell death rate with the apoptotic agent. Using now also the values for we fit the solution to the experimental curve for in the 17V and 17VIII cell line populations to find both and These results are plotted in Fig. 5(b) and Fig. 6(b).
As anticipated by E. Vourvouhaki et al. os9 , this case illustrates resistance to apoptosis, primarily upstream () and possibly also downstream (), dependent on the concentration of staurosporine. This is supported by the observed dependence of the apoptosis time scale on the concentration of the apoptotic agent. A higher concentration of staurosporine increases the probability of interaction with a viable cell, as encapsulated in the larger value of The probability of survival is further reduced by the observed decrease of upstream resistance to apoptosis with a higher concentration of staurosporine, which can be accounted for by the smaller value of and The observed higher dying rate of apoptotic cells, on the other hand, can be accounted for by the larger decay rate The dependence of and with the concentration of the apoptotic agent was, however, not expected in the phenomenological framework of the kinetical model.
III.3 TNF treatment in FDC-P1 cells
Here we analyse apoptosis induction by treatment with TNF (40ng/ml=). Similarly to the previous case discussed, the apoptotic mechanism is that of addition of an apoptotic agent, which is described by the system of equations (4–6), with having the interpretation of OS-9 overexpression modulation in apoptosis resistance. The experimental results are collected in Figs. 6B and 6C of Ref. os9 , which we reproduce in Figs. 7(a) and 8(a) respectively.
We want to solve for given by Eqn. (4), and fit it to Fig. 7(a). Setting , we fit the solution to the experimental curve for in the negative control population cell and find Given we consider the case where Fitting the solution to the experimental curve for in the OS-9-overexpressed cell line populations, we find and The resulting plots are shown in Fig. 7(b).
We then proceed to solve for given by Eqn. (5), and to fit it to Fig. 8(a). Using the values for and determined above, we fit the solution to the experimental curves for in the negative control cell population and in the OS-9-overexpressed cell line populations, finding respectively and both and The resulting plots are shown in Fig. 8(b).
From the parameter estimation we conclude that this case illustrates upstream resistance to apoptosis (), in agreement with what was anticipated by E. Vourvouhaki et al. os9 .
IV Discussion
In this paper we present a simple theoretical model to assess the possible
effects of OS-9 overexpression upon induction of apoptosis.
We formulated a mechanistic model for the
reaction of OS-9-overexpressed cell populations to induction of
apoptosis by different mechanisms and estimated the parameters of the
model from the data set available on the possible implication of OS-9
in promotion of cell viability and resistance to apoptosis.
We summarize the results in Table 1.
| IL-3 | ||||||
| staurosporine | ||||||
| staurosporine | ||||||
| TNF |
From this Table we observe that the OS-9 overexpression-dependent parameters take non-vanishing values. Moreover, comparing the values across all the apoptotic inducing mechanisms, we observe a strong dependence with the level of OS-9 overexpression in the two cell line populations 17V and 17VIII. These observations suggest that OS-9 has a possible role as an anti-apoptotic factor and that this role is dose-dependent, with the cell line population 17VIII exhibiting a greater effect in both promoting cell viability and resisting to induction of apoptosis than 17V.
A closer look at the values reveals that they are very close to zero except for one situation, namely [staurosporine] for the 17VIII cell line population. We are persuaded to speculate that the OS-9 overexpression does not have a significant effect on downstream modulation of apoptosis. The vanishing values found for the parameter whenever presented without error bars are strictly vanishing, i.e. in the parameter interval the minimum of the cost function is at In the cases where the induced average value for is non-vanishing, the induced error bars can still contemplate a vanishing A possible way of testing this effect would be to measure the OS-9 overexpression in the apoptotic phase only, as described by Eqn. (3). The number of apoptotic cells would be controlled, so that the conversion rate will only depend on and
We observe that our model reflects the tendency observed in the data collected in Ref. os9 and supports the interpretation therein advanced. There is quantitative evidence that OS-9 has a role in the regulation of the conversion rates for and as illustrated by the non-vanishing values found for the OS-9-dependent parameters. Such evidence, however, is not determinant since the values are small and the errors are large (ranging from around 10-100% of the values estimated from the average data values). The results show that OS-9 contributes primarily to promotion of viability and upstream resistance to apoptosis, as reflected by with little or no effect on downstream resistance, as reflected by the close to vanishing values for Furthermore, this function does not appear to be related to an increase in cell proliferation, as DNA content analysis shows that cells overexpressing OS9 do not have a greater proportion of dividing cells than control populations os9 .
Some results, however, remain to be fully explained. We collapsed in the parameter all the intricacies of the intra-cellular, molecular processes involved in apoptosis induction and whose relation with OS-9 we had no data to constrain or infer. TNF gives us the highest rate of apoptosis induction among the various other factors, followed by [staurosporine] and [staurosporine] The withdrawal of IL-3, being a factor that promotes cell viability, can be seen indirectly to affect cell viability. Of the three apoptosis induction mechanisms described in the available data sets, only the staurosporine-mediated one allowed to discriminate the effect of the concentration of the apoptotic agent, For that data set we observe a dependence of with However, our model cannot predict the functional form of this dependence so as to reproduce the value in the empirical expression
| (14) |
relating the ten-fold increase of with Moreover, we observe a dependence of both and with which is not a priori encompassed by the kinetical model, since these parameters measure the rate of cellular processes whose developement has, to our current understanding, no relation to the environmental conditions that triggered the preceding process. We also note that both and act towards a decrease of though in different ways. We venture that these observations might be evidence of the limits of the descriptive power of the kinetical model in face of the complexity of the biological system that it was conceived to describe as a first-order model. The binding rates and in the chemical model conceal intermediate phenomena at levels of interaction unaccounted for by the kinetical model. We believe that a higher-order model would be able to expose the sources of these observations, as well as allow for possible dependencies with the apoptotic agent or the apoptosis inducing mechanism.
Additional data from various experimental setups and from complementary measurements are, therefore, required to unambiguously determine the function of OS-9 in cell fate and in tumour growth, and test the model as a realistic theoretical description of the biological system. In particular, further experiments should attempt to identify the signalling pathway through which OS-9 exerts its function. Biochemical assays and western blot analysis will provide the means for the identification of the proteins that OS-9 binds to in order to transmit its potential signals. It is also essential that the function of OS-9 should be tested in in vivo models. The establishment of knockout mice is also important in order to assess the functional importance of OS-9 during development. Only then can we rely on the values for the parameters estimated by the mathematical technique developed in this paper.
Addition of an apoptotic agent or withdrawal of a vital agent are expected to induce apoptosis through different pathways, respectively by a caspase-initiated cascade staurosporine1 ; staurosporine2 ; tnfalpha or by the mitochondria/cytochrome c pathway il3 . We note, however, that we cannot compare the concentrations of different reagents/proteins since each one of them acts in a different way in the cells. Different molecular processes entailing different cellular mechanisms can nevertheless reflect the same populational effect, thus rendering themselves to be described by the same mathematical model. Though at the level of description of our first-order model the parameters estimated for each mechanism are not comparable, they are nonetheless valid to suggest a contribution of OS-9 to cell viability and resistance to apoptosis.
The process of explaining a mechanism involves an active process of simplification: it is necessary to make assumptions to define the most relevant components contributing to the overall observed dynamics, while removing factors which contribute less. The isolation and identification of the core principles governing the dynamics is paramount to the detailed understanding of any system. [For a discussion, see Ref. ref ]. Following this approach, we present a minimal model which is capable of capturing the structure of the experimental data. This model does not fit perfectly the experimental data but it is built upon biologically plausible and consistent assumptions. The values for all the parameters in the model are calculated using the least mean square method and are, in that sense, optimal. More complex models could be derived which, by using more parameters, would provide a better fit to the data. However, such models would be less informative since the functional role of the additional parameters would be speculative. Moreover, experimental data are always noisy and a perfect fit to a specific data set means loss in generality. It is important to emphasise that very little is known about the dynamics associated with OS-9. Our minimal model conciliates the scarce information available with robust assumptions to produce a simple but general model capable of quantifying the contribution of OS-9 as a potent anti-apoptotic factor. This is a first-order model which serves as a valuable starting point for experiments aiming at a more detailed understanding of the role of OS-9. To the best of our knowledge, this is the only available model for the quantification of the OS-9 contribution to apoptosis.
This model can be applied to other cellular systems since it allows for the discrimination of effects at different stages in a complex chemical mechanism and can easily be upgraded in accordance to the functional information available.
Acknowledgments
The authors dedicate this paper to the memory of Peny Tziamourani. C.C. and P.A. thank the Fundação para a Ciência e a Tecnologia for support. C.C. also thanks the National and Kapodistrian University of Athens for its hospitality.
References
- (1) N. Johnson, S. Sengupta, S.A. Saidi, K. Lessen,S.D. Charnock-Jones, L. Scott, R. Stephens,T.C. Freeman,B.D. Tom, M. Harris,G. Denyer, M. Sundaram, R. Sasisekharan R., S.K. Smith, C.G. Print, Endothelial cells preparing to die by apoptosis initiate a program of transcriptome and glycome regulation, FASEB J. 18(1), 188-190 (2004).
- (2) Y. Kimura, M. Nakazawa and M. Yamada, Cloning and characterization of three isoforms of OS-9 cDNA and expression of the OS-9 gene in various human tumor cell lines, J Biochem 123(5), 876-882 (1998).
- (3) Y. Kimura, M. Nakazawa, N. Tsuchiya, S. Asakawa, N. Shimizu and M. Yamada, Genomic organization of the OS-9 gene amplified in human sarcomas, J Biochem 122(6), 1190-1195 (1997).
- (4) J.H. Baek, P.C. Mahon, J. Oh, B. Kelly, B. Krishnamachary, M. Pearson, D.A. Chan, A.J. Giaccia and G.L. Semenza, OS-9 interacts with hypoxia-inducible factor 1alpha and prolyl hydroxylases to promote oxygen-dependent degradation of HIF-1alpha, Mol Cell. 17(4), 503-512 (2005).
- (5) N. Vigneron, A. Ooms, S. Morel, G. Degiovanni, B.J. Van Den Eynde, Identification of a new peptide recognized by autologous cytolytic T lymphocytes on a human melanoma, Cancer Immun. 2, 9 (2002).
- (6) E. Vourvouhaki, S.M. Sullivan, Y. deNantois, S.K. Smith, C.G. Print and D.S. Charnock-Jones, OS-9 as a potent anti-apoptotic factor that also promotes cell viability, Rev Clin Pharmacol Parmacokinet (2007), (ahead of print).
- (7) D.E. Johnson, Regulation of survival pathways by IL-3 and induction of apoptosis following IL-3 withdrawal, Front Biosci 3, d313-324 (1998).
- (8) T.L. Yue, C. Wang, A.M. Romanic, K. Kikly, P. Keller, W.E. DeWolf, T.K. Hart, H.C. Thomas, B. Storer, J.L. Gu, X. Wang and G.Z. Feuerstein, Staurosporine-induced apoptosis in cardiomyocytes: A potential role of caspase-3, J Mol Cell Cardiol. 30(3), 495-50 (1998).
- (9) G. Feng and N. Kaplowitz, Mechanism of staurosporine-induced apoptosis in murine hepatocytes, Am J Physiol Gastrointest Liver Physiol 282, G825-G834 (2002).
- (10) E.E. Varfolomeev and A. Ashkenazi, Tunor necrosis factor: an apoptosis JuNKie?, Cell 116, 491-497 (2004).
- (11) D. Wodarz and N.L. Komarova, Computational Biology of Cancer: lecture notes and mathematical modeling, World Scientific, 2005.
- (12) A.S. Novozhilov, F.S. Berezovskaya, E.V. Koonin and G.P. Karev, Mathematical modelling of anti-tumor virus therapy: regimes with complete recovery within the framework of deterministic models, q-bio.TO/0512022.
- (13) B. Zhivotovsky and S. Orrenius, Defects in the apoptotic machinery of cancer cells: role in drug resistance, Seminars in Cancer Biology 13, 125-134 (2003).
- (14) J.M.G. Vilar, C.C. Guet and S. Leibler, Modeling network dynamics: the lac operon, a case study, Cell Biol. 161, 471 (2003).
V Captions
Figures denoted by (a) reproduce the data reported in Ref. os9 ,
the points depicted giving the readings for the different cell
populations as follows:
HA-expressed cell population (black),
17V cell line (dark gray),
17VIII cell line (light gray).
Figures denoted by (b) show the solutions for either or
Fig. 1: Number of viable cells after withdrawal of IL-3, in the presence and in the absence of OS-9, from FACS analysis. In (a) we reproduce the data from Fig. 2B in Ref. os9 . In (b) we show the solutions for with The black curve depicts when the gray curves depict with the dark gray curve for and the light grey curve for (The upper dashed curves represent the fittings to the maxima data with and the lower dashed curves represent the fittings to the minima data with and )
Fig. 2 Number of apoptotic cells after withdrawal of IL-3, in the presence and in the absence of OS-9, from FACS analysis. In (a) we reproduce the data from Fig. 2C in Ref. os9 . In (b) we show the solutions for with and The black curve depicts when the gray curves depict with the dark gray curve for and and the light gray curve for and (The upper dashed curves represent the fittings to the maxima data with and and and the lower dashed curves represent the fittings to the minima data with and and and )
Fig. 3 Number of viable cells after treatment with staurosporine in the presence and in the absence of OS9, from FACS analysis. In (a) we reproduce the data from Fig. 5B in Ref. os9 . In (b) we show the solutions for with The black curve depicts when The gray curves depict with the dark gray curve for and the light gray curve for (The upper dashed curves represent the fittings to the maxima data with and the lower dashed curves represent the fittings to the minima data with and )
Fig. 4 Number of apoptotic cells after treatment with staurosporine in the presence and in the absence of OS-9, from FACS analysis. In (a) we reproduce the data from Fig. 5C in Ref. os9 . In (b) we show the solutions for with and The black curve depicts when the gray curves depict with the dark gray curve for and and the light gray curve for and (The upper dashed curves represent the fittings to the maxima data with and and and the lower dashed curves represent the fittings to the minima data with and and and )
Fig. 5 Number of viable cells after treatment with staurosporine in the presence and in the absence of OS9, from FACS analysis. In (a) we reproduce the data from Fig. 5B in Ref. os9 . In (b) we show the solutions for with The black curve depicts when the gray curves depict with the dark gray curve giving and the light gray curve (The upper dashed curves represent the fittings to the maxima data with and the lower dashed curves represent the fittings to the minima data with and )
Fig. 6 Number of apoptotic cells after treatment with staurosporine in the presence and in the absence of OS-9, from FACS analysis. In (a) we reproduce the data from Fig. 5C in Ref. os9 . In (b) we show the solutions for with and The black curve depicts when the gray curves depict with and for the dark gray curve, with and for the light gray curve. (The upper dashed curves represent the fittings to the maxima data with and and and the lower dashed curves represent the fittings to the minima data with and and and )
Fig. 7 Number of viable cells after treatment with TNF in the presence and in the absence of OS-9, from the FACS analysis. In (a) we reproduce the data from Fig. 6B in Ref. os9 . In (b) we show the solutions for with The black curve depicts when the gray curves depict with the dark gray curve for and the light grey curve for (The upper dashed curves represent the fittings to the maxima data with and the lower dashed curves represent the fittings to the minima data with and )
Fig. 8
Number of apoptotic cells after treatment with TNF
in the presence and in the absence of OS-9,
from the FACS analysis.
In (a) we reproduce the data from Fig. 6C in Ref. os9 .
In (b) we show the solutions
for with and
The black curve depicts when
the gray curves depict with the dark
gray curve for and
and the light gray curve for
and
(The upper dashed curves represent the fittings to the maxima data with
and
and and
the lower dashed curves represent the fittings to the minima data with
and
and and )
Table 1: Kinetical model parameters estimated for both cell line populations. We summarize the values of the parameters estimated for both cell line populations and for the three different mechanisms of apoptosis induction.
VI Figures