From Systems Biology to Dynamical Neuropharmacology: Proposal for a New Methodology
Abstract
The concepts and methods of Systems Biology are being extended to neuropharmacology, to test and design drugs against neurological and psychiatric disorders. Computational modeling by integrating compartmental neural modeling technique and detailed kinetic description of pharmacological modulation of transmitter - receptor interaction is offered as a method to test the electrophysiological and behavioral effects of putative drugs. Even more, an inverse method is suggested as a method for controlling a neural system to realize a prescribed temporal pattern. In particular, as an application of the proposed new methodology a computational platform is offered to analyze the generation and pharmacological modulation of theta rhythm related to anxiety is analyzed here in more detail.
1 Introduction
Systems Biology is an emergent movement to combine system level description with microscopic details. It might be interpreted as the renaissance of cybernetics [wiener] and of system theory [bertal], materialized in the works of Robert Rosen [rosen85]. (For an excellent review on applying the system theoretical tradition to the new Systems Biology see [wolkenhauer01].)
To have a system-level understanding of biological systems [kitano02, csetedoyle02] we should get information from five key features:
- Architecture.
-
The structure (i.e. units and relations among these units) of the system from network of gene interactions via cellular networks to the modular architecture of the brain are the basis of any system level investigations.
- Dynamics.
-
Spatio-temporal patterns (i.e. concentrations of biochemical components, cellular activity, global dynamical activities such as measured by electroencephalogram, EEG) characterize a dynamical system. To describe these patterns dynamical systems theory offers a conceptual and mathematical framework. Bifurcation analysis and sensitivity analysis reveal the qualitative and quantitative changes in the behavior of the system.
- Function.
-
This is the role that units (from proteins via genes, cells and cellular networks) play to the functioning of a system (e.g. our body and mind).
- Control.
-
There are internal control mechanisms which maintain the function of the system, while external control (such as chemical, electrical or mechanical perturbation) of an impaired system may help to recover its function.
- Design.
-
There are strategies to modify the system architecture and dynamics to get a desired behavior at functional level. A desired function may be related to some “optimal temporal pattern”.
While Systems Biology is now generally understood in a somewhat restricted way for proteins and genes, its conceptual and mathematical framework could be extended to neuroscience, as well. Trivially, there is a direct interaction between molecular and mental levels: chemical drugs influence mood and state of consciousness. However, “almost all computational models of the mind and brain ignore details about neurotransmitters, hormones, and other molecules.” [thagard02].
In this paper we show how to realize the program of Systems Biology in the context of a new, dynamic neuropharmacology, which was outlined recently elsewhere [aradierdi]. Also, we offer a methodology to integrate conventional neural models with detailed description of neurochemical synaptic transmission in order to develop a new strategy for drug discovery. The procedure is illustrated on the problem of finding selective anxiolytics.
In particular, our proposed working hypothesis is that
•
for given putative anxiolytic drugs we can test their
effects on the EEG curve by,
•
starting from pharmacodynamic data (i.e. from dose-response
plots), which of course are different for different recombinant
receptors,
•
setting the kinetic scheme and a set of rate constants,
•
simulating the drug-modulated GABA – receptor
interaction,
•
calculating the generated postsynaptic current,
•
integrating the results into the network model of the EEG
generating mechanism,
•
simulating the emergent global electrical activity,
•
evaluating the result and to decide whether the drug tested
has a desirable effect.
In section 2 we first review the literature and existing computer models of anxiety and anxiolytics. Second a review of GABA – GABA (ligand – receptor) interaction is given with a particular attention on its connection to anxiety research. In section 3 we elaborate on the proposed working hypothesis and give an example by integrating a GABAreceptor model by Bai et al. (1999)[bai] into a gamma related theta generating interneuron network model by Orbán et al. (2001) [orban01].
2 Computer models of anxiety
2.1 Biologically motivated modeling of neural circuits
2.1.1 Architecture: the septo-hippocampal system
It was demonstrated (see e.g. the seminal book of Gray and McNaughton [gray00]) that the septo-hippocampal system is strongly involved in anxiety and related disorders.
In a joint pharmacological and computational work [hajos04, ijis] effects of the injection of the positive and negative allosteric modulators diazepam and FG-7142, respectively, were studied. To investigate the dynamical and functional effects of different pharmacological agents by computational tools a skeleton model of the septo-hippocampal system was established. The skeleton network model (Fig. 1) of the hippocampal CA1 region and the septal GABAergic cells consisted of five cell populations. The hippocampal CA1 pyramidal cell model was a multicompartmental model modified from [varona00]. In the hippocampal CA1 region basket neurons and two types of horizontal neurons were also taken into account.

Connections within and among cell populations were created faithfully following the hippocampal structure. The main excitatory input to horizontal neurons is provided by the pyramidal cells via AMPA (alpha-amino-3-hydroxy-5-methyl-4-isoxazolepropionic acid) mediated synapses [lacaille87]. Synapses of the septally projecting horizontal cells [jinno02] and synapses of the other horizontal cell population, the O-LM cell population innervating distal apical dendrites of pyramidal cells [lacaille90] are of the type. O-LM neurons (on of the two horizontal interneurons) also innervate parvalbumin containing basket neurons [katona99]. Basket neurons innervate pyramidal cells at their somatic region and other basket neurons [freund96] as well. Septal GABAergic cells innervate other septal GABAergic cells and hippocampal interneurons [freund88, varga02] (Fig. 1). For a full description of this model see the online supplementary materials to the paper [hajos04] at: http://geza.kzoo.edu/theta/theta.html.
The above described model captures several elements of the complex structure of the hippocampal CA1 and can be used to account for very precise interactions within this region. However, when the focus of interest is rather on general phenomena taking place during rhythm generation modelers might settle for a simpler architecture. In [orban01] authors describe gamma related theta oscillation generation in the CA3 region of the hippocampus. The architecture of the model is exceedingly simplified: only an interneuron network is simulated in detail. This simplification, however, allowed the authors to introduce an extrahippocampal input and study its effect on rhythm generation. As a result, the model is able to account for basic phenomena necessary for the generation of gamma related theta oscillation. As an extension of this model, authors show [kiss01] that activity of the interneuron network indeed accounts for rhythm generation in pyramidal neurons.
2.1.2 Dynamics: Generation of theta rhythms
Theta frequency oscillation of the septo-hippocampal system has been considered as a prominent activity associated with cognitive function and affective processes. To investigate the generation and control of theta oscillation in the hippocampal CA1 region the previously described detailed, realistic model [hajos04] was used. Firing of neurons of the four simulated populations were modulated in time. There are time intervals in which firing was significantly reduced were alternated by intervals where enhanced firing was observed. This synchronized state of neural firing was further confirmed by the field potential, which exhibited a prominent 5 Hz oscillation (see Fig. 6 in [hajos04]).
Simulation results showed that key components in the regulation of the population theta frequency are the membrane potential oscillation frequency of pyramidal cells, strength of the pyramidal cell – O-LM cell innervation and the strength of recurrent basket cell connections. Amplitude and frequency of pyramidal cell membrane potential oscillation is determined by their average depolarization, passive membrane parameters and parameters of the active currents. Average depolarization in our model results from septal cholinerg innervation. An important factor is the presence and maximal conductance of the hyperpolarization activated current. If is present it shortens response times of pyramidal cells to hyperpolarizing current pulses and more importantly decreases its variance: acts as a frequency stabilizer. Synaptic strengths in our description are set by convergence numbers and maximal synaptic conductances.
An explanation of intrahippocampal theta oscillation generation – based on this model – includes (i), signal propagation in the pyramidal cell O-LM cell basket cell pyramidal cell feed-back loop, (ii), synchronization of neural activity via the recurrent, inhibitory connections within the basket cell network and (iii), synchronization of pyramidal cell firing due to rebound action potential generation. It is true that the propagation of a single signal throughout this trisynaptic loop would not require the amount of time characteristic to the theta oscillation (0.2–0.25 sec), thus in the present case the population oscillation is created not by the propagation of single signals but rather the propagation of a “synchronized state” in the network.
The observed periodic population activity is brought about by alternating synchronization and desynchronization of cell activities due to the interplay of the above mentioned synchronizing forces and some desynchronizing forces (such as heterogeneity of cell parameters and diversity of synaptic connections), as observed in [orban01, kiss01].
2.1.3 Function: Mood Regulation
The hippocampal formation is known to be involved in cognitive processes (navigation and memory formation – for reviews see e.g. [lengyel05, buzsaki05]) and mood regulation [gray00, freund03]. When an impairment occurs in the architecture or dynamics of the septo-hippocampal system, this change is reflected in its function e.g. as an impairment of its memory storing or mood regulatory capability. One such mood disorder is anxiety:
“Anxiety is a complex combination of the feeling of fear, apprehension and worry often accompanied by physical sensations such as palpitations, chest pain and/or shortness of breath. It may exist as a primary brain disorder or may be associated with other medical problems including other psychiatric disorders…
A chronically recurring case of anxiety that has a serious affect on your life may be clinically diagnosed as an anxiety disorder. The most common are Generalized anxiety disorder, Panic disorder, Social anxiety disorder, phobias, Obsessive-compulsive disorder, and post-traumatic stress disorder” [wikipedia]
It is well documented that anxiolytics and hypnotics reduce the amplitude of septo-hippocampal oscillatory theta activity, which contributes to their therapeutic effect but causes unwanted side effects, e.g. cognitive impairment as well [maubach04, lees04].
Historically used mood regulators act on the barbiturate or benzodiazepine (BZ) sites of GABA receptors. These drugs have both anxiolytic and hypnotic activity because they modulate all types of receptors.
Conventional anti-anxiety drugs have sedative-hypnotic side effects,
and have negative effects on cognitive functions, such as memory and
generally they reduce the amplitude of theta rhythm. While it seems
possible to dissociate sedative-hypnotic effects and anxiety, it is
not clear how to decrease anxiety without impairing memory function.
Models of anxioselective actions: search for data
Recently it became clear that subunits of GABA receptors exhibit a remarkable functional specificity. Genetic manipulations helped to show that subunits are responsible for mediating sedative effects, while subunits mediates anxiolytic effects [rud-moehler04]. Preliminary experimental data and modelling studies for the effects of the preferential and positive allosteric modulator, zolpidem and L838,417, respectively, for the septo-hippocampal theta activity have been reported [balazs-mitt05].
In that study we examined the effects of the and subtype-selective BZ site ligand zolpidem and L838,417 on the septo-hippocampal system. In electrophysiological experiments extracellular single unit recordings were performed from medial septum/diagonal band of Broca with simultaneous hippocampal (CA1) electroencephalogram (EEG) recordings from anesthetized rats. Both of the drugs eliminated the hippocampal theta oscillation, and turned the firing pattern of medial septal cells from periodic to aperiodic, but only the zolpidem reduced the firing rate of the these neurons. In parallel to these experimental observations, a computational model has been constructed to clearly understand the effect of these drugs on the medial septal pacemaker cells. We showed that the aperiodic firing of hippocampo-septal neurons can reduce the periodicity of the medial-septal cells, as we have seen in the case of the L838,417. The reduction of firing rates in the case of zolpidem is attributed to the increase of the synaptic conductances and the constant inhibition of these cells. We modelled these drug effects by modifying (i) the synaptic maximal conductances of the GABA synapses. (ii) the constant excitatory drive of the median septal cells and (iii) the hippocampal input. The incorporation of a more detailed synaptic model, similarly to the one proposed in Section 3.1, taking into account differences between and subunits is in progress.
Zolpidem increases by concentration-dependent manner the duration and amplitude of the postsynaptic current, most likely by enhancing the affinity of the receptors for GABA [perr-rop99], but these effects were diminished or absent in neurons from knock-out mice [goldsteinetal02]
There seem to be compounds, which might have comparable binding affinity but different efficacies at the various subtypes, thereby preferentially exerting their effects at subtypes thought to be associated with anxiety. L838,417 seems to be an example for subtype selective compounds [atack], but only few kinetic or even pharmacodynamic data could be found in the public domain. In Section 3 drugs whose effect on the GABA kinetics is known will be used to demonstrate the proposed methodology, using a detailed kinetic model of GABA receptors within the network model of CA3 interneurons.
2.2 Phenomenological and kinetic descriptions of synaptic interaction
2.2.1 Control: GABA receptor kinetics
Pharmacological modulation: why and how?
One perspective of the pharmacotherapy of anxiety might be
based on reducing septo-hippocampal theta activity and it is related
to modulate the interaction between the GABA transmitter and receptors. Since receptors occur in a variety of specific forms,
they might be subject of pharmacological control to obtain selective
functional effects. While by-and-large it is understandable that
putative drugs induce opening and closing of synaptic channels (here
the chloride channels), the underlying finely tuned kinetic mechanism
of the interaction of transmitters, modulatory agents and receptors
are not known. Our longer term goal is to find out how
pharmacological effects depend on the concentration of transmitter and
of modulators. In technical terms, while there are detailed models of
the presynaptic transmitter release here we restrict ourselves to
build a detailed kinetic model for the generation of the postsynaptic
response.
Pharmacological elements
Receptor Structure: receptors are pentameric
structures consisting of multiple subunits. At this moment
[farr-nus05] nineteen subunits have been cloned from mammalian
brain. According to their sequence similarities, subunits have been
grouped into seven families: and . Only a few dozen among the many combinatorial
possibilities exist. The most frequent subtypes are two , two
and one subunits. The structural variations imply
functional consequences [farr-nus05], among others for the
kinetic properties.
Pharmacodynamics: Effect of drugs can be characterized by dose-response curves. Some drugs have the ability to open a certain ion channel per se. In this case drugs are characterized by the maximal evoked response or the potency, the drug concentration, which elicit 50 % of the maximal response.
There are other cases, however, when the drug can not open the ion channel directly but requires an additional ligand to evoke an action. In the followings we study drugs that modulate interaction between the GABA transmitter and receptors.
Both barbiturates and BZs shift the GABA concentration-response curve
to the left, but barbiturates also increase the maximum response. They
act on different states, consequently they have different kinetic
effects: average open time of the channel, but not the channel opening
frequency is increased significantly by barbiturates. As opposed to
BZs, barbiturate receptors do not contain subunits (see
later). One more difference is that at high concentration GABA
receptor channels can directly be opened by barbiturates. For a
summary see [martin]. Anxiolytic activity was not a particular
disadvantage when these drugs were used as hypnotics, hypnosis was a
definite disadvantage when they were used as anxiolytics. Recent
discoveries made possible the separation between hypnotic and
anxyolitic activity and selective hypnotic agents (e.g. zolpidem) are
already on the market. Selective anxiolytics are on the preclinical
and/or in clinical trial stage.
The conventional tool of computational neuroscience: a phenomenological model
One way to describe synaptic transmission is to use a gating variable similar to the well known Hodgkin – Huxley formalism:
| (1a) | ||||
| (1b) | ||||
| (1c) | ||||
with being the synaptic current, the maximal synaptic conductance, the gating variable of the synaptic channel, the synaptic reversal potential, is an activation function, and rate functions describing opening and closing of the gate of the synaptic channel, is a threshold.
Figure 2. illustrates the general form of effects of receptor modulators described by the phenomenological model, where the effect of drugs was taken into account solely by modifying , the maximal synaptic conductance.

From pharmacodynamics to detailed kinetic schemes
Kinetic models of transmitter-receptor interaction (without and in the presence of drugs) help to calculate the induced synaptic current, and gives a possibility to get quantitative insight how to modulate it. A specific step in the transmitter-receptor interaction, namely desensitization, plays an important role in shaping the GABAergic currents. Since our general goal is to incorporate appropriate kinetic models to the network model to compute the drug effects on global brain rhythm, we should have appropriate kinetic model.
As opposed to the conventional phenomenological description, a more effective, but certainly most expensive, modelling tool to evaluate the pharmacological effects of the different modulators, or even to give help for offering new putative molecules for drug discovery, is the inclusion of more detailed kinetic studies of GABA receptor modulation.
Jones and Westbrook [joneswester95] established a model for describing the rapid desensitization of the receptors. More specific kinetic models should be studied to describe the effects of the different (full and partial) agonists and antagonists taking into account that connections between singly and doubly bound open and desensitized states may influence the receptor kinetics. Baker et al. [bakeretal02] explained the functional difference between the effects of propofol (which has hypnotic effect) and of midazolam (a sedative - amnestic drug) based on a detailed kinetic model of a single cell with autapses and two interconnected cells.
The main difference is that propofol modifies the desensitization processes, more dramatically the slow desensitization steps and the modified kinetic parameters. These differences imply distinct behavior of the network (synchronization, frequency of oscillation) and therefore also in function.
3 Integrating receptor kinetics and neural network models
3.1 Setting up the model
In the following section we connect the two concepts reviewed in the first part of this paper. Below is the description of an illustrative model integrating the detailed kinetic description of synaptic receptors [bai] into the biophysical model of a gamma related theta rhythm generating interneuron network [orban01, kiss01]. We use this model to study the effect of drugs that have a well identified effect on the chemical reactions taking place in the GABA receptor.
Here, the model is introduced only briefly, detailed equations and parameters can be found in the Appendix. The modeled interneurons contained the Hodgkin – Huxley channels (sodium, potassium and leak), which were identical for all cells (see A-1a – A-1m). Also, the synaptic current () and an input current () were considered (see below).
A connection between two interneurons was established through a synaptic mechanism consisting of a phenomenological presynaptic and a chemically realistic described postsynaptic part. The presynaptic model describes the transmitter release due to an action potential generated in the presynaptic neuron by a sigmoid transfer function (see A-2). The value of the released transmitter concentration () is then used in the postsynaptic GABA receptor model to calculate the concentration of receptor proteins being in the conducting (two ligand binded open) state () (see A-12 – A-13g). The synaptic current was thus given by
| (2) |
where is the number of presynaptic neurons, indexes these presynaptic neurons, is the maximal synaptic conductance representing the synaptic channel density, is the postsynaptic membrane potential and is the reversal potential of the chloride current. For details and parameters of the postsynaptic model see the Appendix.
Using this synaptic mechanism interneurons were connected into a random network. Probability of forming a connection between any two neurons was from 60 % to 100 % in the simulations; autapses were not allowed. Maximal synaptic strength was normalized to enable scalability of the model: for each postsynaptic neuron , where was varied from 0.1 mS/cm2 to 0.2 mS/cm2.
As it was shown in previous computer models [orban01, kiss01] when the interneurons are driven by periodically modulated input and the phase of inputs to different cells is heterogeneous, the random network of interneurons generate gamma related theta frequency resonance. Indeed, as shown before by Wang and Buzsáki (1996) a network of mutually interconnected fast firing inhibitory neurons can generate synchronized gamma frequency oscillation. This synchronization is reflected e.g. in the population activity or in the raster diagrams (for these measures see the Appendix). However, when cells are driven by a periodic inputs with disperse phase instead of a constant current, a slow (theta frequency range) modulation of the population activity emerges (for details on necessary and sufficient conditions for theta generation the reader is kindly directed to Orbán et al. (2001)). Briefly, the input for each cell took the following form:
| (3) |
with being the amplitude and the offset of this current (0.005 – 0.01 A/m2), the frequency (25 – 50 Hz) and is the phase drawn from a Gaussian distribution with 0 mean and 30 degree variance.
3.2 Direct problem: in silico drug screening with the integrated model
Kinetic modeling of synaptic transmission has a flexibility in the level of detailed description from chemical kinetic to simplified representation [dest98]. The development of new pharmacological, electrophysiological and computational techniques make possible to investigate the modulatory effects of putative drugs for synaptic currents, and consequently for local field potentials and even behavioral states. Putative drugs with given kinetic properties can be tested in silico before (instead of?) real chemical and biological studies.
As noted before population oscillations reflected by the EEG can be considered as biomarkers for some brain disorders. We used our integrated model to study effects of two known drugs, the hypnotic propofol and the sedative midazolam on the population theta rhythm. In a previous work [kiss01] it was shown that the population activity of the interneuron network can be used to account for the activity of pyramidal cells, which can be in turn translated into EEG. Thus, to quantify our results the raster plots, a population activity measure and its Fast Fourier Transform were used (see Appendix).
Control condition: As shown previously [orban01, kiss01] in control situation this model exhibits spike synchronization in the gamma frequency band, which is modulated in the theta band (Fig. 3) (for a detailed explanation of measures used below see the Appendix). On Fig. 3A (the raster plot) each row symbolizes the spike train of a given cell with a black dot representing the firing of an action potential. Note that firing of the cells line up in well-synchronized columns e.g. from approximately 2.2 sec to 2.35 sec. As a result of heterogeneity in the phase of the driving current and in synaptic contacts this high synchrony loosens, column on the raster plot are less well organized in the 2.35 sec – 2.45 sec interval. This synchronization – desynchronization of cells is a result of the modulation of the instantaneous frequency of individual cells (Fig. 3B – for more details the reader is kindly referred to Orbán et al (2001)). A qualitative measure of the synchrony is given by the population activity (Fig. 3C) and the network synchrony (Fig. 3D).

As argued in [kiss01] this synchronization – desynchronization of the population activity of interneurons is transposed to principal cells of the hippocampal CA3 modulating their firing probability in the theta band. This modulation might be reflected in the EEG or CA3 local field potential. Thus, we propose that there is a mapping between the FFT of the CA3 local field potential or EEG and the FFT of the simulated population activity (Fig. 3E), which shows a peak at the theta frequency. Other peaks at higher frequencies are related to the fast firing properties and the resulting synchronization of the interneurons as well as the frequency of the driving current.
Drug administration: Given the detailed kinetic description of GABA receptors the modulation of the synaptic current due to its interaction with the drug can be simulated. Moreover, in the integrated model framework an evaluation of the drug effect on the network level can be performed.
The identification of the effect of a given drug on the kinetic rate parameters of a certain receptor type or subtype is a complicated and tedious undertaking. To present the soundness of our model two known drugs were used in the simulations: propofol and midazolam (for parameter values see the Appendix). However, a considerable effort was made to estimate the change of the rate constants due to the application of the L838,417 compound using the chemical method of parameter estimation. Unfortunately, sufficient kinetic or even pharmacodynamic data could not be found in the public domain to obtain realistic estimation for the rate constants.
Figure 4 and 5 show effects of propofol and midazolam, respectively, on the network behavior (sub-figures are the same as in Fig. 3: A: raster plot; B: the instantaneous frequency versus time; C: the population activity versus time; D: network synchrony; E: FFT of the population activity function). The purpose of the present paper is not to give a detailed description and analysis of the mode of action of these drugs, thus we restrict ourselves to mention that while propofol prolongs deactivation of the receptor and reduces the development of both fast and slow desensitization, midazolam facilitates the accumulation of the receptors into the slow desensitized state, which compensates the current resulting from slower deactivation [bai]. As a result propofol enhances the tonic synaptic current to a greater extent than midazolam, whereas propofol and midazolam produces similar changes to the time course of single inhibitory postsynaptic currents (IPSCs) [bai98].


On the network level the difference that propofol and midazolam exert on the tonic component of the synaptic current has a grave consequence. While the peak in the FFT at approximately 4 Hz representing the theta modulation of the population activity is still present in the case when synapses were “treated” with midazolam (Fig. 5E) it is completely missing for the propofol “treated” case (Fig. 4E).
These findings are in concert with our earlier results [hajos04] where we have shown that diazepam a positive allosteric modulator of the synapses inhibited theta oscillation. There synapses were modeled using the phenomenological technique and the increase of the tonic component of the synaptic current was achieved by increasing the maximal synaptic conductance parameter, while the time constants were kept constant to account for similar IPSCs. Methodologically, the approach we followed in the integrated model is more established, as generally the maximal synaptic conductance parameter is mostly associated with channel density in the synapse, which is not modified by the administration of the drug. Moreover, using the detailed kinetic model of the synapse allows us to i, account for drug induced changes in the receptor in a chemically more sound way; ii, simulate a much larger variety of situations than by using the phenomenological model; and iii, present several possibilities (several sets of rate constants) resulting in the same receptor behavior (a given receptor behavior might be brought about by a non-unique set of parameters) to drug researchers who in turn can engineer the desired molecule that is easiest to design.
4 Discussion
4.1 Design (Inverse Problem): From System Identification to Optimal Temporal Patterns
We have shown that in a moderately complex conductance-based model of the hippocampal CA3 region theta rhythm generation can be observed and its general properties can be identified [orban01] These results qualify the model for consideration as a useful tool in the hands of pharmacologists, physiologists and computational neuroscientists to complete their repertoire of available tools in the search for efficient and specific drugs.
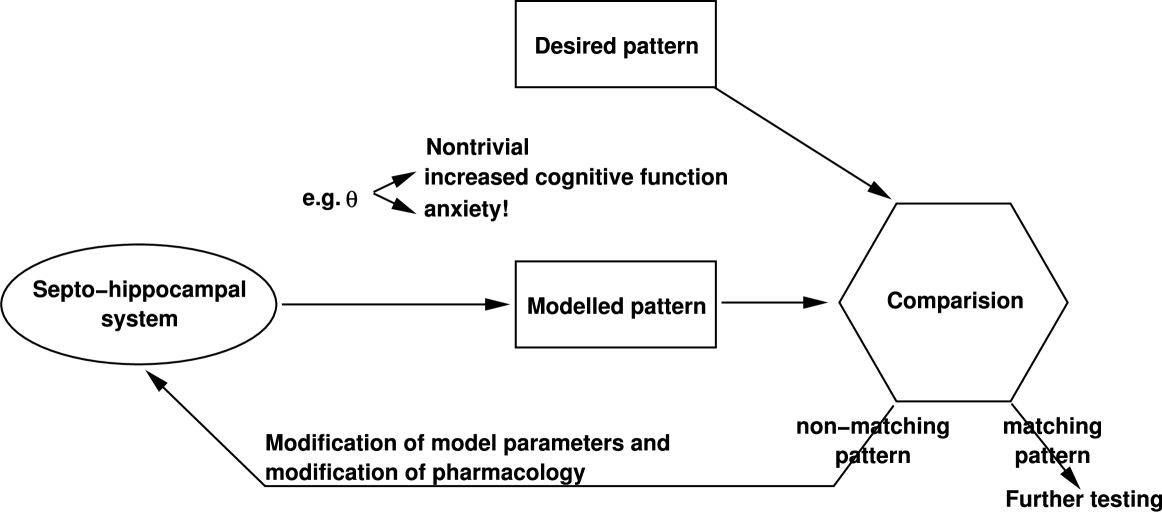
Figure 6 is an oversimplified scheme offered for finding a modulator to set optimal septo-hippocampal EEG pattern.
In order to decrease anxiety first a desired EEG pattern should be defined. Anxyolitics should reduce the theta amplitude (but preserve the cognitive performance and avoiding sedative and hypnotic side effects). Computational analysis should offer a kinetic scheme and the best rate constants to modulate the fixed network to minimize the deviation from the desired “optimal pattern”. (Network architecture is supposed to be fixed. By neglecting this assumption we should turn from neuropharmacology to neurosurgery…) Most likely there are more than one possibilities to reach the goal, and model discrimination and parameter estimation techniques may help to narrowing the alternatives.
As it is known from chemical kinetics [et, turtamas90] sensitivity analysis shows that in a kinetic scheme there are “more and less important” components and reactions. It may help to answer the question how to modify a given drug to change the reaction rate constants in the desired direction – and leaving everything else intact.
4.2 Further research
The aim of the present paper is to offer conceptual and mathematical frameworks to integrate network and receptor level descriptions for investigating the effects of potential drugs on the global electrical patterns of a neural center, and on the behavioral states (mood, consciousness, etc.). Once we have understood (i) the basic mechanisms of rhythm generation, (ii) the elementary steps of the modulatory process, we shall be able to give advice to drug designers pointing out which subprocess and how to be modulated to reach the given goal.
Specifically, we briefly reviewed some aspects of receptor kinetics, and the effects of (full and partial) agonists, antagonists and inverse antagonists to septo-hippocampal theta rhythms. Our specific goal is to offer a computational platform to design anxiolytic drugs with as small as possible side effects. While it is known that positive allosteric modulators acting on subunits are potential candidates for being selective anxyolitics, integrative computational modeling would help to select potential drugs with the appropriate kinetic properties.
5 Acknowledgments
Thanks for the motivation and experimental data to Mihály Hajós. We benefited from discussions with Ildikó Aradi (PE), Jean-Pierre Rospars (JT) Gergő Orbán (TK) and Shanna G. Barkume (PE, LZ, TK). This work was supported by the Hungarian National Science Foundation (OTKA) Grant number T038140. PE thanks the Henry R. Luce Foundation the general support.
APPENDIX
Interneuron model
The interneuron model was taken from [wang96] and obeys the following current balance equation:
| (A-1a) | ||||
| (A-1b) | ||||
| (A-1c) | ||||
| (A-1d) | ||||
| (A-1e) | ||||
| (A-1f) | ||||
| (A-1g) | ||||
| (A-1h) | ||||
| (A-1i) | ||||
| (A-1j) | ||||
| (A-1k) | ||||
| (A-1l) | ||||
| (A-1m) | ||||
with parameters: S/m2, S/m2, S/m2, mV, mV, mV ,
Synapse model
The presynaptic model describes transmitter release due to presynaptic action potentials. The following sigmoid function was used:
| (A-2) |
where is the released GABA, is the presynaptic membrane potential.
Our starting point for the postsynaptic model is the work of Bai et al. [bai] originally developed by Celentano and Wong [cw] to describe the emergence of open channels as the effect of GABA binding to receptors. However, we explicitly show the presence of an essential participant of the model, the ligand differently from in Scheme 1 of the cited paper and our previous work [et]. Obviously, in the model the ligand denotes GABA, whereas denotes the open channels, the notation expressing the fact that two ligand molecules are needed to change the receptor into an open channel:
| (A-12) |
The induced differential equations are the followings:
| (A-13a) | ||||
| (A-13b) | ||||
| (A-13c) | ||||
| (A-13d) | ||||
| (A-13e) | ||||
| (A-13f) | ||||
| (A-13g) | ||||
Furthermore, we have the following conservation equation for the total quantity of channels in any form:
| (A-14) |
Rate constants in the model were set up according to [bakeretal02] to account for the control situation, the propofol treatment and the midazolam treatment:
| Rate Constants (ms-1) | |||
|---|---|---|---|
| Parameters | Control | Propofol | Midazolam |
| 1000/M | 1000/M | 1000/M | |
| 0.103 | 0.056 | 0.056 | |
| 3.0 | 1.62 | 3.0 | |
| 0.2 | 0.12 | 0.2 | |
| 0.026 | 0.014 | 0.026 | |
| 0.0001 | 0.0001 | 0.0001 | |
| 0.4 | 0.4 | 0.4 | |
| 6.0 | 6.0 | 6.0 | |