A model of hyphal tip growth involving microtubule-based transport
Abstract
We propose a simple model for mass transport within a fungal hypha and its subsequent growth. Inspired by the role of microtubule-transported vesicles, we embody the internal dynamics of mass inside a hypha with mutually excluding particles progressing stochastically along a growing one-dimensional lattice. The connection between long range transport of materials for growth, and the resulting extension of the hyphal tip has not previously been addressed in the modelling literature. We derive and analyse mean-field equations for the model and present a phase diagram of its steady state behaviour, which we compare to simulations. We discuss our results in the context of the filamentous fungus, Neurospora crassa.
pacs:
87.10.+e, 87.16.Ac, 87.16.Ka , 05.40.-aBiologically, fungi are distinct from both plants and animals. In addition to their intrinsic interest, they impact immensely on human affairs and on the ecosystem deacon .
Key to the evolutionary success of fungi, is their unique mode of growth. Filamentous fungi grow by the polarised extension of thread-like hyphae, which make up the body, or mycelium, of a fungus. Except for branching (which initiates new hyphae) the site of growth is localised to a single region at the tip of each elongating hypha.
There are many theoretical models for the growth of fungal colonies and of single hyphae (reviewed in Prosser ; bezzi ). Most models of single hypha growth concentrate on bio-mechanics Koch ; GT . Of more interest for us here is the “vesicle supply centre” (VSC) model Garcia ; TKM , in which raw materials for growth are packaged in secretory vesicles and distributed to the hyphal surface from a single “supply centre” (often identified with an organelle complex known as the Spitzenkörper, or apical body 26 ; 27 ) situated within the growing tip. This model is capable of predicting the shape of hyphal tips; but the speed of growth (equivalent to the speed of the VSC) is an input parameter. Moreover, all transport processes are subsumed into a single rate of vesicle supply at the VSC. We are aware of just one model that takes explicit account of transport along the growing hypha Trinci79 . A major interest of this early work, however, was the initiation of branching; these authors did not relate vesicle transport to growth velocity. This latter issue remains poorly understood.
In this work, we propose a simple one-dimensional model which makes an explicit connection between the long-distance transport of building materials along a hypha and the resulting extension as they are delivered to its apical site of growth.
It is a highly idealised model, encompassing many complicated biological processes (many of which are still poorly understood) with two key parameters: the rate at which vesicles enter the system and the efficiency with which they extend the length of the hypha. We demonstrate that by altering these rates, steady states can be attained whereby the hypha is extending at a constant speed while being supplied with materials far behind the tip. Our model has features in common with Trinci79 . Like Trinci79 , we use computer simulations, but unlike Trinci79 , we can also make analytical progress because of recent advances in non-equilibrium statistical physics.
Our model is inspired by the well-known Totally Asymmetric Simple Exclusion Process (TASEP). This is a one-dimensional lattice along which particles progress through stochastic directed motion. No more than one particle may occupy each lattice site at any given time. The TASEP was originally introduced as a lattice model of ribosome motion along mRNA MGP and recent variants have been widely used to model the collective dynamics of molecular motors KL ; PFF ; KKCJ ; Yariv . The application of this and other classes of statistical mechanical models to many kinds of “biological traffic” has recently been reviewed Chowdhury . The TASEP is also widely studied in its own right as a fundamental model of non-equilibrium statistical mechanics Mukamel , in particular as a simple driven diffusive system exhibiting non-equilibrium phase transitions Krug between different macroscopic density and current regimes DDM ; TASEP . Our work contributes to the study of both “biological traffic” and non-equilibrium phase transitions.
In constructing the model, we introduce a new feature into the TASEP: particles reaching the end of the lattice act to extend it. We ask whether a constant input rate far from the growing end of the lattice can generate steady state lattice growth and if so, how the growth velocity depends upon the system parameters. We find that, as in the TASEP, different macroscopic regimes exist in the growing system, with different forms for the growth velocity, and non-equilibrium phase transitions between these regimes. We ask whether these steady states may be related to the growth states observed in fungal hyphae.
To arrive at the model we appeal to the popular belief that the long distance transport mechanism within a hypha is provided by kinesin molecular motors, “walking” along microtubule filaments which run length-ways through the hypha Seiler . Once at the tip, vesicles fuse with the plasma membrane, resulting in localised extension of the hyphal wall Gow ; 26 ; 27 . Fig. 1 summarises this process diagrammatically.
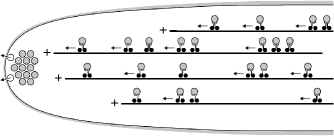
A kinesin motor with cargo progressing toward the tip will likely attach and detach between a number of microtubules on its way, and is then thought to be transferred onto actin filaments at the VSC, before being distributed to the hyphal tip 26 . In our simple model however, we shall bypass the details of the vesicle trajectory and concentrate instead on a coarse-grained description representing what is essentially a continuous directed movement of vesicles toward the hyphal tip. We thus assume here simply that a continuous driving force is applied to the vesicles, all the way to the point of fusion.
We construct the model by supposing that a hypha contains a number of effective microtubule tracks which run continuously to the tip. Each effective microtubule is modelled by a 1-D lattice, with the motors plus cargo represented by particles which progress along the lattice sites. We identify lattice site with the hyphal tip. Particles obey hard-core exclusion and move in one direction only, toward the tip, without overtaking. When particles leave lattice site , they act to extend the lattice through the transformation: particle new site.
We justify our model with a simple order of magnitude test. We identify the lattice repeat with the kinesin step size, 8 nm Bray . In the model organism N. crassa, a 10 m wide hypha growing at C has as extension rate of m per second. It has been estimated that vesicles per second must fuse with the tip to provide enough plasma membrane and other materials to maintain this hyphal extension rate Trinci74 . Thus, the extension of a hypha by one model lattice unit ( nm) is equivalent to the arrival of order 10 vesicles. If each particle delivered to the end contributes to lattice extension, we require equivalent effective microtubules in a typical hyphal cross section. This is acceptably within an order of magnitude of the number of microtubules observed near the Spitzenkor̈per within the growing hyphal tip of N. crassa microtubules .

The model dynamics are specified by the rates at which the following processes occur on the lattice: particles in the bulk hop toward the tip with rate 1; particles enter the lattice far from the tip with rate ; particles detach from site with rate and transform into a new lattice site with rate , as shown schematically in Fig. 2. Thus is the parameter controlling the lattice growth and allows particles to leave the end of the lattice without extending it. Ratio is thus the efficiency with which the hypha extends. Biologically, represents the rate at which secretory vesicles fuse with the hyphal tip, represents the vesicle density far from the tip and allows vesicles to reach the tip without contributing directly to growth.
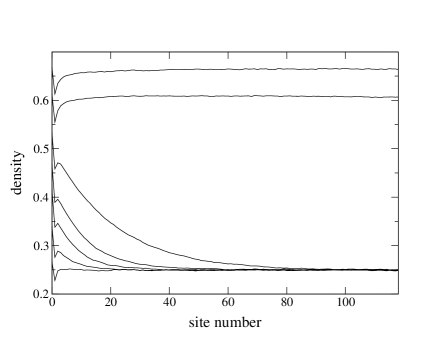
We initially perform Monte Carlo (MC) model simulations by stochastically updating particles on a single lattice according to the above dynamics. After some relaxation time, density profiles are obtained by averaging site occupancies over many updates. We find three different macroscopic behaviours. Results for representative parameter values , and in the range 0.2 to 0.56, are shown in Fig. 3. For high values of one sees profiles that decay from the tip to a -independent bulk density equal to . For the highest values of the density at the tip is . As is lowered the tip density is and the region over which the decay occurs grows in size. For low values of we see distinct profiles where the bulk density is -dependent and is (these profiles were also seen for low , high ). The transition from the high to the low profiles is discontinuous and involves a jump in the bulk density. In the regime of high and (not shown), density profiles with algebraic decays between the boundaries were observed. These are “maximal current” profiles, which we shall discuss shortly.
We now seek an analytical understanding of our observations using a mean-field approximation where we consider the average density, at site , and ignore correlations between the density at different sites DDM . We describe the growth dynamics in a frame of reference co-moving with the growing tip. The tip site is always labelled site . Each time growth occurs, all other site labels must therefore be updated . The change in density at site is the net result of particles entering from the site on the right, departing to the site on the left and shifting right due to index relabelling during growth. Within the mean-field approximation, we have, for ,
| (1) |
Note that the third term is proportional to the rate at which lattice sites are added, which is the tip velocity. Separate equations govern the change in density at sites and , in order to take into account the effect of the particle new site transition:
| (2) | |||||
| (3) |
Eq. 3 differs from the bulk equation only in that should a growth event occur, there is never particle at site after the lattice indices are updated. The final term is hence a decrease in density at site .
Finally, since particles enter at rate , the particle density at the right-hand end is effectively . As the lattice grows, this boundary recedes from the tip with velocity , ultimately corresponding to boundary condition
| (4) |
We seek a steady state solution for this system defined in the reference frame of the tip. Such a solution is characterised by a constant current of particles everywhere through the system, a uniform tip velocity and a density profile which decays to the right boundary condition over a finite length scale, so that the profile is effectively independent of the system size, i.e. we seek solutions to (1–3) with the time derivatives set to zero and obeying the boundary condition (4). We obtain an expression for the particle current through the system in the tip’s stationary frame from Eq. 1
| (5) |
Now, at the tip , whereas far away from the tip (5) yields , so that
| (6) |
which gives the tip velocity in terms of and .
We now restrict ourselves to , and comment on the effects of non-zero later. Since for the tip velocity is simply a result of a flux of particles through the final lattice site, we have and thus from (5) a recurrence relation between the steady state density at any site and that at the previous site:
| (7) |
We define as the stable fixed point value to which this recurrence relation converges:
| (8) |
The decay length to is finite and independent of lattice size, as required. We are now able to solve for all densities in terms of the parameters, and :
| (9) | |||||
| (10) |
and for , is given through (7).
Under our constraint that the bulk density is , we find two types of steady-state solution to the mean-field equations. In these solutions the profiles decay exponentially toward and are distinguished by whether decays to from above or below. For , which we refer to as region I, the decay is from above and for , which we refer to as region II, the decay is from below, from a minimum value at site 2, although there is a peak in the density at site 1.
These steady state solutions only exist in certain parameter regimes. For , instead of iterating to the fixed point (8), the density is fixed for at , with and . The interpretation is that the rate of release of particles at the growing end is no longer large enough to control the input rate. Thus the particle density reaches a maximum value that extends from near the tip throughout the whole lattice and the boundary condition (4) is not satisfied. This is not a steady state solution for our model in the sense we have defined and we describe this region as a “jammed” phase. At the transition to the jammed phase the bulk density jumps discontinuously from to .
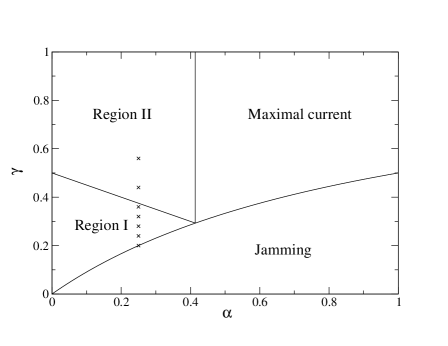
We see from (8) that the maximum value of is , which is obtained when . For , Eq. 1 no longer has real fixed points, and again we do not satisfy the boundary condition (4). We may understand the region bounded by and as a maximal current phase, where the particles have reached a maximum flow rate through the system which is no longer limited by the input and growth rates. In this case, the density profile decays algebraically from the boundary sites and to a bulk density and does not constitute a steady state in our sense since the densities evolve as the system grows.
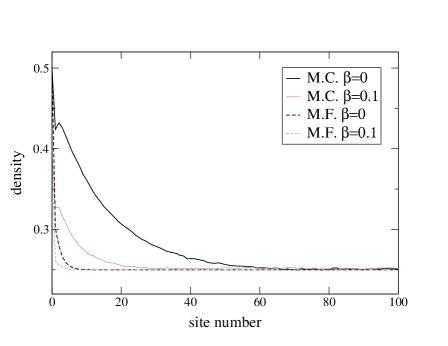
We summarise the results of this mean-field theory with a phase diagram in Fig. 4. Regions I and II correspond to the MC profiles observed for high (Fig. 3), and the jammed region corresponds to the profiles observed for low . Simulations carried out over the whole parameter space revealed that the qualitative behaviour of the mean-field theory is correct, however, the transitions between different profile types do not occur exactly at the predicted mean-field boundaries. In order to compare in more detail the mean field and MC results we plot in Fig. 5 mean-field and simulation profiles in region I. The decay length at the tip is significantly higher in the simulation, by a factor of about 10. The differences between the mean-field theory presented here, and simulations can be attributed to density fluctuations and correlations in the system which are ignored in the mean-field theory. In particular the occupations of sites 1 and 2 are strongly correlated since a growth event vacates both of these sites simultaneously. An improved mean-field theory which takes into account the correlation between sites 1 and 2 predicts a phase diagram with essentially the same phases, but some modified phase boundaries SE .
Simulation and mean-field results for non-zero , Fig. 5, show that does not affect the qualitative profile shape. A detailed analysis of the phase structure with will be given elsewhere SE .
We take particular interest in the steady state phase with a positive density gradient at the tip, and speculate whether the emergence of this high density region may be associated with the vesicle accumulation within the Spitzenkor̈per in the hyphal tip region of a real fungus. For representative parameter values and , MC simulations predict a high density region of nm, correlating (within an order of magnitude) with the length scale of the Spitzenkor̈per in N. crassa of m 26 ; caution .
Note that, in contrast to the vesicle supply centre model Garcia ; TKM , a growth velocity arises naturally for our model. At least within mean-field theory, this velocity is determined in a simple way by the rate at which material is fed into the system far away from the tip and the ratio representing the efficiency with which the cargoes fuse with the tip. It would be of interest to test this prediction experimentally, for example by live-cell imaging the dynamics of motor proteins or cargo fused with the green flourescent protein GFP . In this way the rate of delivery of motor proteins (or cargo) to the hyphal tip could be analysed in relation to the rate of hyphal extension (which can be controlled, for example, by changing the temperature of incubation). Finally we mention that the phase diagram Fig. 4 is related to that of the open boundary TASEP TASEP ; we explore this correspondence in a future publication SE .
We thank Graham Wright for many helpful discussions on fungal biology.
KS is funded by the EPSRC.
References
- (1) J. Deacon, Fungal Biology, edition, Blackwell, 2005
- (2) J. I. Prosser, pp. 319–333, in The Growing Fungus, Eds., N. A. R. Gow and G. M. Gadd, Chapman and Hall, 1995
- (3) M. Bezzi and A. Ciliberto, Comm. Theor. Bio., 8,585, 2003
- (4) A.L. Koch, Adv. Microb. Physiol., 29, pp301–366, 1983
- (5) A. Goriely and M. Tabor J. Theor. Biol., 222, 211, 2003
- (6) S. Bartnicki-Garcia, F. Hergert and G. Gierz, Protoplasma, 153, 46, 1989; G. Gierz and S. Bartnicki-Garcia J. Theor. Biol., 208, 151, 2001.
- (7) S. H. Tindemans, N.Kern and B.M. Mulder J. Theor. Biol., 238, 937, 2006.
- (8) S. D. Harris, N. D. Read, R. W. Robertson, M. Plamann and M. Momary Eukaryot. Cell.,4, 225, 2005.
- (9) A. Virag and S. D. Harris Mycol. Res.,110, 4, 2006.
- (10) J. I. Prosser and A. P. J. Trinci J. Gen. Microbiol., 111, 153, 1979.
- (11) C. T. MacDonald, J. H. Gibbs and A. C. Pipkin, Biopolymers, 6, 1, 1968
- (12) R Lipowsky, S Klumpp and Th M. Nieuwenhuizen Phys. Rev. Lett. 87, 108101, 2001; S Klumpp and R Lipowsky J. Stat. Phys. 113, 233 2003
- (13) A Parmeggiani, T. Franosch and E. Frey Phys. Rev. Lett 90, 086601, 2003; Phys. Rev. E 70, 046101, 2004; M. R. Evans, R. Juhàsz and L. Santen, Phys. Rev. E 68, 026117 2003
- (14) G. A. Klein, K. Kruse, G. Cuniberti and F. Jülicher Phys. Rev. Lett. 94, 108102, 2005
- (15) O. Campas et al. e-prints q-bio.SC/0512018
- (16) D. Chowdhury, A. Schadschneider and K. Nishinari Phys. Life Revs. 2, 318, 2005
- (17) D. Mukamel, pp237–258 in Soft and Fragile Matter: Nonequilibrium Dynamics, Metastability and Flow, Eds M. E. Cates and M. R. Evans, IoP Bristol 2000
- (18) J. Krug Phys. Rev. Lett. 67, 1882, 1991
- (19) B. Derrida, E. Domany and D. Mukamel J. Stat. Phys, 69 667
- (20) B. Derrida, M. R. Evans, V. Hakim and V. Pasquier J. Phys. A, 26, 1493 1993; G. Schütz and E. Domany, J. Stat. Phys., 72, 277, 1993
- (21) N. A. R. Gow, in The Growing Fungus, Eds. N. A. R. Gow and G. M Gadd, Chapman and Hall, 1995, p. 277.
- (22) S. Seiler, M. Plamann and M. Schliwa Curr. Biol., 9, 779, 1999.
- (23) D. Bray Cell Movements, 2nd edition, Garland, 2000.
- (24) A. J. Collinge and A. P. J. Trinci Arch. Microbiol., 99, 353, 1974.
- (25) R. R. Mourinõ-Peŕez, R. W. Roberson and S. Bartnicki-Garcia Fungal. Gen. Biol.,43, 389, 2006.
- (26) I. Schuchhart, D. Aßmann, E. Thines, C. Schuberth and G. Steinberg Mol. Biol. Cell,16, 5191, 2005.
- (27) We should treat this comparison with caution: a real hypha tapers at the tip; this has to be taken into account when comparing observed vesicle concentrations with site occupancy in our strictly 1D model.
- (28) K. E. P. Sugden and M. R. Evans in preparation