Effective affinities in microarray data
Abstract
In the past couple of years several studies have shown that hybridization in Affymetrix DNA microarrays can be rather well understood on the basis of simple models of physical chemistry. In the majority of the cases a Langmuir isotherm was used to fit experimental data. Although there is a general consensus about this approach, some discrepancies between different studies are evident. For instance, some authors have fitted the hybridization affinities from the microarray fluorescent intensities, while others used affinities obtained from melting experiments in solution. The former approach yields fitted affinities that at first sight are only partially consistent with solution values. In this paper we show that this discrepancy exists only superficially: a sufficiently complete model provides effective affinities which are fully consistent with those fitted to experimental data. This link provides new insight on the relevant processes underlying the functioning of DNA microarrays.
pacs:
87.15.-v,82.39.PjI Introduction
In all living cells the genes are transcribed, i.e., copied into messenger RNA (mRNA), at different rates Alberts et al. (2002). These rates depend on the type of cell, on the stage of the cell life cycle and on other external stimuli, like changes of pH, temperature or on the presence of chemicals. The abundance of a specific mRNA defines the so-called gene expression level. It is of central importance to understand when, in which tissue and in which amount a given gene is expressed. This knowledge is for instance crucial in understanding several diseases that originate from deregulations in the gene transcription process, i.e., those pathologies triggered by genes which are overexpressed or underexpressed.
DNA microarrays have become pivotal devices in molecular biology as they allow a genome-wide screening of gene expression levels in a single experiment. Both commercial and home made microarrays are nowadays available. One of the leading companies in the DNA-microarray market is Affymetrix, which produces high-density oligonucleotide microarrays Lipshutz et al. (1999). In Affymetrix arrays, photolitographic techniques are used to grow on a solid substrate single-stranded DNA sequences which are 25 nucleotides long; these are normally referred to as probes. The array is placed in contact with a solution containing RNA molecules, i.e., the targets, extracted from biological samples. Those targets that are complementary to probe sequences tend to bind to these, a process known as hybridization. Biotin molecules are attached to a fraction of the nucleotides in the target sequences. Once hybridization has occurred and the unbound targets are washed away, streptavidin molecules, which carry fluorescent labels, are added to the solution. The latter bind with high affinity to the biotin so that the amount of hybridized probe-target duplexes can be determined experimentally by optical measurements.
Two specific aspects of Affymetrix arrays are: 1) Several probes are complementary to the same target molecule (these probes form the so-called probe set) and 2) Each perfect matching (PM) probe has a partner probe which differs by a single nucleotide in the middle position, the so-called mismatch (MM) probe. The use of multiple probes for the same target RNA increases the reliability of the determination of gene expression levels in Affymetrix arrays, which are obtained from simultaneous measurements of several fluorescent signals. The signals measured from MM probes can be used as test for the quality of the hybridization experiment. Usually, one expects that PM probes give a stronger signal than the corresponding MM probes. However, “bright mismatches”, i.e., higher signals from MM than PM probes, are observed quite frequently Naef and Magnasco (2003).
The hybridization of complementary strands in solution, or the reverse process of DNA/RNA melting, has been widely investigated in the past years Bloomfield et al. (2000). Measurements of melting temperatures of short oligonucleotides have yielded estimates of the enthalpy and entropy differences and between a double helix and the two separate strands. It turns out that and can be well approximated by a sum over local terms depending on pairs of neighboring nucleotides, plus eventual boundary terms. This defines the so-called nearest-neighbor model Bloomfield et al. (2000). Table 1 gives an example of nearest-neighbor free energy parameters obtained from measurements of melting temperatures of DNA/RNA duplexes in solution. The free energy differences are obtained from , assuming that the experimentally measured and are temperature independent.
| Sequence | (kcal/mole) | Sequence | (kcal/mole) |
|---|---|---|---|
| 0.83 | 1.99 | ||
| 1.62 | 0.70 | ||
| 0.70 | 1.92 | ||
| 1.32 | 0.73 | ||
| 1.21 | 2.56 | ||
| 2.65 | 0.93 | ||
| 0.42 | 1.31 | ||
| 1.37 | -0.08 |
The hybridization process in microarrays is not identical to that in solution, as one of the two strands is surface-bound. A review of recent work on the hybridization on surface immobilized DNA Levicky and Hogan (2005) shows that the rate constants for hybridization are lower than those predicted by the nearest neighbor model in solution. The comparison was done with experiments with a single species target and probes of equal length Okahata et al. (1998); Nelson et al. (2001); Peterson et al. (2002).
Several studies Naef and Magnasco (2003); Vainrub and Pettitt (2002); deu ; Held et al. (2003); Halperin et al. (2004); Hagan and Chakraborty (2004); bur recently discussed the role of the Langmuir isotherm and variants thereof in connection with DNA microarrays. Research toward a physics-based modeling of hybridization in Affymetrix arrays can roughly be divided into two approaches. The first approach is to identify empirical functions with many degrees of freedom, that are fitted to experimental data Naef and Magnasco (2003); Binder and Preibisch (2005). The other approach is molecular-based and employs the hybridization energies in solution; it then requires a rescaling of parameters like the effective temperature Held et al. (2003); Carlon and Heim (2006). The aim of this paper is to link these two apparently different viewpoints. We shall show indeed that, when the appropriate quantities are compared, i.e. the effective affinities, the two models yield fully consistent results.
This paper is organized as follows: Sec. II reanalyzes the binding affinities as introduced by Naef and Magnasco Naef and Magnasco (2003) and Binder and Preibisch Binder and Preibisch (2005). We carry out a sensitivity analysis and show which features are robust and which are sensitive. In Sec. III, effective affinities are calculated using a molecular model based on the binding free energies of Sugimoto et al.Sugimoto et al. (1995) and the extension by Carlon and Heim Carlon and Heim (2006). From this model, the influence of different additions to the molecular model on the effective affinities is calculated and analyzed. Section IV concludes the paper and summarizes the main results.

II Effective affinities for Affymetrix arrays
We turn now to the determination of the effective affinities from the analysis of Affymetrix data. We follow here and further the procedure originally introduced by Naef and Magnasco Naef and Magnasco (2003) and extended more recently by Binder and Preibisch Binder and Preibisch (2005).
Naef and Magnasco fit the brightness of perfect-matching probes as a function of their sequence composition:
| (1) |
where is the letter index and the position along the probe. is a boolean variable equal to 1 if the probe sequence has letter at position and 0 otherwise, and thus are per-site, per-letter affinities. The median of the PM brightnesses [RNA] is used in this expression as a surrogate for the RNA concentration, which is not known for most Affymetrix data.
In Affymetrix experiments, the brightness will saturate, once the majority of the probes are bound to targets. Capturing such saturation requires the use of Langmuir isotherms; the approach above (eq. (1)) neglects saturation effects, and hence is only expected to work in the so-called Henry regime Lyklema (1991) signified by brightnesses much lower than the maximal value. Since only few probes reach saturation, neglecting saturation is justifiable.
The experimentally measured fluorescence intensity of a probe with sequence does not approach zero at zero concentration of the matching target: there is a background signal, probably due to non-specific binding. To take this into consideration, we distinguish two contributions to the fluorescence intensity: a constant background intensity and the brightness due to specific binding:
| (2) |
in which is the brightness as in eq. (1). We tried different background subtractions schemes in order to test the robustness of the data. Fig. 1 shows the position-dependent affinities obtained from fitting the experimental data to eqs. (1) and (2) for background intensities of , and (constant background level). In the fit, the distance of the data to the model was minimized in the logarithmic scale. We note that although the shape of the fitted position-dependent affinities remain the same in the three cases, the amplitudes vary by a factor of . In all cases the shape is consistent with what was found in Refs. Naef and Magnasco (2003); Binder and Preibisch (2005): the position-dependent affinities are approximately symmetrical with respect to the central position of the probe () and the highest affinity is for nucleotides C and the lowest for A in the probe sequence. The affinities for the G and T bases are almost degenerate and show less position dependence than the affinities for the C and A bases.
In the case of we have a rather low signal. This is somehow expected as in that case the non-specific part of the signal may dominate, which induces a loss of specificity. When higher values of are taken, a non-trivial signal starts to emerge. As increases, the amplitude of the strongest effective affinity increases to and for respectively and .

In Fig. 2 we plot the fitted affinities for probe sets with an average intensity above . This case corresponds to signals well above the background level and thus the results should be weakly dependent of the value of chosen, as is indeed the case.
As mentioned above, using the median of the PM brightnesses [RNA] as an estimate for the RNA concentration is the only thing one can do in the absence of knowledge of its true value. Affymetrix, however, performed a set of experiments in which some target sequences are added in solution (spiked-in) at a known concentration. The results, known as the Latin square data set, are publicly available from the Affymetrix web site aff . We used these data to refit the effective affinities from eq. (1), using the true target concentration of sequence , rather than the median of the intensities. Due to the large number of parameters, this procedure yields typically values of that are too noisy. To limit the number of fitting parameters we therefore have fitted only at some fixed positions and taken for the other values of a linear interpolation between the two fitted numbers. Note that the Latin square set also contains a series of reference intensities measured in absence of the transcripts in solution (i.e. ), a procedure that yields a direct estimate of the background signal . The position-dependent affinities obtained from the fitting of the Latin square set are shown in Fig. 3. The results, although still somewhat noisy, follow the general trend already shown in Figs. 1 and 2.

The fact that the position-dependent affinities are lower for G than for C and for A than for T is consistent with the hybridization data in solution, as pointed out in Ref. car . This apparent “asymmetry” is due to the asymmetry between DNA strands of the surface-bound probes and the RNA strands of the target molecules in solution.
The fact that the effective affinities for G and T are close is quite surprising, given the clear differences in binding free energies in solution; we will argue below that this is due to hybridization between RNA target molecules in solution.
III Effective affinities resulting from molecular based models
To obtain more insight into the relation between the hybridization free energies of Table 1 and the effective affinities of Refs. Naef and Magnasco (2003); Binder and Preibisch (2005) and which we analyzed in the previous section, we extract effective affinities from a model which was recently proposed by two of us Carlon and Heim (2006).
This model is based on ideas from Held et al.Held et al. (2003). As it uses as input the binding free energies between DNA and RNA strands in solution reported in Table 1, we will refer to it as the molecular-based model. Additionally, it incorporates the effect of binding in solution of RNA to RNA in an approximate way, fitted to the intensities measured on an Affymetrix chip. The intensity of sequence is assumed to be proportional to the fraction of hybridized probes at the surface, described by a Langmuir model. In detail, it is given by Carlon and Heim (2006)
| (3) |
where is the total concentration of targets with sequence in solution, is the partition sum over states in which target is bound to the probe, and is the fraction of targets in solution which are free, and not hybridized in solution.

In the model of Ref. Carlon and Heim (2006)
| (4) |
where is the inverse temperature, and is the total binding free energy for a perfectly formed helix of 25 base pairs between the RNA target and DNA probe. This binding free energy is described by
| (5) |
As before, is a boolean variable equal to 1 if the probe sequence has letter at position and 0 otherwise. Thus, the sum in eq. (5) runs over all 24 stacking parameters , which depend on the identity of two neighboring nucleotides and in the surface-bound DNA strand. represents a helix initiation cost Bloomfield et al. (2000). For the stacking parameters the model uses RNA/DNA free energies given in Table 1, as obtained from experiments in solution Sugimoto et al. (1995). Note that, differently from the approach of Refs. Naef and Magnasco (2003) and Binder and Preibisch (2005), the free energies used here are position-independent. In Ref. Carlon and Heim (2006), the inverse temperature in eq (4) is taken as a fitting parameter.
We stress that in Ref. Carlon and Heim (2006) the hybridization free energy was taken at C, while an Affymetrix hybridization experiment is performed at C, which is the value we consider here (see Table 1). Although the temperature differs by only C, the ’s on average differ by about , since and are rather close. We took the sequences of the Latin square set (25 nucleotides of length) and generated of each sequence at both temperatures. A plot of vs. shows that the values are narrowly distributed along a straight line. This implies that a difference between the two choices of parameters can be reabsorbed in a rescaling of in eq. (4).
Of practical interest is the total concentration of targets with sequence . Due to hybridization of single-stranded RNA in the solution, the concentration of free targets, which can bind to the probes, is lower than the total concentration of targets in solution. In the model of Ref. Carlon and Heim (2006), this is taken into account by reducing the total concentration in solution by a factor of given by
| (6) |
where and are fitting parameters and is the (sequence dependent) RNA/RNA binding free energy for duplex formation in solution, taken from Ref. Bloomfield et al. (2000). Note that also is highly sequence-dependent: CG-rich targets will have high affinity to the complementary surface bound probes, but will also have a strong tendency to hybridize in solution. It has been shown that a unique choice (i.e. probe-independent) of the parameters , , and fits the experimental data well Carlon and Heim (2006).
There are many similarities, and also some discrepancies, between the intensities in the Naef and Magnasco (NM) approach eq. (2) and in the molecular-based model eq. (3). The binding free energy in the NM approach is captured in the summation on the right-hand-side of eq. (1), which is very similar to the summation in eq. (5) in the molecular-based model. NM uses a summation over single base pairs with position-dependent affinities, while the molecular-based model uses (in eq. (5)) a summation over pairs of base pairs (allowing for stacking energies), with a position-independent strength. As we already mentioned, NM does not feature saturation, while the molecular-based model does through the denominator in eq. (3). Finally, the clear position-dependence in the effective affinities obtained with the NM approach is not included in the molecular-based model of Ref. Carlon and Heim (2006).
III.1 Extending the molecular-based model
In this work, we introduce several extensions to the latter model. These extensions will cause position-dependence in the effective affinities, without ad-hoc modifications to the stacking free energy parameters. Most of these extensions are related to the fact that both target and probe are polydisperse in length, and that the duplex can fluctuate and partially unzip. We will first explain these extensions, and then discuss their effect later.
-
•
Unzipping. Besides the configuration in which the target is bound to the probe over its full length, other configurations occur in which the target covers only part of the probe. This is taken into account by a ”Zipper”-model. As a result, the partition sum does not only contain a single term , but is a summation over many terms, each of which given by eq. (5), but in which the index runs from the first bound pair to the last bound pair . This idea is visualized in Figure 4.
-
•
Probe length dispersity. During the production process of the Affymetrix chips, the probability that the probe grows by an extra nucleotide is only around Forman et al. . This means that the fraction of probes which reach the final full length of 25 nucleotides is . The fraction of incomplete probes reaching a length equals . We have included the effect of probe length dispersity by including these probabilities in the calculation. The intensity is therefore equal to , where is the Langmuir isotherm corresponding to a probe of length .
-
•
Non-specific binding. Even in Affymetrix experiments where no perfect matching targets are present, the intensity does not fall well below 0.5% of the maximal intensity. We attribute this to non-specific binding to the probes. To account for the non-specific binding, we include in our model a constant sequence-independent background intensity .
-
•
Tail repulsion. The RNA-target molecules often extend beyond the 25 base pairs of the probe; the average target length is 50 base pairs. The tail of the target which sticks out from the base of the probe is hindered significantly by the surface (see Figure 4). This causes an entropic repulsion between the target and the surface, lowering the intensity. The mathematics of this effect is presented in Appendix A. This effect is not sequence-dependent and the parameters in eq. (3) can therefore be multiplied by a constant factor , given in eq. (11).
-
•
Fluorescent labels. Due to the fact that in the experiments only the U and C nucleotides can have a label, the fluorescence intensity will scale linearly with the number of U and C nucleotides, which obviously depends on the sequence. We therefore multiplied each Langmuir isotherm by for a factor , in which is the fraction of U and C in the target sequence. We assumed that the target is simply composed of 25-mers.
III.2 Results of the model calculations
We generated 100,000 different random sequences of 25 nucleotides each. For each sequence , we also selected a concentration , with a minimal value of picomolar and 1 nanomolar (the typical range of target concentrations in Affymetrix arrays); the logarithm of these concentrations is drawn from a uniform distribution . For each sequence , the intensity is calculated using the molecular-based model, eq. (3), with the extension just described. The parameters entering this equation are the stacking free energies given in Table 1, as well as the parameter reflecting the reduction of the total concentration of free targets in solution; this latter (sequence-dependent) parameter uses the RNA/RNA binding free energies for duplex formation in solution, taken from Ref. Bloomfield et al. (2000). The modifications in the molecular-based model as compared to the model in Ref.Carlon and Heim (2006), as well as the different choice of free energy parameters ( vs ) require a refitting of the effective inverse temperature and a concentration , which yielded and , with kcal/mole. The fitting procedure for these two parameters follows the procedure of Carlon and Heim (2006).
In the experimental Affymetrix data set, the average intensity is around 3% of the maximal intensity. In all our simulations, we adjusted the temperature to reproduce this average intensity. The resulting temperatures range from 494 K to 550 K. There is still a gap between the experimental temperature of 318 K, but including the effects mentioned above has significantly decreased this gap in the original molecular-based model, where the effective temperature was 700 K Carlon and Heim (2006); in turn the latter model had already a much more realistic effective temperature than the Held model where the effective temperature exceeded 2000 K Held et al. (2003). To obtain the effective affinities associated to the molecular-based model, we minimize the difference between the intensity as predicted by the molecular model in eq. (3) and the intensity resulting from the effective affinities and given by
| (7) |
in analogy to eq. (1). More precisely, the effective affinities result from a minimization of the sum over all 100,000 sequences of the the squared difference between the logarithm of the intensity and the logarithm of the intensity resulting from the effective affinities.
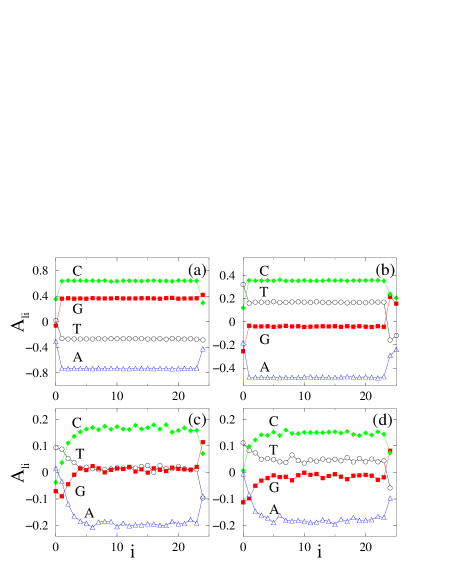
The first data set comprises a simple two-state model, in which a target is either free in solution, or fully bound to a probe. Hybridization in solution is not taken into account, i.e., . The results are shown in Figure 5(a). The effective affinities do not depend on the position, apart from the two edge nucleotides which enter in only one pair of neighboring base pairs. (See eq. (5)). Note that the affinities increase with the ordering , as expected from the values of the free energies of Table 1.
Next, the hybridization in solution is taken into account by using two extra parameters and which have the values of and with kcal/mole, respectively. Still the effective affinities are not position dependent, see Figure 5(b). However, the order of the curves has changed: .
Fig. 5(c) shows the effective affinities when polydispersity of the probe length distribution and the effect that a duplex can zip open has been taking into account. These two effects lead to position-dependent effective affinities. The effect on the side of the microarray surface is larger than that on the solution side. Furthermore, the effective affinities of G en T have become more alike.
The last panel of Figure 5 shows the effective affinities when also the effect of noise, entropy of the tails, and the fact that only U and C carry fluorescent labels are taken into account. The biggest effect is that the effective temperature is lowered. Furthermore, the sequence has become , in agreement with the order of effective affinities observed in experiment (see Figure. 2). Note also that the scale of amplitudes of the effective affinities ranges from about to (see Fig. 5(c-d)). This is fully consistent with the values obtained in Section II.
IV Conclusions
In this paper we have analyzed the relation between the effective affinities as originally introduced by Naef and Magnasco Naef and Magnasco (2003) and those obtained from a molecular-based model Carlon and Heim (2006), which uses hybridization free energies in solution. We show that these two models yield very similar effective affinities. This implies that free energies in solution are adequate parameters to describe hybridization in Affymetrix microarrays, at least if an effective temperature is used.
Firstly, the fact that the effective affinity for G is lower than that for C and that the affinity for A is lower than that for T is consistent with hybridization data in solution, as pointed out in Refs. Binder and Preibisch (2005); car . Here, we have shown the role of target-target hybridization in solution, which in the molecular-based approach Carlon and Heim (2006) is described by a parameter (see eq. (6)). The effect of is of diminishing the differences in the effective affinities between different nucleotides so to make the effective affinities for G and T almost “degenerate” (see Fig. 5). This is consistent with the data of Naef and Magnasco Naef and Magnasco (2003), Binder and Preibisch Binder and Preibisch (2005) and our results of Sec. II. The basic physics behind this effect is quite clear. The small difference between the effective affinities for G and T, in spite of the large difference in binding free energies in solution between these two nucleotides, is caused by the fact that G-rich sequences tend to hybridize strongly in solution, thereby diminishing their concentration available for binding to the probes.
We note that the calculation of the previous section yield effective affinities which are position-dependent, mostly caused by the ability of the probe-target complex to partly open up at the ends. To a lesser extent, also the target-surface repulsion and the polydispersity of the probes play a role. The profiles of the effective affinities calculated in Sec. II are somewhat smoother than those deduced from the molecular-based model. This difference is however small. The most important aspect of our analysis is however that the molecular-based model 1) reproduces the degeneracy between the affinities of G and T 2) yield amplitudes for the affinities quantitatively close to those calculated in Sec. II.
We finally comment on other possible ways of linking effective affinities to hybridization free energies obtained from melting experiments in solution. A recent study Ref. Binder et al. (2004) attributed the differences between the two quantities to the effect of biotin molecules on the binding. This is an alternative point of view compared to our approach which emphasizes instead the effect of hybridization in solution between partially complementary single stranded RNA molecules. In this respect it would be interesting if measurements of melting temperatures experiments of biotinilated RNA and DNA duplexes in solution similar to that of Ref. Sugimoto et al. (1995) could be performed. These experiments would allow to quantify the effect of biotin on binding. To our knowledge such experiments have not yet been performed.
Acknowledgements.
We acknowledge financial support from the Van Gogh Programme d’Actions Intégrées (PAI) 08505PB of the French Ministry of Foreign Affairs and NWO grant 62403735.
Appendix A Entropic repulsion between substrate and target tail
We model the single-stranded DNA segment as a freely jointed chain with Kuhn length . The probability distribution that a segment of Kuhn steps extends to a distance from its origin is given by a Gaussian distribution:
| (8) |
To determine the number of polymers starting from a height above the surface and not crossing the wall, we use the method of mirror images. Using the same configuration as in Figure 6: the fraction of walks of length originating from and terminating at is equal to . A part of these cross the wall. This fraction is equal to , i.e. the number of walks originating in and terminating in . Therefore the fraction of walks of total length starting in and terminating in and which do not cross the wall is given by the difference:
| (9) | |||||
where Erf(x) denotes the error function defined as
| (10) |
We recall that the Kuhn length is related to the persistence length as and that for single stranded DNA bp.
We sum next over all possible tail lengths. Before hybridization the target molecules are fragmented at random locations, with an average fragment length of about bp. We find thus:
| (11) |
in which is the probability for chain continuation, and is the ratio of the spacer distance and the length of a single base pair.
References
- Alberts et al. (2002) B. Alberts et al., Molecular Biology of the Cell (Garland Science, New York, 2002).
- Lipshutz et al. (1999) R. J. Lipshutz et al., Nature 21, 20 (1999).
- Naef and Magnasco (2003) F. Naef and M. O. Magnasco, Phys. Rev. E 68, 011906 (2003).
- Bloomfield et al. (2000) V. A. Bloomfield, D. M. Crothers, and I. Tinoco, Jr., Nucleic Acids Structures, Properties and Functions (University Science Books, Mill Valley, 2000).
- Sugimoto et al. (1995) N. Sugimoto et al., Biochemistry 34, 11211 (1995).
- Levicky and Hogan (2005) R. Levicky and A. Hogan, Trends Biotechnol. 23, 143 (2005).
- Okahata et al. (1998) Y. Okahata et al., Anal. Chem. 70, 1288 (1998).
- Nelson et al. (2001) B. P. Nelson et al., Anal. Chem. 73, 1 (2001).
- Peterson et al. (2002) A. W. Peterson, L. K. Wolf, and R. M. Georgiadis, J. Am. Chem. Soc. 124, 14601 (2002).
- Vainrub and Pettitt (2002) A. Vainrub and B. M. Pettitt, Phys. Rev. E 66, 041905 (2002).
- (11) J. M. Deutsch and S. Liang and O. Narayan, “Modeling of microarray data with zippering”, preprint q-bio.BM/0406039.
- Held et al. (2003) G. A. Held, G. Grinstein, and Y. Tu, Proc. Natl. Acad. Sci. 100, 7575 (2003).
- Halperin et al. (2004) A. Halperin, A. Buhot, and E. B. Zhulina, Biophys. J. 86, 718 (2004).
- Hagan and Chakraborty (2004) M. F. Hagan and A. K. Chakraborty, J. Chem. Phys. 120, 4958 (2004).
- (15) C. J. Burden and Y. Pittelkow and S. R. Wilson, “An adsorption model of hybridization behaviour on oligonucleotide microarrays”, preprint q-bio.BM/0411005.
- Binder and Preibisch (2005) H. Binder and S. Preibisch, Biophys. J. 89, 337 (2005).
- Carlon and Heim (2006) E. Carlon and T. Heim, Physica A 362, 433 (2006).
- Lyklema (1991) J. Lyklema, Fundamentals of interface and colloid science, Fundamentals, vol. I (Academic Press, London, 1991).
- (19) www.affymetrix.com/analysis/download_center2.affx.
- (20) E. Carlon, T. Heim, J. Klein Wolterink and G. T. Barkema, “Comment on: Solving the riddle of the bright mismatches: Labeling and effective binding in oligonucleotide arrays by F. Naef and M. Magnasco”, Phys. Rev. E (in press).
- (21) J. E. Forman et al., ACS Symposium Series 682, 206 (1998).
- Binder et al. (2004) H. Binder, T. Kirsten, I. L. Hofacker, P. F. Stadler, and M. Loeffer, J. Phys. Chem. B 108, 18015 (2004).