Cross-species analysis of biological networks by Bayesian alignment
Complex interactions between genes or proteins contribute a substantial part to phenotypic evolution. Here we develop an evolutionarily grounded method for the cross-species analysis of interaction networks by alignment, which maps bona fide functional relationships between genes in different organisms. Network alignment is based on a scoring function measuring mutual similarities between networks taking into account their interaction patterns as well as sequence similarities between their nodes. High-scoring alignments and optimal alignment parameters are inferred by a systematic Bayesian analysis. We apply this method to analyze the evolution of co-expression networks between human and mouse. We find evidence for significant conservation of gene expression clusters and give network-based predictions of gene function. We discuss examples where cross-species functional relationships between genes do not concur with sequence similarity.
Besides a wealth of genomic sequence information, molecular biology is accumulating more and more data probing the interactions between genes or proteins. Examples are regulatory interactions, where the expression level of one gene influences the expression of another gene, or interactions between proteins, where pairs of proteins bind to form dimers or multimers. Interactions between genes or their products are crucial for our understanding of biological functions. With the advent of experimental high-throughput methods, large-scale datasets of different organisms are becoming available, which can be analyzed by systematic cross-species comparison.
This paper is devoted to developing an evolutionary rationale for biological network analysis. Since the interactions between genes are encoded in their genomic sequences, this may seem a rather straightforward generalization of established concepts in sequence analysis: evolution acts as a divergent process on the constituents of the network, which gradually reduces cross-species correlations of the network structure. Detecting these correlations requires an alignment procedure which can map functional units as network structures conserved by evolution as well as estimate the degree of divergence between species.
However, interaction networks evolve in a more heterogeneous and a more correlated way than sequences, which makes their cross-species comparison a considerably more challenging task. The interactions between proteins, for example, depend on the properties of a specific functional binding domain, which may evolve in a different way than the remainder of the protein sequence, with correlations to its binding domain in a different protein. Regulatory interactions can change by the evolution of regulatory DNA, which is expected to be different from that of coding DNA. Moreover, many sequence changes in a gene may be irrelevant for its interactions measured in a network. This leads us to treat the evolution of the interactions within a network, i.e., its link dynamics, and the overall sequence evolution of its constituents, the node dynamics, as two independent modes of evolution. We describe these modes by simplified stochastic models and infer their relative contribution to network evolution by cross-species comparison. This dynamics is also quite heterogeneous across the network, and we use the models of link and node dynamics to quantify the evolutionary conservation of putatively functional network modules.
Our evolutionary analysis is based on the alignment of networks, i.e., a mapping between their nodes, which also induces a mapping of their links. In the Theory part of this paper, we develop a statistical theory of alignment for biological networks. We introduce a scoring designed to detect local functional correlations, which uses both the similarities of mapped link pairs and of node pairs. This scoring derives from the underlying link and node dynamics.
Various alignment and scoring procedures for biological networks have been discussed in recent articles. One type of methods restricts the alignment to mutually homologous nodes, i.e, gene pairs with significant sequence similarity in different species. In this way, clusters of conserved interactions have been found in gene co-expression networks [1, 2] and in protein interaction networks [3, 4]. A complementary approach is to align networks only by their link overlap, independently of node homology. Network motifs [5, 6] defined by families of mutually similar subgraphs in a larger network have been identified in this way [7] as well as the similarities between regulatory networks of different phages [8]. These methods have been combined with their relative weights fixed ad hoc in ref. [9]. A third method called Pathblast [10, 11] evaluates the link similarity between networks along paths of connected nodes, using sequence alignment algorithms. It has been applied to cross-species comparisons of protein interaction networks [10]. Similarly, the flux along the shortest paths in regulatory networks has been compared across species [8]. Metabolic networks with few cycles have been analyzed by subtree comparison [12].
From an evolutionary point of view, these methods are heuristics containing different assumptions on the underlying link and node dynamics. Homology-based alignments are appropriate if the sequence divergence between the species compared is sufficiently small so that all pairs of functionally related nodes can be mapped by sequence homology. However, genes with entirely unrelated sequence may take on a similar function in different organisms, and hence have a similar position in the two networks. (Such so-called non-orthologous gene displacements are well-known in metabolic networks [13, 14, 15].) On the other hand, alignments by link similarity alone altogether ignore the evolutionary information of the node sequences. Path-based alignment algorithms are well suited to networks with predominantly linear biological pathways such as signal-transduction chains. In other situations, however, it may be difficult to link the scoring parameters to evolutionary rates of link and node changes.
The alignment method presented in this paper is grounded on statistical models for the evolution of links and nodes. Alignments are constructed from link and node similarity treated on an equal footing, the relative weight of these score contributions is determined systematically by a Bayesian parameter inference. Nodes without significant sequence similarity are aligned if their link patterns are sufficiently similar. Conversely, nodes are not aligned despite their sequence similarity, if their links, and hence their putative functional role, show a strong divergence between the two networks. Our method is rather general and can be applied both to networks with binary link strengths (as in the current large-throughput data for protein interactions) and to networks with continuous link strength (such as the co-expression data used in this study).
As an algorithmic problem, network alignment is clearly more challenging than sequence alignment, which can be solved by dynamic programming [16, 17]. Already simpler problems such as matching two graphs by determining the largest common subgraph are -hard [18], which implies there is probably no polynomial-time algorithm. We have developed an efficient heuristic, by which network alignment is mapped onto to a generalized quadratic assignment problem, which in turn can be solved by iteration of a linear problem [19].
In the second part of the paper, we present a cross-species comparison of co-expression networks of H. sapiens and M. musculus as an example application of our method. In this type of networks, the link between a pair of genes is given by the correlation coefficient of their expression profiles measured on an mRNA microarray chip. We show that correlation networks are well-suited for cross-species comparison: they are robust datasets even if individual expression levels cannot be compared with each other since the experimental conditions differ between species. The evolution of these networks results from the evolution of regulatory interactions between genes and from loss and gain of genes. High-scoring alignments between expression networks in human and mouse provide a quantitative measure of divergence between the two species. We find conserved network structures, related to clusters of co-expressed genes; similar findings are reported in refs. [1] and [4]. However, the alignment found here differs from mere sequence homology. This leads to network-based predictions of gene functions, including functional innovations such as non-orthologous gene displacements.
Theory
Graphs and graph alignments. A graph is a set of nodes with links between pairs of nodes. The graphs considered here are labeled by gene name, which is denoted by the node index , and are thus uniquely represented by the adjacency matrix . A graph is called binary if links are either absent () or present () and weighted if the link strengths take continuous values. The special case of a symmetric adjacency matrix is used to describe undirected graphs. For example, current high-throughput datasets of protein interactions, which do not specify the interaction strength, produce binary undirected graphs. Gene expression networks, whose links denote the mutual correlation coefficient between expression patterns of two genes, are weighted graphs with .
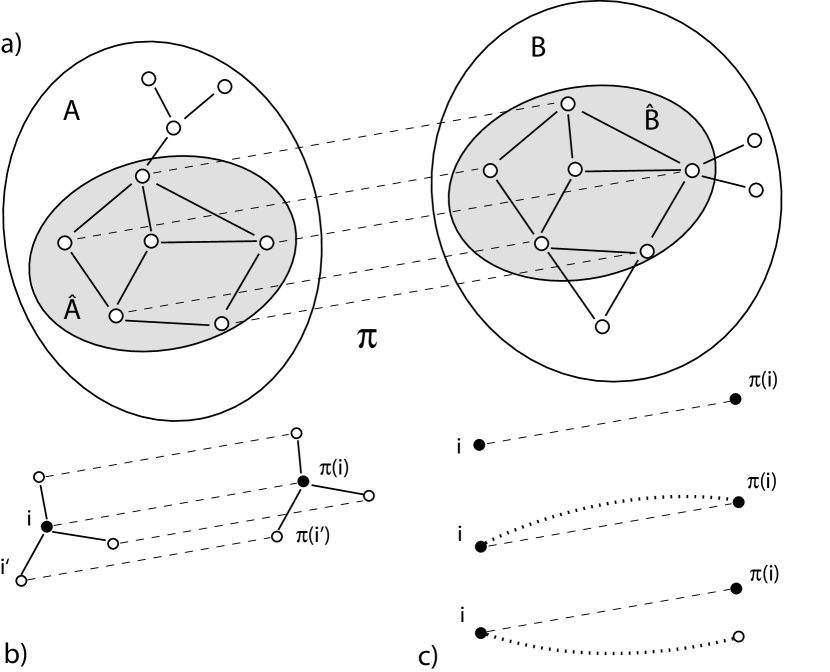
A local alignment between two graphs and is defined as a mapping between two subgraphs and as shown in Fig. 1(a). The alignments of networks discussed in this paper are designed to display cross-species functional relationships between aligned node pairs. Due to gain or loss of genes in either species, not every gene in one network has a functional equivalent in the other, and the alignment algorithm has to determine the aligned subnetworks and with significant correlations. For the sake of algorithmic simplicity, we will discuss here only one-to-one mappings , which is appropriate for most gene pairs but neglects multi-valued functional relationships induced for some genes by gene duplications.
Link dynamics and link score. An important statistical characteristic of a network is the link distribution , giving the probability that the link between a randomly chosen pair of nodes takes on the value . The evolution of the link distribution can be modeled by a simple stochastic process, from which our link similarity scoring of an alignment is derived. In a binary network, the simplest form of link dynamics is a Markov process, which is fully determined by the rates of formation and loss of single links. Generalizing this dynamic to continuous links leads to a diffusion equation of the form
| (1) |
The two terms on the r.h.s. describe the stochastic turnover and the average relaxation of links with coefficient functions and , respectively. For mutual expression correlations between two genes in a microarray, this form can be derived from a stochastic model for loss and gain of regulatory interactions, each of which affects a random subset of the experiments, resp. cell types. The cross-species correlations in pairs of evolutionarily related links are contained in the joint distribution , which we write in the form
| (2) |
defining the log-likelihood link similarity score . For binary links, this has a bilinear form
| (3) |
with the link match reward depending on the evolutionary distance between the species. The additive constant is given by the normalization of the probability distributions in (2). For continuous links, we write the joint distribution as , where is the conditional distribution of link strengths evolved from an initial strength over the evolutionary distance between the two species compared. For short evolutionary distances and for a link evolution of the form (1), this distribution is well approximated by a Gaussian, . For large evolutionary distances, it can be shown that the score has again the asymptotic form (3). Given datasets of two networks and , the distribution , can be estimated from the frequency of link strengths resp. in one species, and from the frequency of link pairs involving orthologous gene pairs and . Hence, the score function defined by eq. (2) can be inferred without specific assumptions on the underlying link dynamics. For the example discussed below, this empirical link score turns out to be in remarkable agreement with the form (3) predicted by the link diffusion model.
This scoring of individual link pairs is readily generalized to pairs of networks with a given local alignment . Assuming that aligned link pairs follow the distribution independently from each other and unaligned links and follow the distributions and , respectively, we obtain the distribution of graph pairs for given ,
| (4) |
where , has a similar product form, and the network link score is a sum of local contributions of aligned node pairs,
| (5) |
as shown in Fig. 1(b). For co-expression networks, there are correlations between links within one network. These occur since the number of independent measurements, , is smaller than the number of genes , and are taken into account by the overall scale of the link score (i.e, ).
The relative evolutionary conservation of a given pair of aligned links within the network is measured by its excess link score
| (6) |
i.e., the difference of its link score and the average over all aligned link pairs with either strength fixed, , or strength fixed. The relative conservation of link patterns between a pair of aligned nodes is then given by the local excess link score
| (7) |
These measures will become important for the identification of network clusters and their evolutionary conservation.
Node dynamics and node score. The pairwise similarity between genes in networks and is given by a matrix , whose entries quantify, for example, the overall sequence similarity between the gene sequences and or a biochemical similarity between the corresponding proteins. The sequence similarity between functionally related genes decays over time due to local mutations, but is also affected by large-scale genomic events such as gene duplications, gene loss, or recruitment of new genes into a functional context. Due to these processes, both networks contain a fraction of nodes with little or no significant sequence similarity to any node in the other network, which should nevertheless be included in the alignment if their local link score suggests significant functional cross-species relationships. Moreover, functional swaps between genes induce functional correlations between genes that are unrelated by sequence and, at the same time, reduce correlations between other genes despite their sequence similarity. A prominent example is non-orthologous gene displacements [13, 14, 15]. It is these processes that cause the network alignment to deviate for some nodes from a map based only on sequence homology. Functional swaps can be regarded as part of the link evolution, which in co-expression networks leads to coherent link changes at the affected nodes. However, these swaps are likely to involve selection and are not captured by the independent link dynamics discussed above. Hence, we include them here as a separate type of process with its own evolutionary rate.
The resulting statistics of node similarity can be described by the distribution of pairwise similarity coefficients between unaligned nodes, , between pairs of aligned nodes, , and between one aligned node and nodes other than its alignment partner, . Note that does not simply describe uncorrelated sequences: significant sequence similarity may exist between genes that are not aligned due to their link mismatch, since functional changes can lead to a rapid divergence of links, for example, in the formation of a pseudogene.
The log-likelihood node similarity scores and , which are defined by
| (8) |
quantify the dependence of the alignment on node similarity. Assuming that the coefficients are drawn independently from these distributions, we obtain the distribution of node similarity for a pair of networks and with a given alignment ,
| (9) |
where and the network node score is again a sum of local contributions and . In this paper, we use a simple binary approximation of node similarity: two genes are counted as orthologous () if they appear as putative orthologs in the Ensembl-database [20], and otherwise not (). Each node may have several such putative orthologs. The three distributions in (8) are then fully determined by three model parameters, , , and , which in turn depend on the rates of the node dynamics and on the evolutionary distance between the species. A short calculation shows that the node score (9) takes the form
| (10) |
Here the local node similarity score
| (11) |
measures the overlap of alignment and homology map as shown in Fig. 1(c), and the “chemical potential” implicitly determines the overall number of nodes in the alignment (for details, see the Supporting Text). For large , the highest scores occur in global alignments between the networks and , which involve all nodes of the smaller network. This is appropriate if the evolution of links and nodes maintains for all nodes some functional relationship within the network. In the case of this study, link and node dynamics destroy significant correlations for some nodes. We obtain local alignments with chemical potential , which exclude some nodes of both networks.
Hidden Markov model and Bayesian analysis. We can now combine the distributions and into a probabilistic model for link and node similarity, which produces the observable data, i.e., pairs of networks with adjacency matrices , and node similarity matrix , for a given alignment and for given model parameters in eqs. (5) and (10). The combined model is given by the probability distribution
with the alignment score function
| (13) |
Eqs. (Theory) and (13) are at the heart of our scoring procedure: they provide a probabilistic rationale for the cross-species analysis of network data by link and node similarity. The model parameters , which determine the relative weight of link and node score, and the alignment are “hidden” variables, which can be inferred by a standard Bayesian analysis. We write their posterior probability, i.e., the conditional probability of the hidden variables for given data , in the form
| (14) |
and assume the prior probability to be flat. Dropping the terms independent of and , we obtain the optimal local alignment by maximizing the posterior probability and similarly the optimal scoring parameters by maximizing . In a Viterbi approximation, and can be inferred jointly by maximizing . This amounts to determining the optimal null model parameter and maximizing the combined score . Details are given in the Supporting Text.
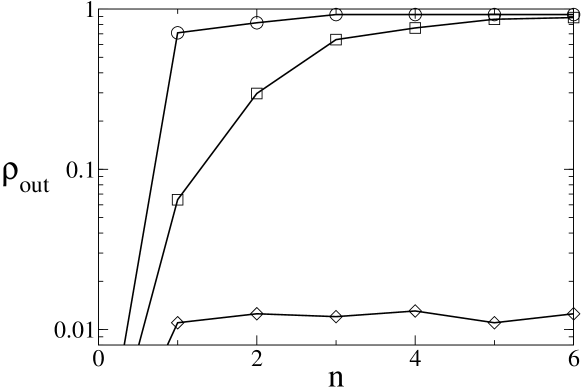
Alignment algorithm. Our algorithm for maximizing the score is based on a mapping to a generalized quadratic assignment problem, which is solved by an iterative heuristic similar to [19] with running times of order [21] (for details, see Supporting Text). To quantify the performance of the algorithm for co-expression networks, we have used a human microarray dataset [22], consisting of expression measurements of different tissues. We randomly partitioned the experiments into two equally large subsets, and thus obtained two “mirror copies” of the expression correlation network in one species. The nodes in the two networks are identical and their links differ only by experimental noise. The correct alignment of these two copies is trivial, . A fraction of correctly aligned nodes with randomly chosen indices is given as input for the algorithm by specifying the corresponding node similarity coefficients , the remaining node information is ignored (). We then record the fraction of correctly aligned nodes of the algorithm as a function of the number of iterations , see Fig. 2. This performance characteristic shows a switch from low to high alignment quality at a threshold value . In the low-quality regime (), the alignment contains for all only the nodes given as input. In the high-quality regime (), the iterations continuously improve the fraction of correctly aligned nodes, saturating at an accuracy for large . Of course, the threshold will be higher and the saturation accuracy lower for cross-species comparisons, where the networks differ by evolutionary changes and by larger experimental variation. Similarly, the threshold rises if the network is randomly diluted (to when of all links have been set to zero).
Results
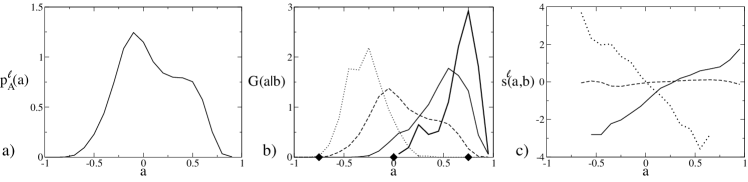
Aligning human/mouse expression data. The co-expression networks were constructed from the expression data of Su et al. [22] obtained from 79 tissues in human, 61 tissues in mouse, and a set of biological and technical replicates of the same size. Similar experimental protocols were used in both species, making the data particularly suitable for cross-species comparison. Our networks (human) and (mouse) of size contain all genes which are expressed in all samples and show a low variance of expression levels across samples in both species (housekeeping genes), as well as all genes having a high expression similarity with at least one such housekeeping gene. The link strength is defined as the Spearman correlation between the expression levels of the human genes and across all tissues, and similarly in mouse. Both networks have a broad distribution of link values; the distribution in human is shown in Fig. 3(a). To determine the link scoring function , we look at all human gene pairs which have homologs in mouse and compute the distribution of link pairs and . The optimal alignment (along with the optimal node model parameters ) is then inferred by likelihood maximization as described above; it consists of genes.
The overall cross-species variation of expression is given by the root mean square difference (with the brackets indicating the average over all aligned link pairs ), we find . To separate this variation into evolutionary changes and sampling noise, we again construct co-expression networks from a randomly chosen subset containing half the expression measurements from either organism and obtain , i.e., sampling contributes only a small fraction to . The alignment is also remarkably stable with respect to this change of the dataset: 85% of the nodes are aligned to the same partner. This shows that co-expression networks provide a faithful representation of evolutionary changes of expression patterns.
To trace the link evolution between the networks in more detail, we look at the conditional distribution of correlation values in human given a certain correlation value in mouse, which is shown in Fig. 3(b) as a function of for three different values of . As expected, the variance of is largest for weak correlations and less for strong positive or negative correlations. The resulting link scoring function is a linear function of with the slope determined by , see Eq. (2) and Fig. 3(c).
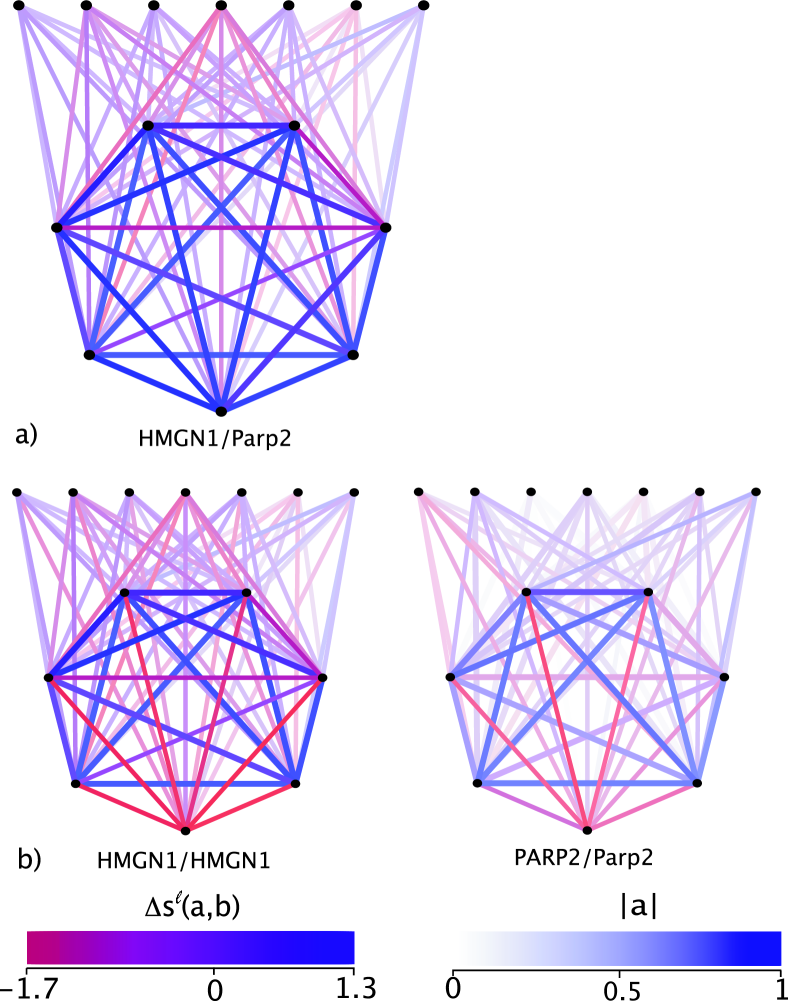
Conserved network patterns. Co-expression networks are not homogeneous [1]. Instead, they are organized in clusters of genes which have similar expression profiles. In the mouse network, we call a gene clustered if it has a correlation with more than 15 other genes (the average number of links is approximately 1 per gene). With this definition, there are 40 clustered genes in the network (little of the following depends on the exact thresholds chosen). The thick line in Fig. 3(b) shows the conditional distribution restricted to links involving a clustered mouse gene . The root mean change of the expression correlations is . This is a reduction by a factor of two, compared to the distribution for all genes. This reduced change of expression correlation for clustered genes translates into a local excess link score (7) of per gene. This suggests that clustered genes have more strongly conserved expression patterns than genes which are not part of clusters, see also ref. [1]. Fig. 4(a) shows the link evolution between a set of clustered genes (arranged in a circle) and a randomly chosen set of genes outside this cluster (arranged in a straight line). The link intensity encodes the correlation strength in human, the color its evolutionary conservation as measured by the excess link score . Intra-cluster links are, on average, stronger (i.e., more intense) and at the same time more conserved (i.e., contain more blue) than links with external genes. The genes contained in this cluster are involved in the control of transcription and code for constituents of the ribosome; their full list of is given as Supporting Table.
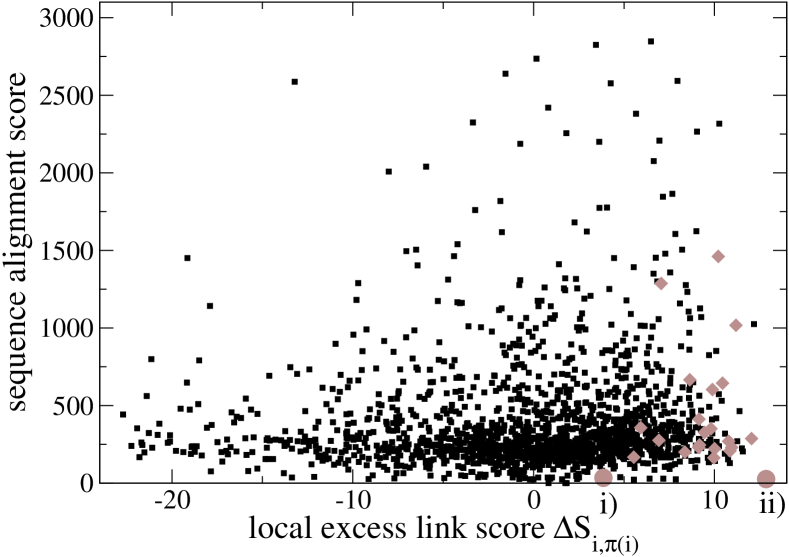
Correlations between link and node similarity. Figure 5 shows an overall correlation between cross-species sequence similarity quantified by the score of the best nucleotide Blast hit [23] and link similarity measured by the excess link score . Gene pairs with a high sequence score also have a bias towards high link similarity. However, the converse is not true: most of the gene pairs with strongly conserved expression patterns have only average sequence similarity. An example is the gene cluster discussed above (marked by grey diamonds in fig. 5), which has a significant excess link score and a sequence score of per gene, which is not significantly above the network average of .
Network-based gene annotations. Network alignment as a putative functional map differs from the homology map of individual genes: there are genes without an (easily detected) homologous partner in the other network. These genes are aligned solely on the basis of their link score. Although our dataset is centered around housekeeping genes and may be biased against such cases, the maximum-likelihood alignment contains significant cases of such link-based alignments, which are reported in the Supporting Table (and marked by gray circles in fig. 5).
(i) Human-OR1C1 is aligned to mouse-Olfr836 with a local link score exceeding the average value between orthologs. A functional relationship between these genes is quite plausible: Not only are both genes involved in olfactory receptor activity [24], they also have two protein domains in common and belong to the same gene family. However, their overall DNA sequence identity is below , compared to a typical value of between orthologs in human and mouse. Most likely these genes are distant orthologs, predating the human-mouse split. This is an example where functional constraints maintain a high level of conservation at the network level, but not at the sequence level.
(ii) In the case human-HMGN1/mouse-Parp2, both genes have orthologs but the network alignment does not match the orthology map. As shown in Fig. 4(a), the human gene HMGN1 is part of a gene cluster, and the alignment to mouse-Parp2 (with ) respects the evolutionary conservation of that cluster. The “false” alignment human-HMGN1/mouse-HMGN1 respects orthology but produces a link mismatch () due to the poor expression similarity of mouse-HMGN1 with the other genes of the cluster; see Fig. 4(b). Human-HMGN1 is known to be involved in chromatin modulation and to act as an RNA-polymerase II transcription factor, in particular through altering the accessibility of regulatory DNA. The network alignment predicts a similar role of Parp2 in mouse, which is distinct from its known function in the poly(ADP-ribosyl)ation of nuclear proteins. This prediction is consistent with a recent experimental study inhibiting the members of the Parp gene family in mouse. The authors conclude that “in addition to known functions of poly(ADP-ribosyl)ation, some so far unrecognized, non-redundant functions may also exist”, specifically the chromatin-remodeling involved in gene expression changes during development [25].
Discussion
Alignment provides a quantitative measure of network divergence. We have developed a probabilistic alignment procedure for biological networks based on their link and node similarity. Both components of similarity are important, i.e., a network alignment differs, in general, both from a mere matching of link patterns and from a mere node homology map. To the extent that significant sequence homology is present, it clearly introduces a bias for the functional association of genes across organisms, and hence for the alignment. It is this bias that makes the problem computationally tractable: although there is probably no formal solution by a polynomial-time algorithm, biological network alignment allows for more efficient heuristics than generic pattern matching. (We have discussed here an alignment of about 2000 genes, but ongoing studies suggest the method can be scaled up to genome-wide cross-species comparisons of vertebrates.) On the other hand, the homology relations are not completely respected even between relatively close species: network alignment thus predicts a deviation of functional evolution from sequence evolution for some genes. Assessing the statistical significance of such functional swaps requires tuning the relative weight of link and node similarity in a consistent way, which is done here by a Bayesian inference from the datasets.
Cluster conservation and selection. There are important differences in the population genetics of sequences and networks. Sequence divergence has an approximate molecular clock of synonymous nucleotide changes, which can be described approximately by neutral evolution. Adaptive changes can be quantified relative to neutral evolution. For interaction networks, the relative weights of neutral evolution, negative and positive selection are far less clear. Indeed, the role of selection in the evolution of expression patterns is currently under debate [26, 27]. Even the direction of evolution may not be as predominantly divergent as for sequences: the selection for a given function may lead to convergent evolution of network structures. Nevertheless, there is some regularity in the evolution of expression patterns: genes which are part of a strongly correlated cluster in one species have a significantly reduced cross-species variation of their expression profile; this conservation is quantified by a typical excess link score of order per gene. Selection for functionality is indeed a possible explanation. However, as the example of Fig. 4 shows, selection in a network can be rather complex: conservation of a gene cluster as a whole could be attributed to purifying selection at the level of network interactions, but this does not exclude positive selection leading to functional swaps at the level of network constituents.
Network-based prediction of gene function. Given a cross-species alignment of gene networks, we can quantify link and node evolution. For our cross-species analysis between human and mouse, the correlations between these two modes are shown in Fig. 5. Although high sequence similarity predicts high link conservation, most of the gene pairs with high link conservation have only average sequence similarity. Hence, the network alignment contains functional information beyond the corresponding sequence alignment: it detects evolutionary conservation which is not discernible by a comparison of overall similarity between sequences. Identifying genes with conserved expression patterns will also aid the cross-species analysis of regulatory binding sites, where a rapid turnover of binding sites despite the conservation of expression patterns has been found [28].
Extreme cases of mismatch between link and node evolution are gene pairs with significantly similar interaction patterns but with no significant sequence similarity at all. This mismatch can be due to long-term sequence evolution between orthologous genes, which randomizes their sequence similarity, while their functional roles are more conserved. It may also arise from link dynamics leading to link similarities between genes that are completely uncorrelated at the sequence level [13, 14, 15]. In our alignment of co-expression networks, we find evidence for both processes. Thus, the alignment leads to functional predictions on the basis of network similarity alone, in cases where a functional annotation is known for one of the aligned genes.
Acknowledgments: This work was supported through DFG grants SFB/TR 12, SFB 680, and BE 2478/2-1. We thank Terence Hwa, Daniel Barker, and Diethard Tautz for discussions.
References
- [1] Stuart, J, Segal, E, Koller, D, & Kim, S. (2003) Science 302, 249–55.
- [2] Bergmann, S, Ihmels, J, & Barkai, N. (2004) PLoS Biol. 2, e9.
- [3] Sharan, R, Suthram, S, Kelley, R, Kuhn, T, McCuine, S, Uetz, P, Sittler, T, Karp, R, & Ideker, T. (2005) Proc Natl Acad Sci U S A 102, 1974–1979.
- [4] Sharan, R, Ideker, R, Kelley, B, Shamir, R, & Karp, R. (2005) Journal of Computational Biology 12, 835–846.
- [5] Orr, S. S, Milo, R, Mangan, S, & Alon, U. (2002) Nature Genetics 31, 64–68.
- [6] Milo, R, Shen-Orr, S, Itzkovitz, S, Kashtan, N, Chklovskii, D, & Alon, U. (2002) Science 298, 824–827.
- [7] Berg, J & Lässig, M. (2004) Proc. Natl. Acad. Sci. USA 101, 14689–14694.
- [8] Trusina, A, Sneppen, K, Dodd, I, Shearwin, K, & Egan, J. (2005) PloS Comput. Biol. 7, e74.
- [9] Heymans, M & Singh, A. (2003) Bioinformatics 19, 138–146.
- [10] Kelley, B, Sharan, R, Karp, R, Sittler, T, Root, D, Stockwell, B, & Ideker, T. (2003) Proc Natl Acad Sci U S A 100, 11394–11399.
- [11] Kelley, B, Yuan, B, Lewitter, F, Sharan, R, Stockwell, B, & Ideker, T. (2004) Nuceic Acids Research 32, W83–W88.
- [12] Pinter, R, Rokhlenko, O, Yeger-Lotem, E, & Zvi-Ukelson, M. (2005) Bioinformatics 21, 3401–3408.
- [13] Koonin, E, Mushegian, A, & Bork, P. (1996) Trends Genet. 12, 334–6.
- [14] Galperin, M. Y & Koonin, E. V. (1998) In Silico Biology 1, 55-56.
- [15] Morett, E, Korbel, J, Rajan, E, Saab-Rincon, G, Olvera, L, Olvera, M, Schmidt, S, Snel, B, & Bork, P. (2003) Nature Biotechnology 21, 790–795.
- [16] Needleman, S & Wunsch, C. (1970) Journal of Molecular Biology 48, 443–453.
- [17] Smith, M. S & Waterman, T. F. (1981) Journal of Molecular Biology 147, 195–197.
- [18] Papadimitriou, C. (1995) Computational Complexity. (Addison-Wesley, Reading, MA).
- [19] Tsafrir, D, Tsafrir, I, Ein-Dor, L, Zuk, O, Notterman, D. A, & Domany, E. (2005) Bioinformatics 21, 2301–2308.
- [20] Hubbard, T, Andrews, D, Caccamo, M, Cameron, G, Chen, Y, Clamp, M, Clarke, L, Coates, G, Cox, T, Cunningham, F, et al. (2005) Nucleic Acids Res. 33, D447–D453.
- [21] Jonker, R & Volgenant, A. (1987) Computing 38, 325–340.
- [22] Su, A, Wiltshire, T, Batalov, S, Lapp, H, Ching, K, Block, D, Zhang, J, Soden, R, Hayakawa, M, Kreiman, et al. (2004) Proc Natl Acad Sci U S A 101, 6062–6067.
- [23] Altschul, S. F, Madden, T. L, Schaffer, A. A, Zhang, J. H, Zhang, Z, Miller, W, & Lipman, D. (1997) Nuc. Acids Res. 25, 3389–3402.
- [24] The Gene Ontology Consortium. (2000) Nature Genet. 25, 25–29.
- [25] Imamura, T, Anh, T. M, Thenevin, C, & Paldi, A. (2004) BMC Molecular Biology 5, 4.
- [26] Khaitovich, P, Weiss, G, Lachmann, M, Hellmann, I, Enard, W, Muetzel, B, Wirkner, U, Ansorge, W, & Pääbo, S. (2004) PLoS Biol 2, E132.
- [27] Yanai, I, Korbel, J. O, Boue, S, McWeeney, S, Bork, P, & Lercher, M. J. (2006) Trends Genet. 22, 132–138.
- [28] Tanay, A, Regev, A, & Shamir, R. (2005) Proc. Natl. Acad. Sci. USA 102, 7203-7208.