Wringing out DNA
Abstract
The chiral nature of DNA plays a crucial role in cellular processes. Here we use magnetic tweezers to explore one of the signatures of this chirality, the coupling between stretch and twist deformations. We show that the extention of a stretched DNA molecule increases linearly by 0.42 nm per excess turn applied to the double helix. This result contradicts the intuition that DNA should lengthen as it is unwound and get shorter with overwinding. We then present numerical results of energy minimizations of torsionally restrained DNA that display a behaviour similar to the experimental data and shed light on the molecular details of this surprising effect.
pacs:
87.14.Gg, 87.15.Aa, 87.15.LaThe helical structure of double-stranded DNA (dsDNA) results in very specific mechanical properties. These affect the function of nucleic acids, as they determine the accessibility of the genetic material to the proteins that process it. Micromanipulation techniques developed over the past decade have made it possible to manipulate a single DNA molecule, and thus to extensively study its mechanical response Strick et al. (2000); Allemand et al. (2003); Lavery et al. (2002). In the so-called entropic regime ( 10 pN), stretched dsDNA behaves as a uniform, semi-flexible rod whose extension results from a balance between the entropy of bending fluctuations and the work performed by the stretching force Smith et al. (1992); Bustamante et al. (1994); Marko and Siggia (1995); Bouchiat et al. (1999). In the very low force regime (typically 0.4 pN), twisted DNA behaves as an isotropic rod. Its torsional energy increases up to a threshold where the molecule buckles to form superhelical loops called plectonemes Strick et al. (1996, 1998); Vologodskii and Marko (1997); Moroz and Nelson (1997); Bouchiat and Mezard (1998); Zhou et al. (2000). At higher forces (and consequently higher torques), DNA chirality affects its response to twist. The molecule undergoes structural transitions away from its native conformation in solution, B-DNA. When the torque is negative, i.e. opposite to the handedness of the double helix, DNA denatures: its unwound strands locally separate. When the torque is positive, the molecule adopts a highly overwound state, P-DNA Allemand et al. (1998); Strick et al. (1998); Bryant et al. (2003).
As a result of its helical structure, a DNA molecule is expected to display a coupling between its extension and its degree of twist . In other words, one expects the extension of DNA in its native structure to be an asymmetric function of twist. The response of DNA to both twist and stretch has been studied in the framework of continuum elasticity Marko (1997); Kamien et al. (1997); O’Hern et al. (1998). In that approach, the energy per unit length is a quadratic function of its relative change in extension and twist: , (where and are the contour length and natural twist of the double helix and is the number of turns added to a twisted DNA):
where = 3.6 nm is the DNA pitch and 100 nm, 78 nm and are respectively the DNA torsional, stretch and twist/stretch moduli Charvin et al. (2004); Strick et al. (2000). By minimizing with respect to at fixed , one finds that the extension should vary linearly with the twist: , equivalent to . Values of in the 12-20 nm range have been previously extracted from single molecule results Marko (1997); Kamien et al. (1997). This corresponds to a decrease in length of the DNA molecule of 0.6-0.9 nm per added turn. However, these estimates must be taken with care as they were extracted from data pertaining to DNA adopting different structures, not necessarily the native B-DNA form.
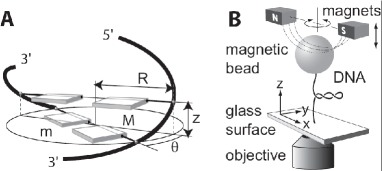
In the absence of a reliable twist-stretch estimate, elasticity theory needs to be backed by a complementary, atomic-scale approach, in order to predict the value of the phenomenological parameter . Geometry alone provides a first "naive" estimate, if we assume that the double helix radius = 1 nm and the arc length of the backbones are fixed ( being the total number of base pairs, the rise per base pair -the difference between adjacent base pairs along the helical axis- and the twist per base pair -the angle formed by adjacent base pairs around the helix axis- see Fig.1A). The length of the molecule should then increase as it is unwound: - 11 nm/turn (or = 240 nm). A finer approach based on Monte Carlo simulations suggests a similar estimate Mergell et al. (2003). Elastic constants calculated from Molecular Dynamics (MD) simulations yield values ranging from 4 to 18 mn for different base sequences, which implies an average value of dL/dn = -0.5 nm/turn Lankas et al. (2000). All these estimates, in spite of important differences in their magnitude, agree on the twist-stretch coupling sign: DNA should lengthen as it is unwound, as suggested by the simple picture of wringing out a floorcloth.
We now describe magnetic tweezer experiments on single DNA molecules that allow measurement of the value of the twist-stretch coupling of B-DNA. While its sign is opposite to the "naive" expectations previously mentioned, it is however in good agreement with atomic-scale numerical modeling of the response of DNA to twist. The modeling results further suggest that response of B-DNA to torsion illustrates the same mechanical coupling as seen in the transition between B-DNA and the form of DNA observed under low hydration conditions, A-DNA Saenger (1984).
Magnetic tweezer experiments – Magnetic tweezers allow to monitor the change in extension of a single dsDNA molecule as it is twisted Strick et al. (1996); Gosse and Croquette (2002). In a custom-built flow chamber, we tether a single DNA molecule between a glass surface and a superparamagnetic bead (1.4 m radius, Dynal). A pair of permanent magnets placed above the sample generate a constant, vertical stretching force on the bead and lock its rotational motion around the vertical axis. The exerted force and the rotation of the bead can be set by respectively translating and rotating the magnets (Fig.1B). The bead is imaged at video rate (60 Hz) through a 100x oil immersion objective, with a typical resolution of 2 nm. The force exerted on the bead is computed from measurements of and using the equipartition theorem: Gosse and Croquette (2002).
The curves are obtained by rotating the end of a DNA molecule under a constant force and averaging the measured extension for each value of over typically 128 points. At high enough and for small values (typically -0.01 < < 0.02), rotation translates into a change of the DNA twist. This approximation, which neglects relaxation of torsional constraint through bending fluctuations ("writhe"), is correct (when 2 pN) within a 10 % margin Moroz and Nelson (1997). However, for larger values, buckling and/or structural transitions invalidate this relationship. This is illustrated in Fig.2A, where dsDNA is stable in its B- form for small torsional strains (black overlay, -0.01 < < 0.02). Storing twist energy through small deformations around the relaxed B- conformation becomes unfavorable under higher torsional strain, and dsDNA undergoes a transition to supercoiled P-DNA (sc-P) in the positive supercoiling region ( > 0.02), whereas strong negative supercoiling conditions induce local denaturation of the molecule ( < -0.01) Strick et al. (1998); Sarkar et al. (2001). The twist-stretch coupling measures the change in extension for small variations in twist. It is thus deduced from the slope of at 0: = 0.28 0.04 nm/turn (Fig.2A) equivalent to a twist-stretch modulus = -6.1 0.9 nm. Notice that as B-DNA is overwound its extension increases, in contradiction with one’s naive intuition.
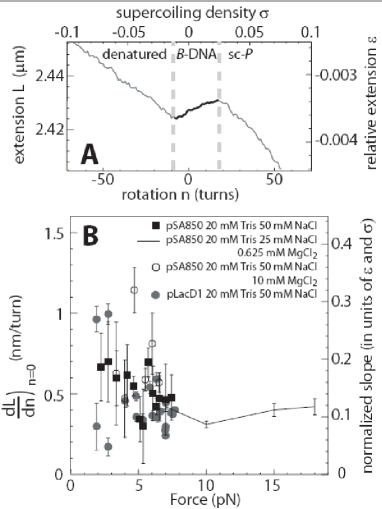
The twist-stretch coupling is neither force- nor [Mg2+]- dependent (within the 2-20 pN and 0-10 mM range explored (Fig.2). We did not observe any sequence dependence, as two unrelated molecules with different sequence contents (pLacD1: 7.4 kbp, 43 GC; pSA850: 3.6 kbp, 48 GC) yield similar values. By averaging all the values obtained in the different conditions, we obtain a slope of 0.42 0.2 nm/turn, and thus = -9.1 4 nm.
Molecular modeling calculations – In the absence of a satisfactory theoretical description, we decided to investigate the atomic details of dsDNA response to twist in order to understand our experimental results. This has been done by performing energy minimization of DNA under conditions mimicking our experiments.
The modeling calculations were carried out with JUMNA Lavery et al. (1995) using the AMBER parm 98 force field Cheatham et al. (1999). DNA was modeled as a helically symmetric polymer with a mononucleotide or dinucleotide symmetry repeat according to the nature of the base sequence. Solvent and counterion effects were modeled using a sigmo dal distance dependent dielectric function and reduced phosphate charges (-0.5 ). Calculations made with a generalized Born solvent model Tsui and Case (2000) gave very similar results. Sequence effects were investigated by making calculations for all dinucleotide repeating sequences, (AA)n, (GG)n, (AT)n, (CG)n, (AC)n and (AG)n, and for an "average" sequence composed of equal contributions from each of the four standard base pairs, obtained using the multicopy approach ADAPT Lafontaine and Lavery (2000). For each sequence, the twist per base pair was fixed at values ranging from 32.5∘ to 40.5∘ (at intervals of 0.25∘). The DNA structure was then energy minimized and its helical conformation was analyzed. The effects of tension were studied by applying equal and opposite forces to both ends of each strand of the double helix Lavery and Lebrun (1999).
In the absence of an exerted force, the base pair extension, or rise, is a linear function of the twist per base pair in the positive supercoiling region, i.e. when the twist is greater than its relaxed state value 34.5∘ (Fig.3A). All tested sequences have comparable slopes, typically 0.9 nm/turn (thus = -20 nm). In the negative supercoiling region, the curves display different behaviours that cancel out to produce a flat line in the case of the "average" sequence. Exerting a force on the molecule slightly decreases the slope of the rise versus twist curve. At 6 pN (18 pN), the rise increases by 0.68 nm/turn (0.58 nm/turn), equivalent to = -15 nm (-13 nm).
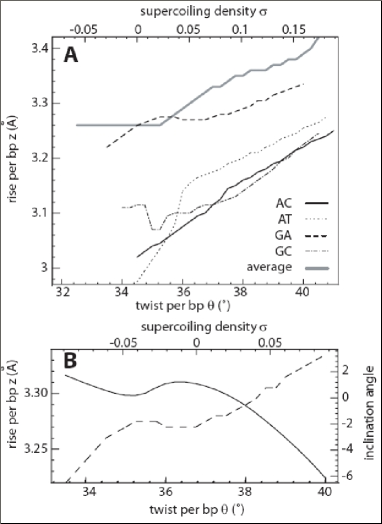
Other basepair parameters, such as inclination, roll, etc Dickerson (1989) were monitored as the twist is varied. As shown in Fig.3B, increasing rise is tightly coupled to more negative inclination (i.e. a counterclockwise rotation of the base pairs viewed from the minor groove of the double helix). The absence of significant rise variation observed for energy minimizations of a DNA molecule with locked base pair inclination further illustrates this tight coupling (data not shown). Other structural parameters display a significant change in this range of twist values: the shift becomes less negative with increasing twist, with a slope of 0.38 Å/degree (shift, or, more formally, the displacement is the displacement of the base pairs from the helical axis perpendicular to their long axis, and is positive for displacements towards the major groove); the sugar phase angle Saenger (1984)) increases by 2.5 degree per degree of twist; finally, the double helix diameter decreases by -0.44 Å/degree.
Concluding remarks – The magnetic tweezer experiments presented in this work provide clear evidence of a linear twist-stretch coupling in B-DNA, in the regime of small, physiological torsional strains (). The sign and magnitude of this effect differ from naive theoretical predictions. However, they are in good agreement with the present molecular modeling calculations of the response of B-DNA to limited changes in the twist.
A few details remain to be adressed. Calculations predict that should decrease with increasing . Experimental data lack the necessary resolution at low force to observe such an effect. In addition, the range of supercoiling values in which this effect is observed differs between experiments and calculations. Energy minimizations include neither the possible structural transitions to different DNA states (denatured or P) nor sense of buckling transition. This explains why a larger range can be studied than in the tweezer experiments. However, it is not clear why linear, positive twist-stretch coupling is only observed for positive supercoiling in the calculations, whereas experimentally, such a behaviour is observed for both positive and negative supercoiling.
The difference between our results and prior estimates based on single-molecule experiments is most likely due to the presence of extreme structural transitions in the data previously exploited Marko (1997); Kamien et al. (1997). This suggests that structural transitions exploit very different atomic mechanisms than fluctuations within the B-DNA stability region. Work remains to be done to clearly relate the present results to MD simulations Lankas et al. (2000, 2003).
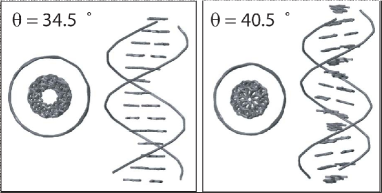
The present numerical results yield evidence for the molecular mechanism of the observed effect: the decrease in rise as the molecule is unwound is coupled to an inclination of the basepairs towards positive values, an increase in the diameter, more negative shift values, and a decrease of the sugar phase angle (Fig.4). All these variations, in spite of a much smaller amplitude, have the same sign as the variations observed in the B- to A-DNA transition Saenger (1984). This suggests that the twist-stretch coupling involves the same helical deformation mechanism as the transition to A-DNA. This behaviour might be important as part of the mechanism of DNA deformation which is exploited by proteins in detecting specific sequences Paillard and Lavery (2004).
Acknowledgements.
We would like to thank G. Lia and D.R. Leach for providing DNA substrates, and F. Lankas for helpful discussions. This work was supported by grants from A.R.C., C.N.R.S., the Universities Paris 6 and Paris 7, and the MOLSWITCH program.References
- Strick et al. (2000) T. Strick, J. Allemand, V. Croquette, and D. Bensimon, Prog Biophys Mol Biol 74, 115 (2000).
- Allemand et al. (2003) J. F. Allemand, D. Bensimon, and V. Croquette, Curr Opin Struct Biol 13, 266 (2003).
- Lavery et al. (2002) R. Lavery, A. Lebrun, J. F. Allemand, D. Bensimon, and V. Croquette, Journal of Physics-Condensed Matter 14, R383 (2002).
- Smith et al. (1992) S. B. Smith, L. Finzi, and C. Bustamante, Science 258, 1122 (1992).
- Bustamante et al. (1994) C. Bustamante, J. F. Marko, E. D. Siggia, and S. Smith, Science 265, 1599 (1994).
- Marko and Siggia (1995) J. F. Marko and E. D. Siggia, Macromolecules 28, 8759 (1995).
- Bouchiat et al. (1999) C. Bouchiat, M. D. Wang, J. Allemand, T. Strick, S. M. Block, and V. Croquette, Biophys J 76, 409 (1999).
- Strick et al. (1996) T. R. Strick, J. F. Allemand, D. Bensimon, A. Bensimon, and V. Croquette, Science 271, 1835 (1996).
- Strick et al. (1998) T. R. Strick, J. F. Allemand, D. Bensimon, and V. Croquette, Biophys J 74, 2016 (1998).
- Vologodskii and Marko (1997) A. V. Vologodskii and J. F. Marko, Biophys J 73, 123 (1997).
- Moroz and Nelson (1997) J. D. Moroz and P. Nelson, Proceedings of the National Academy of Sciences of the United States of America 94, 14418 (1997).
- Bouchiat and Mezard (1998) C. Bouchiat and M. Mezard, Physical Review Letters 80, 1556 (1998).
- Zhou et al. (2000) H. J. Zhou, Y. Zhang, and Z. C. Ou-Yang, Physical Review E 62, 1045 (2000).
- Allemand et al. (1998) J. F. Allemand, D. Bensimon, R. Lavery, and V. Croquette, Proc Natl Acad Sci U S A 95, 14152 (1998).
- Bryant et al. (2003) Z. Bryant, M. D. Stone, J. Gore, S. B. Smith, N. R. Cozzarelli, and C. Bustamante, Nature 424, 338 (2003).
- Marko (1997) J. F. Marko, Europhysics Letters 38, 183 (1997).
- Kamien et al. (1997) R. D. Kamien, T. C. Lubensky, P. Nelson, and C. S. Ohern, Europhysics Letters 38, 237 (1997).
- O’Hern et al. (1998) C. S. O’Hern, R. D. Kamien, T. C. Lubensky, and P. Nelson, European Physical Journal B 1, 95 (1998).
- Charvin et al. (2004) G. Charvin, J. F. Allemand, T. R. Strick, D. Bensimon, and V. Croquette, Contemporary Physics 45, 383 (2004).
- Mergell et al. (2003) B. Mergell, M. R. Ejtehadi, and R. Everaers, Physical Review E 68, (2003).
- Lankas et al. (2000) F. Lankas, J. Sponer, P. Hobza, and J. Langowski, J Mol Biol 299, 695 (2000).
- Saenger (1984) W. Saenger, Principles of nucleic acid structure (Springer-Verlag, New York, 1984).
- Gosse and Croquette (2002) C. Gosse and V. Croquette, Biophysical Journal 82, 3314 (2002).
- Sarkar et al. (2001) A. Sarkar, J. F. Leger, D. Chatenay, and J. F. Marko, Physical Review E 6305 (2001).
- Lavery et al. (1995) R. Lavery, K. Zakrzewska, and H. Sklenar, Computer Physics Communications 91, 135 (1995).
- Cheatham et al. (1999) T. E. Cheatham, P. Cieplak, and P. A. Kollman, J Biomol Struct Dyn 16, 845 (1999).
- Tsui and Case (2000) V. Tsui and D. A. Case, Journal of the American Chemical Society 122, 2489 (2000).
- Lafontaine and Lavery (2000) I. Lafontaine and R. Lavery, Biophys J 79, 680 (2000).
- Lavery and Lebrun (1999) R. Lavery and A. Lebrun, Genetica 106, 75 (1999).
- Dickerson (1989) R. E. Dickerson, Nucleic Acids Res 17, 1797 (1989).
- Lankas et al. (2003) F. Lankas, J. Sponer, J. Langowski, and T. E. Cheatham, Biophys J 85, 2872 (2003).
- Paillard and Lavery (2004) G. Paillard and R. Lavery, Structure 12, 113 (2004).