Realization of features of immune response by dynamical system models and a possible mechanism of memory of antigen invasion
Abstract
Among features of real immune responses which occur when antigens invade a body, there are two remarkable features. One is that the amount of antibodies produced in the secondary invasion by the same antigens is more than 10 times larger than that in the primary invasion. The other is that more effective antibodies which can neutralize the antigens more quickly are produced by somatic hypermutation during the immune response. This phenomenon is named as ’affinity maturation’.
In this paper, we try to reproduce these features by dynamical system models and present possible factors to realize them. Further, we present a model in which the memory of the invasion by antigens is realized without immune memory cells.
1 Introduction
The immune system has evolved specific mechanisms to defend against numerous invading pathogens and any toxic molecules they produce. The acquired immune system effectively eliminates foreign molecules (i.e., antigens) from its body. This specific immune system can distinguish the body’s own tissues (self) from tissues and particles not normally found in own body (non-self), and removes the non-self antigens efficiently to protect itself from harmful environments. In this paper, we propose dynamical system models which can reproduce most characteristic phenomena in immune responses.
First, we briefly summarize specific immune responses [1, 2]. In specific immune responses, many cells and physiologically active molecules interact in complicated ways. Among them, main constituents are B-lymphocytes (B-cells) produced in the Bone marrow, T-lymphocytes (T-cells) produced in the Thymus and antibodies (immunoglobulins). B-cells generate and secrete antibodies. An antibody attaches to a specific antigen and makes it easier for phagocytes to destroy the antigen. T-cells attack antigens directly, and provide control of the immune response. An antibody is a protein which possesses an immunoglobulin structure consisting of a variable region (V region) and a constant region (C region). The V region allows a variety of specific association with the corresponding antigen. On the other hand, the variety of C region is mainly related to the way of the antigen elimination. According to the difference in C regions, antibodies are classified as IgM, IgG, IgE etc. On the surface of each B-cell, there exists a B-cell receptor (BCR), which is an antibody with a transmembrane structure. Now, let us explain the V region in more detail. The V region of a BCR (and also an antibody) has proper 3-dimensional structure. This consists of several small structures which are called idiotopes. A set of idiotopes can bind to the antigenic determinant of a specific antigen. This set of idiotopes is called a paratope and the antigenic determinant is called an epitope. Further, an idiotope can be recognized by other antibodies (anti-idiotypic antibodies). The total set of idiotopes in the BCR is called ’Idiotype’.
A family of B-cells which are generated from a B-cell are called ’clones’. Therefore, a clone and antibodies produced by clone have the same idiotype. For each of various antigens, clones with specific idiotypes selectively correspond and can respond to the antigen (clonal selection theory). On the other hand, killer (cytotoxic) T-cells have a function to kill cells infected by viruses and cancer cells etc. (cell-mediated immunity). Further, another type of T-cells, so called helper T-cells, play several roles to regulate immune responses mediated by B-cells through antigen-antibody interactions (humoral immunity). Helper T-cells promote the maturation and the proliferation of the B-cells responding to the specific antigens, and terminate immune responses by suppressing the maturation and the proliferation of B-cells after neutralization of antigens.
In this paper, we propose models in which following features 1 and 4 in real immune systems are realized, taking into account features 2, 3, 5 and 6.
Features in real immune systems:
-
1.
The amount of antibodies produced by the secondary immune response is more than 10 times larger than that produced by the primary immune response[1].
-
2.
When an antigen invades the system, a clone with high affinity to the antigen is selected (clonal selection theory)[1].
- 3.
- 4.
-
5.
The apoptosis (cell death) rate of B-cells decreases during a proliferation period in response to antigens[5].
-
6.
Immune memory cells are created during the primary immune response and these are reserved for as long a period as the individual life[1].
-
7.
One immune response generates the other types of antibodies responding to the original antibody (existence of anti-idiotypic antibodies)[1].
Now, we briefly explain these features and how to include them into models in this paper.
-
1.
In real systems, the amount of antibodies produced in the secondary response ranges from 10 to 1000 times as many as that in the primary response. In this paper, as a criterion of the realization of feature 1, the amount of the antigens in the secondary response is set to 10 times the amount of antigens in the primary response. This number 10 is rather arbitrary and it can be replaced by a larger multiple of 10 such as 100 etc.
-
2.
In a body, there are a huge number of immune cells and they can respond to any kind of antigens. When any antigen invades the system, there exists at least one clone whose affinity to the antigen is high and clone is stimulated and responds to the antigen. This is the clonal selection theory and has been confirmed experimentally.
-
3. and 4.
Here, we explain class switching, somatic hypermutation and affinity maturation. Before invasion by an antigen, B-cells produce antibodies of the class IgM. These antibodies have lower affinity to neutralize the antigen. After the invasion of the antigen, depending on the amount of the antigen and its kind, B-cells switch the class of antibodies they produce. In recent studies, the enzyme has been found to induce class switching and the mutation of the V regions of the B-cells simultaneously. The latter is called somatic hypermutation. Among B-cells which are created through class switching and somatic hypermutation, the B-cells which have higher affinity than those before class switching play a main role in the secondary response. In fact, it is known that the antibodies produced in the secondary response have higher affinity to the antigen than those produced in the primary response[1]. This phenomenon is called affinity maturation. Affinity maturation is considered to take place in two processes[1].
-
(a)
At the later stage of the primary immune response, clones with higher affinities are produced.
-
(b)
In the secondary immune response, clones with higher affinities proliferate selectively by the stimulus of the antigen.
In this paper, we assume that B-cells which are selected by the clonal selection in the primary response switch their class and undergo somatic hypermutation, and there appear several B-cells with lower and higher affinities than B-cells before somatic hypermutation. Thus, the first of the above two processes is assumed although it is not guaranteed that the B-cells with higher affinities dominate in the primary response. Therefore, our main purpose is to realize the second of the processes. We investigate whether the concentrations of the B-cells which have higher affinity become dominant in the primary and the secondary responses.
-
(a)
-
5.
Usually, on their genes, cells are programed to die naturally. This spontaneous death of the cells is called apoptosis. However, it has been reported that for maturated B-cells apoptosis is suppressed during a proliferation period. The experiment to prove this phenomenon is as follows. First, an appropriate amount of stimulus is given. Then, the amount of B-cells increases. After that, if the amount of the stimulus is either increased or decreased, the amount of the B-cells always decreases. That is, in the beginning of the immune response when B-cells proliferate, apoptosis of the B-cells is suppressed. In our model, the stimulus is expressed by the sensitivity which is the product of the affinity to an antigen and the concentration of the antigen. When the antigen invades the system, is decreasing monotonically, because we assume that after an amount of the antigens invade the system they do not proliferate but just are neutralized. Therefore, to include feature 5, we assume that if is large and the maturation rate and the proliferation rate are high, the apoptosis rate of the B-cells is low, and it is high otherwise.
-
6.
B-cells created by somatic hypermutation finally disappear after the immune response because of apoptosis. However, a fraction of B-cells become immune memory cells by differentiation and their lifetimes are as long as those of the living body. In the secondary response, these memory cells are activated, become activated memory cells, and secrete antibodies with IgG class. Therefore, antigens are neutralized efficiently from the beginning of the secondary response. To include these facts into model, we assume the following in the present paper.
We reserve the part of the concentration of each clone as the immune memory cells every time its concentration increases by some constant amount. We assume that the apoptosis rate of the immune memory cells is 0 when they are produced, and are not activated in the primary response. In the secondary response, we assume that the immune memory cells are activated when the amount of antigens exceeds some threshold value, and activated memory cells have a finite apoptosis rate but have different response properties to the antigens from the normal B-cells. -
7.
It is known that in a real system, there exist anti-idiotypic antibodies which can interact with an antibody[1]. In the last part of this paper, we study a model in which both the antibodies and the anti-idiotypic antibodies are taken into account. By this model, the memory of the invasion by the antigens without immune memory cells is studied.
To realize features 1 and 4, we study second generation immune network model which was introduced by Varela et al[6]. Although this model is based on the idiotypic immune network theory proposed by Jerne[7], we do not consider the interaction between immune cells except for last model (model 3), but consider only the interaction between antigens and immune cells. That is, we do not take a network point of view.
First, we study a model taking into account features 2, 3, 5 and 6. Model is described by an ordinary differential equation system. We call it model 1. By this model, we can realize feature 4 when the amount of antigens is in a certain range. However, the sum of the concentrations of antibodies produced in the secondary response is only several times as many as that produced in the primary response. That is, feature 1 is not realized.
In real systems, it takes time for the B-cells to recognize the antigens when they invade a system. That is, there exists the time delay for the B-cells to recognize the antigens. Taking the time delay into account, we study a modified model, which is now described by a delay-differential equation system. We call it model 2. Then, we can realize both features 1 and 4. Therefore, it is clarified that the time delay is one of the most important factors to realize feature 1.
The above results are obtained by taking into account feature 6, the existence of immune memory cells. It is very interesting to study whether the concentrations of antibodies which can respond to antigens are retained spontaneously without the immune memory cells, even after the primary response finishes. In other words, we have interest in another mechanism of memorizing the invasion by the antigens without assuming the immune memory cells. In order to search for this possibility, we study a model assuming feature 7, the existence of antibodies and corresponding anti-idiotypic antibodies, without the immune memory cells. We call it model 3. As a result, we find that several pairs of antibodies and anti-idiotypic antibodies are excited and their concentrations continue to oscillate even after the primary response finishes, although affinity maturation does not necessarily take place.
The construction of the paper is as follows.
In section 2, we explain basic model. Models 1, 2 and 3 are studied in sections 3, 4 and 5, respectively. We give summary and discussions in section 6.
2 Basic model
As basic model, we use second generation immune network model which was introduced by Varela et al.[6]. The main constituents of Varela model are B-cells, T-cells and free antibodies produced by B-cells. The role of the T-cells is taken into account through the interaction between B-cells and antibodies in present model. Let us distinguish idiotypes by index . Let us call the B-cells with -th idiotype clone , and denote their concentration by and the concentration of the free antibodies produced by the B-cells by . The sensitivity of the network for the -th idiotype is defined as follows;
| (1) |
where is the number of idiotypes. is called the affinity, which represents the strength for the B-cells (and T-cells) with the -th idiotype to detect the antibodies with the -th idiotype. This is a general setting for immune network model. In this paper, we do not take a network point of view. Thus, instead of (1), we define as
| (2) |
Here, is the concentration of the antigen which invades the system
and is the strength for clone to detect
the antigen.
The number of B-cells and antibodies
change in time by the following causes.
Free antibodies
are removed from the system
because they have a natural lifetime
and also they interact with antigens and
neutralize them. On the other hand,
they are produced by B-cells as a result of the
maturation of B-cells.
The probability of the maturation is assumed to depend
on their sensitivity .
This effect is expressed by the maturation function .
In a real immune system, if the amount of molecules is very many, the system regards the molecules as a part of the self and does not respond to them. To reflect this fact, we assume that when representing the amount of stimulus is large enough, the maturation does not take place and we set . Around the boundary value of the stimulus that the system can respond to, we assume that decreases as increases. When the antigens are almost removed from the system and the immune response comes to an end, the creation of antibodies is suppressed. It is considered that the maturation does not take place when the amount of the stimulus becomes small. Thus, should decrease toward 0 as decreases toward 0 and is assumed to have a convex profile illustrated in Fig.1.

Correspondingly B-cells carrying -th idiotype on their surfaces decay at a given rate because of apoptosis and they proliferate when they maturate. The probability of the proliferation of B-cells is represented by the proliferation function . The B-cells do not proliferate by the stimulus of the self as in the case of the maturation. When the stimulus becomes weak and the immune response comes to an end, the proliferation of B-cells is suppressed by T-cells. Therefore, we assume that decreases as decreases for small . Thus, also has a convex shape. Further, it is considered that the suppression of the proliferation begins before that of the maturation does. Thus, it is reasonable to assume that is shifted to right from (Fig.1). In present model, we assume that and have the same shape of a symmetric trapezoid. Its slope is and its length of the smaller size is . The length of the shift between and is . We set and .
Then, the time evolutions of and are given by the following ordinary differential equation system.
| (3) | |||||
| (4) |
where is the rate of the antigen neutralization, is the rate of the death of the antibody, is the rate of the creation of the antibodies by B-cells, is the apoptosis rate of the B-cells and is the rate of production of the B-cells. Further, the term is added to take into account the cells that are recruited into the active network from the bone marrow. As these parameters, we adopt the following values which are estimated from real data. [day-1 unit ], [day-1], [ unitf unit day-1 ], [day-1], [day-1], [ unitb day-1]. Here, 1 unitb is the amount of B-cells with an idiotype which is supplied by the Bone marrow in 10 days, and 1 unitf is the amount of antibodies which is produced by the B-cells with an idiotype per day.
This is basic model. Based on this model, we consider several models taking into account features listed in .
In the next section, we study model 1 in which features 2, 3, 5 and 6 are taken into account.
3 Introduction of somatic hypermutation, change of apoptosis rate and immune memory cells: Model 1
Here, we explain first model, model 1. See Fig.2.
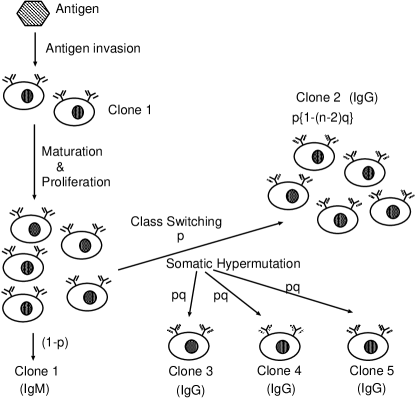
We assume the following. Let us consider the situation that one kind of antigen invades the system. Let be the concentration of the antigens. By the clonal selection, among several B-cells which can detect the antigens, some clone which detects the antigens most effectively is selected. Let this clone be clone 1 and let be the strength of the affinity for clone 1 to detect the antigens. We set for simplicity. The parameters to for clone 1 are equal to those in basic model.
Initially, clone 1 is in the rest state, that is, and , the stationary state of eqs. (3) and (4). During the first invasion by the antigens, when exceeds 30[unitb], class switching and somatic hypermutation take place at the same time. For simplicity, we assume that somatic hypermutation takes place only once. Further, we assume that clone 2 is produced by class switching, and clone 3 to clone are produced by somatic hypermutation. Here, we consider the case . The concentrations of clones 1 to 5 after class switching are assumed as follows.
where is the concentration of clone 1 just before class switching. We set . That is, class-switched clone 2 is 70 of clone 1 and 10 of class-switched clone 2 undergoes somatic hypermutation. We assume that clone has the strength of the interaction with the antigens . We put . The parameters s for clones 2 to 5 are the same as those for clone 1, except for , which is set to 0. In basic model, is fixed to 0.5[day-1]. To include feature 5, we assume that for clones 1 to 5 changes depending on the sensitivity as,
| (5) | |||||
where [day-1] and [day-1].
The equations of and are given by eqs. (3) and (4). In these equations is given as follows.
| (6) |
Before somatic hypermutation, only is considered. On the other hand, the equation of is given by
Further, we assume that for clones 2 to 5, the 0.1[unitb] amount of B-cells is transformed into the immune memory cells every time its concentration increases by 25[unitb]. The immune memory cells have an infinite lifetime but are not activated in the primary response.
When the same type of antigens invade the system secondly, we assume the following. When the amount of the antigens exceed 50[unitf], the immune memory cells with the idiotype are activated, and they are going to have the same properties as clone except the maturation and the proliferation functions. Here, . In particular, these cells reserve immune memory cells and the value of changes as (5).
Since the response by the activated memory cells will be quicker than normal cells, we assume that the maturation and the proliferation functions and for activated memory cells vary more rapidly as functions of than those for normal cells. See Fig.3.

In this paper, we assume that and have the same rectangular shape. Its height is 1 and the width is 700. is shifted to right from by . Under these assumptions, we perform numerical simulations.
3.1 Numerical results of model 1
Before invasion by the antigens, none of the clones is activated, that is, and . We assume that at time , antigens with the concentration invade the system and when reaches 30[unitb] for the first time, somatic hypermutation takes place. When the immune response ends, clones 2 to 5 disappear because of . The second invasion by the same antigens with the concentration takes place at about 100[day].
We display an example of the simulations with and in Fig.4.

The half-life of the antigens, i.e., the period that the amount of the initial antigens becomes half, is 9.2 days in the primary response and is 3.8 days in the secondary response. Thus, the system responds to the antigens more quickly in the secondary response than in the primary response. From the figure, we note that in the first and the second invasion by the antigens clone 4 which has the strongest interaction with the antigens among clones responds to the antigens mostly. That is, feature 2, affinity maturation, is realized. However, the sum of concentrations of all antibodies in the secondary response is at most three times as many as that in the primary response. That is, feature 1 is not realized in present model.
Next, we display another example of the simulations with and in Fig.5.

In this case, clone 2 which appears by class switching responds to the antigens mostly in the first and the second invasions and affinity maturation does not take place. The reason for this is considered as follows. For any clone with a large affinity to the antigens, if is large, becomes very large and then the values of and become nearly 0. Thus, clone responds to the antigens very slowly or does not respond to them any more. In real immune responses, if the amount of the antigens is low, the B-cells with high affinity respond to the antigens, and if it is high, any B-cells respond to the antigens irrespective of their affinity [1]. Therefore, the present result that affinity maturation takes place for the concentration of the antigens which are not too small and not too many is consistent with this fact. The half-life of the antigens is 5.5 days and 3.7 days for the primary and the secondary responses, respectively. Comparing this result with that for and , we note that the half-life in the primary response is reduced by about 4 days. This result also indicates that when the amount of the antigens is large, the neutralization of antigens by antibodies secreted by any B-cells is preferential to affinity maturation.
In order to confirm the necessity of feature 5, we performed a simulation in which the apoptosis rate is not changed throughout immune responses. The result for and is shown in Fig.6. As is clearly seen from the figure, enough antibodies to neutralize antigens completely are not produced, and antigens remain after the primary response finishes. Therefore, the reduction of the apoptosis rate in immune responses is necessary in order to produce enough antibodies to neutralize all antigens.

In model 1, feature 1 was not realized. Then, we study model 2 taking the time delay of the response into account in the next section.
4 Introduction of time delay: Model 2
We introduce the time delay in order to reflect feature that in real immune responses the maturation and the proliferation for B-cells require some time delay after exposure to the antigens. This effect is realized by substituting for in of eq. (3) and by substituting for in of eq. (4). We set [day] and [day]. Other s and in eqs. (3), (4) and (3) are not changed. The existence of the immune memory cells is taken into account in model 2 as well as model 1. We display an example of the simulations with and in Fig.7. In Fig.8, we display the semi-log plot of the concentrations of the antigens, IgM (clone 1) and IgGs (clones 2 to 5).


As is clearly seen from the Fig.8,
the sum of concentrations of all antibodies
in the secondary response is more than 10 times
higher than that in the primary response.
That is, the introduction of the time delay results in
the creation of the huge amount of the antibodies in the secondary
response and feature 1 is realized.
Affinity maturation is also realized.
Let us look at the detail of the time sequences.
In the primary response, somatic hypermutation takes place at 9.5-th day
after the first invasion by the antigens, and the sum of IgG concentrations takes
its maximum value 1,900[unitf] at 17-th day.
On the other hand, in the secondary response,
the IgM concentration becomes
maximum at 7-th day after the second invasion by the antigens and
the sum of IgG concentrations takes its
maximum value 23,000[unitf] at 10.5-th day.
In real systems, the amount of antibodies becomes maximum in about
10 days to two weeks in the primary response and it becomes maximum
faster in the secondary response.
Thus, the present results about dates when the
amount of antibodies becomes maximum are similar to those in real systems.
The half-life of the antigens is 13.7 days in the primary response and
is 5 days in the secondary response. Both of them are longer than those
in model 1, respectively.
This is because it takes time in present model
for antibodies to increase due to the existence of the time delay
for the response.
Further, we studied model changing the values of the time delays and and found that for , the amount of the antibodies in the secondary response can be extremely high compared to those in the primary response. On the other hand, for , the amounts of antibodies are similar both in the primary and secondary responses. We investigated antibody concentrations by changing under the condition . Then, we found that at , the concentration of an antibody goes to infinity in the secondary response. This implies that in present model the antibodies in the secondary response can be any amount if and are chosen appropriately, and the criterion on the amount of antigens for feature 1 we set is irrelevant to the conclusion. Therefore, we could construct model in which features 1 and 4 are satisfied by taking into account features 2, 3, 5 and 6.
5 Introduction of anti-idiotypic antibody : Model 3
In the previous sections, we have assumed the immune memory cells. In real systems, it is known that when one kind of antigens invade the system, not only the antibodies which interact with the antigens are produced, but also anti-idiotypic antibodies which interact with the antibodies are produced. Therefore, theoretically, it is possible that the invasion by the antigens provokes the creation of the antibodies and the anti-idiotypic antibodies, and they stimulate each other and retain their concentrations spontaneously, even after the elimination of the antigens.
In order to investigate whether this scenario is possible or not, we introduce an anti-idiotypic clone C1 which can respond to clone 1, and also a clone Ci which can respond to clone that appears by somatic hypermutation. For simplicity, we do not consider class switching. Since we mainly have interest in the possibility of retaining the concentrations of immune cells which are produced after the first invasion by an antigen, we do not assume the immune memory cells and the change of the apoptosis rate, and do not introduce the time delay. That is, model 3 is basic model with somatic hypermutation and anti-idiotypic antibodies.
Now, we explain model 3 in detail. See Fig.9.
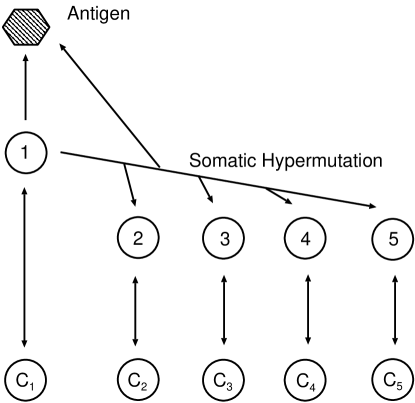
We assume that clones 2, , 5 appear by somatic hypermutation. Clones 1, have the same parameters as in basic model. On the other hand, for clones 2 to 5, the parameters are the same as in basic model, but . Initially, clone 1, and clones to are in the rest state. We assume that the strength of the interaction between clone and clone is 10 for . As for the strength of the affinity , we set and . Further, we adopt a more natural assumption that somatic hypermutations take place at different times successively, because all phases of the oscillations would be the same if they took place at the same time as in models 1 and 2. We assume that at the first invasion by the antigens, when exceeds 30[unitb] for the first time, clone 1 undergoes somatic hypermutation and clone 2 appears. Further, we assume that somatic hypermutation takes place three times, once a day after the first somatic hypermutation. At each somatic hypermutation, 20 of the concentration of clone 1 is transformed into new clone. That is, we put and , where is the concentration of clone 1 just before the somatic hypermutation. Under these assumptions, we perform numerical simulations.
We display two examples of the simulations with and in Fig.10 and Fig.11. In two examples, the timing of the second invasion by the antigens differs.


As is seen in Fig.10, after the first invasion, 4 pairs of clones remain showing oscillatory behavior, but clone 3 which has the smallest disappears. The similar results that clones with the smaller disappear are obtained for other choices of s, if the values of s are not too large. That is, the first process of affinity maturation, which is explained in the introduction, is realized. On the other hand, if the value of is large, clones with smaller remain and the others disappear. In the secondary invasion, remaining clones are not necessarily clones with larger . In fact, whether a clone remains or not depends on the phase of the oscillation of the antibody concentration at the moment when the antigen invades. If is small when the antigen invades, is large and then is large. Thus, and tend to 0. For , once tends to 0, clone disappears, because of , i.e., no B-cell supply from the Bone marrow. However, since the phase of the oscillation of each clone differs from each other, not all clones disappear. On the other hand, feature 1 was not realized in this model.
6 Summary and discussions
We studied the second generation immune network model introduced by Varela et al., and taking into account features of the immune response we tried to realize the following two observed features.
1. The amount of antibodies produced by the secondary response is more than 10 times larger than that produced by the primary response[1].
4. Affinity maturation. Among B-cells which are produced by somatic hypermutation, B-cells with higher affinity to antigens remain, and they secrete a huge amount of antibodies[2, 4].
First, we studied model 1 in which somatic hypermutation of clones, the immune memory cells and the change of the apoptosis rate are taken into account. Then, we found that affinity maturation is realized for some range of the concentration of invading antigens. This result is consistent with the known fact that if the amount of the antigens is low, the B-cells with high affinity respond to the antigens, and if it is high, any B-cells respond to the antigens irrespective of their affinity.
As for immune memory cells, we assumed that they are activated when the antigen concentration exceeds a threshold in the secondary response. The reason for setting the threshold of the activation of the memory cells not for the sensitivity but for the antigen concentration is to see its effect by activating all memory cells at the same time. If we gave the threshold of the activation of the memory cells for , affinity maturation would be realized more clearly.
On the other hand, we could not realize feature 1 in model 1. The reason is considered as follows. In model 1, when the antigens invade the system secondly, the immune memory cells become the activated B-cells and their maturation takes place instantaneously. Thus, the system neutralizes the antigens before the proliferation of the B-cells takes place sufficiently. Then, the concentrations of antibodies do not increase very much. In reality, when the antigens invade the system, it takes time for the immune cells to recognize the antigens. Thus, it is natural to introduce the time delay for the system to detect the antigens. Therefore, as a more realistic model, we considered model 2 in which the delay time of the response to the invasion by the antigens is taken into account. We assumed somatic hypermutation of B-cells, the immune memory cells and the change of the apoptosis rate as well as in model 1. As a result, the response of the system at time is caused by the amount of the antigens at time , and it takes time for the immune memory cells to maturate, and then the B-cells have enough time to proliferate and feature 1 is realized. Thus, we found that the time delay is one of the most important factors to realize feature 1 in present model. Another important factor is the introduction of different maturation and proliferation functions for activated memory cells from those for normal B-cells. If we adopt the same maturation and proliferation functions for activated memory cells as those for normal B-cells, the amounts of antibodies do not differ between the primary and secondary responses even if the time delay is taken into account. This assumption to take different maturation and proliferation functions in normal and activated memory cells is reasonable, because in reality, the activated memory cells respond to antigens more quickly than normal cells.
In models 1 and 2, as a mechanism of memorizing the primary invasion by antigens, we assumed the existence of immune memory cells whose maturation and proliferation functions increase rapidly for small value of the sensitivity . It is interesting to see if there is another mechanism to memorize the invasion by antigens without assuming immune memory cells. One such candidate is the interaction between antibodies and their anti-idiotypic antibodies which was originally proposed by Jerne in order to activate an immune system spontaneously without the stimulation by antigens. In order to see whether the idea works or not, in model 3, we introduced anti-idiotypic antibodies which respond to antibodies. We did not assume the immune memory cells, the change of the apoptosis rate and the time delay in the immune response. As a result, we found that the several pairs of antibodies and anti-idiotypic antibodies with higher affinities stimulate and inhibit each other, and their concentrations oscillate in time and are retained after the primary response finishes. Thus, the first process (a) of affinity maturation is realized. Although several clones always survive after the secondary invasion by the antigens, clones which can survive depend on the timing of the invasion because of the oscillatory nature of the concentration of each clone. Clones with higher affinity do not always survive. Further, we found that feature 1 is not realized. We surmise that this is because the immune memory cells, the time delay and the change of the apoptosis rate are not included in this model. Although model 3 does not satisfy the desired features 1 and 2, the mechanism to retain the concentration of the immune cells in this model is interesting as the possibility of the memory of the invasion by the antigens other than the immune memory cells.
Here, we make several comments on the values of parameters
we adopted in the paper.
As for to , and ,
realistic values were chosen. As for other parameters such
as , the affinities s, and the maturation
and the proliferation functions,
we tried a lot of choices.
Now, let us discuss and .
We adopted the shape of a symmetric trapezoid for both functions
of normal cells.
One reason for this was the simplicity and another was that
we wanted to study the effect of sensitivity because the
dependences of these functions are simple and
easy to identify the regions such as
the fully maturated region, the region corresponding to
the self recognition, and so on.
We assumed that is shifted to right from by
.
This seems reasonable, because it is considered that the suppression of the proliferation
begins before that of the maturation does.
The value is set to 50 in the paper.
If the shift is too large, the proliferation ends soon,
and it takes time to neutralize the antigen.
is assumed to be proportional to in
the interval .
That is, the system responds to the antigens even if their
concentration is very small. However, this assumption is not necessary.
We tried other such that
in the interval for some .
If is not too large, it does not take much time to neutralize
the antigen.
The important parameters in and are
the slope of the trapezoid and the length of
its smaller size.
Roughly speaking, the typical values of the antigen
concentration and the affinity to the antigen
are determined by the relation
| (8) |
The left hand side of eq. (8) is nothing but
the central point of the interval of the sensitivity
in which is maximum.
This relation is interpreted in terms of affinity maturation.
That is, how much affinity maturation there is, the degree of affinity maturation,
depends on the amount of the antigen. The affinity, with which B-cells
can respond to the antigen, is
large for the small amount of the antigen,
and small for the large amount of them.
As for the apoptosis, if we do not assume this,
that is, if we fix , the antibodies can not
increase sufficiently and the antigens are not completely neutralized as
was shown in this paper.
Therefore, the reduction of the apoptosis rate
is also one of the important factors
to realize features 1 and 2.
The values of parameters used in the paper were chosen by trial and error so that observed features are realized. We also confirmed that the robustness of the values of these parameters, that is, slight change of the values of the parameters did not change the qualitative behavior of the system. For example, if we take similar maturation and proliferation functions in both normal and activated memory cells, and make the height of those functions larger in activated memory cells than in normal cells, we get a lot of antibodies in the secondary response. Further, we investigated immune responses by changing other parameters of maturation and proliferation functions for activated memory cells. As a result, we found that it is possible for activated memory cells to produce a lot of antibodies by making the slope of the left edge of the trapezoid steeper.
As for the plausibility of the values of the parameters, we have not looked into it in this paper, because we do not have interest in constructing realistic models taking into account as many factors in real systems as possible, but have interest in the mechanisms and factors to realize important features of immune responses.
References
- [1] I. Roitt, J. Brostoff and D. Male, IMMUNOLOGY, 5th edition, (1998), Mosby International Ltd.
- [2] B. Alberts, A. Johnson, J. Lewis, M. Raff, K. Roberts and P. Walter, Molecular Biology of The Cell, fourth edition. Newton Press (2004)
- [3] M. Muramatsu, K. Kinoshita, S. Fagarasan, S. Yamada, Y. Shinkai and T. Honjo, Cell 102 (2002) 553-563.
- [4] H. Song, X. Nie, S. Basu and J. Cerny, Immunological Reviews162(1998)211-218.
- [5] J. Eeva and J. Pelkonen, Apotptosis 9 (2004) 525-531.
- [6] F. J. Varela and A. Coutinho, Immunology Today 12(1991)159-166.
- [7] N. K. Jerne, Ann.Inst. Pasteur Immunol.125C(1974) 435-441.