Some protein interaction data do not exhibit power law statistics
2 Developmental and Cell Biology, University of California, Irvine
3 Control and Dynamical Systems, California Institute of Technology)
Abstract
It has been claimed that protein-protein interaction (PPI)
networks are scale-free based on the observation that the
node degree sequence follows a power law. Here we argue
that these claims are likely to be based on erroneous
statistical analysis. Typically, the supporting data are
presented using frequency-degree plots. We show that such
plots can be misleading, and should correctly be replaced
by rank-degree plots. We provide two PPI network examples
in which the frequency-degree plots appear linear on a
log-log scale, but the rank-degree plots demonstrate that
the node degree sequence is far from a power law. We
conclude that at least these PPI networks are not scale-free.
Keywords: Protein-protein interaction (PPI) networks, node degree sequence, power law, rank-degree plot.
List of abbreviations PPI: Protein-protein interaction, SF: Scale-free, SR: Scale-rich
1 Introduction
Experimental data on protein-protein interaction (PPI) networks have been extensively gathered with the aim of acquiring a system-level understanding of biological processes [1, 2]. Various statistical features of complex graphical structures have received attention, including the size of the largest connected component, the node degree distribution, the graph diameter, the characteristic path length, and the clustering coefficient. However, the feature that has attracted the most attention is the distribution of node degree (the number of links from a node) and whether or not the distribution follows a power law (linear plot on log-log scale). The degree distribution of PPI networks was claimed to follow a power law in [3], and thus PPI networks are considered to be ”scale-free” (SF) [4], a generic property of network topologies common to various networks in different domains, from social networks and biological systems to the Internet.
Although “scale-free” has not been clearly defined in the existing literature [4], most treatments assume that a power law node degree distribution is an important, and sometimes defining feature. Other characteristics described in the SF literature include failure tolerance but attack vulnerability at hubs (nodes possessing high degree) and various kinds of self-similarity. A recent attempt at a more theoretically rigorous treatment [5] shows however that no additional features follow from power law node degree sequence alone, and require additional restrictions, such as high likelihood of occurrence by random generation (e.g. by preferential attachment). Other work [6, 7] has highlighted important differences between PPI networks and ”SF networks” constructed by a stochastic growth model. Moreover, one may question the rigor with which the power law node degree distribution, the primary feature of SF networks, has been demonstrated in certain examples.
This letter shows that the node degree sequences of some published PPI networks are better described by an exponential function when properly plotted and analyzed. The problem with previous work is that data were plotted using frequency-degree plots, as is common in papers purporting to discover power laws in complex biological systems, which lead to systematic errors compared with rank-degree plots. We demonstrate here that data plotted on a loglog scale frequency-degree plot may appear to be linear, but when the same data are plotted on a loglog scale rank-degree plot, they are clearly shown not to be power law. Thus, the data for some PPI networks lack even the minimal features of scale-free networks.
2 Materials and Methods
Publicly available data for PPI networks represent only an approximation of the real interaction network because of the large number of false positive and false negative interactions. However, because of the assumed self-similarity features of SF networks, it has been claimed that if the real PPI network is SF, then any appropriately sampled subnetwork is also SF [8]. Thus, we might still gain valuable information by examining whether the publicly available PPI network data possess a power law node degree distribution characteristic of SF networks.
A finite sequence of node degrees ) of integers, assumed without loss of generality always to be ordered such that , is said to follow a power law if
| (1) |
where is (by definition) the rank of , is a constant, and is called the scaling index. Because of the ordering, the rank is the number of nodes with the degree equal or larger than . Since , the rank versus the node degree plot on a loglog scale appears as a straight line of slope . In contrast, is said to follow an exponential if
| (2) |
where and are constants. The versus plot on a semilog scale approximates a straight line of slope of since .
Note that the rank-degree relationships (1) and (2) are non-stochastic, in the sense that there need be no assumption of an underlying probability distribution for the sequence . Indeed, no coherent justification has been given for why biological networks should be viewed as samples from a random ensemble. On the contrary, what is known of evolution would suggest that it yields extremely nonrandom structure at every level of organization. Nevertheless, random graphs have been remarkably popular models for biological networks, but have led to substantial confusion, particularly with regard to power laws. Suppose a non-negative random variable has cumulative distribution function (CDF) . In this stochastic context, a random variable or its corresponding distribution function is said to follow a power law with index if, as ,
| (3) |
for some constant and a tail index , where as if as . We call (3) the stochastic form of power law rank-degree relationship. The loglog plot of versus appears as a straight line of slope for large . If the CDF satisfying (3) is differentiable, then its derivative, the probability density function , satisfies
| (4) |
The loglog plot of versus also would be a line of slope . In contrast to the rank-degree relationships (1) and (2), the definitions in (3) and (4) are stochastic and require an underlying probability model. As is standard in physics, the SF literature almost exclusively assumes some underlying stochastic models, and power law node degree distributions are typically investigated in terms of the frequency-degree relationship based on the probability density function .
In the case of node degree of graphs the data is inherently discrete. Even if the data were sampled from some ensemble, is not differentiable and the frequency-degree plots simply do not make sense and can easily lead to mistakes. Furthermore, differentiation of noisy data, such as PPI data, amplifies errors, making frequency-based data uninformative and ambiguous. A typical approach to overcome these problems is to smooth the data or to group individual data values into a small number of bins, and then plot the relative number of data values in each bin. The problem is that this smoothing or binning process can dramatically change the nature of frequency-based statistics as will be shown below (Figs.1 and 2). This use of ad hoc statistical analysis can lead to concluding incorrectly that a power law relationship is present (or absent). This problem is easily avoided if one were to make rank-degree plots of raw data instead of using frequency-degree plots to check the power law or exponential relationships in (1) and (2).
From among many publicly available studies on PPI networks, we used the filtered yeast interactome (FYI) data set [10] and the predicted human protein-interaction (HPI) map [11] to illustrate these points. Much of the original data suffers from numerous false positives and false negatives, but more recent investigations have sought to refine the data. For example, the FYI data set contains high-confidence interactions for yeast, each observed by at least two different methods, thereby enriching for genuine positives. The HPI map was generated using data from seven experimental and four computationally predicted protein-interaction maps from Saccharomyces cerevisiae [12, 13, 14, 15, 16, 17], Drosophila melanogaster[18] and Caenorhabditis elegans [19]. The idea is that a human protein interaction can be predicted if orthologs in a model organism show an interaction. Its accuracy has been assessed in [11]. We consider both FYI and HPI to be refined data sets, and investigate whether their node degree sequences follow a power law, a defining feature of scale-free networks, by rank-degree plots.
3 Results and Discussion
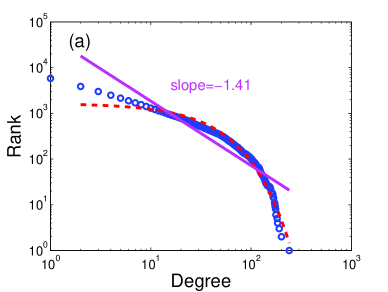
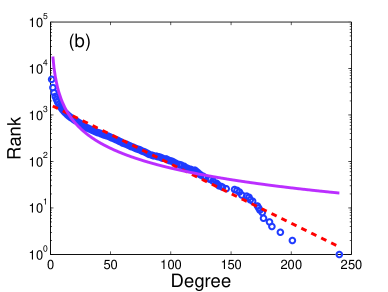
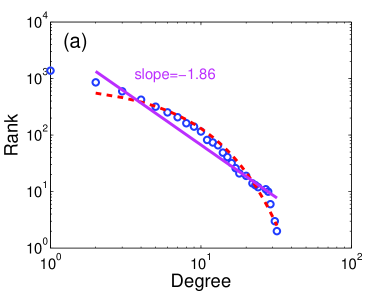
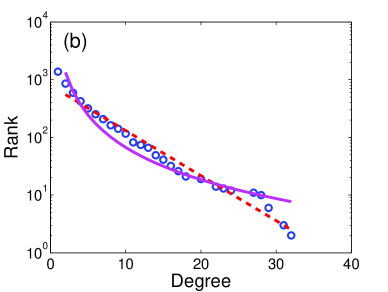
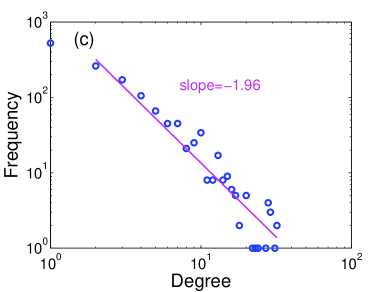
The rank-degree plots of the HPI and FYI data are shown in (a) loglog scale and (b) semilog scale in Figs. 1 and 2, respectively. The straight lines and the dotted curve in loglog scale (a) show least-squares fitting of data to a power law with the value of its slope and to an exponential, respectively. The same fittings are depicted as the curve and the dotted straight line in semilog scale (b). From these figures, we can clearly conclude that the node degree sequences of HPI and FYI data are much closer to an exponential (2), and are clearly not power laws (1). More sophisticated statistical analysis can be used to confirm these conclusions. In addition, the rank-degree plots show raw data and readers can easily judge at a glance the relative suitability of various models.
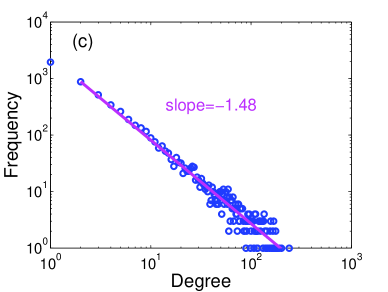
However, using frequency-degree plots (c) in Figs.1 and 2 could lead to the erroneous conclusion that the node degree sequence appears to follow a power law, although the correct rank-degree plot clearly shows that this is not the case. Furthermore, even if the PPI data were a power law, the slope for frequency-degree plot is simply not related to the slope for the rank-degree plot by , as holds for differentiable distributions. These results conclusively demonstrate that these two refined PPI data sets are not power laws, and thus certainly not scale-free, no matter how this is defined.
It is in principle possible that the data studied here is misleading and real PPI networks might have some features attributed to scale-free networks. At this time we only can draw conclusions about (noisy) subgraphs of the true network since the data sets are incomplete and presumably contain errors. However, the fact that these subgraphs exhibit an exponential node degree sequences suggests that the entire network is not SF. Appropriately sampled subraphs of a SF graph should be SF, and hence possess a power law node degree sequence. Furthermore, a SF network possessing significant non-SF subnetworks could not be considered to be self-similar, a typically assumed though as yet unproven feature of scale-free networks. Finally, since essentially all claims that biological networks are scale-free are based on error-prone frequency-degree analysis, this analysis must be completely redone to determine the correct form of the degree sequences.
It has also been shown [20, 21] that the Internet and cell metabolism, the two most prominent examples of SF networks, might have power laws for some degree sequences, but have none of the other features attributed to scale-free networks. One important feature of the Internet and metabolic networks is the complete absence of centrally located high-degree hubs which are responsible for global network connectivity and whose removal would fragment the network, in contrast to what has been claimed in the SF literature. Metabolic networks have also been shown to be scale-rich (SR), but not SF, in the sense that they are far from self-similar [21] despite some power laws in certain node degree sequence. Their power law node degree sequence is a result of the mixture of exponential distributions in each functional module. In principle, PPI networks could have this SR structure as well, and perhaps power laws could emerge at higher levels of organization. This will be revealed only when a more complete network is elucidated. Still, the most important point is not whether the node degree sequence follows a power law, but whether the variability of the node degree sequences is high or low [21], and the biological protocols that necessitate this high or low variability. These issues will be explored in future publications.
The authors thank Nicolas Bertin and Marc Vidal for providing FYI data.
References
- [1] Uetz, P. and Finley, R.L.Jr. (2005). From protein networks to biological systems. FEBS Lett. 579, 1821-1827.
- [2] Vidal, M. (2005). Interactome modeling. FEBS Lett. 579, 1834-1838.
- [3] Jeong, H., Mason, S.P., Barabási, A.-L. and Oltvai, Z.N. (2001). Lethality and centrality in protein networks. Nature 411, 41-42.
- [4] Barabási, A.-L. and Oltvai, Z.N. (2004). Network biology: understanding the cell’s functional organization. Nature Reviews Genetics 5, 101-114.
- [5] Li, L., Alderson, D., Tanaka, R., Doyle, J.C. and Willinger, W. (2005). Towards a theory of scale-free graphs: definition, properties, and implications (extended version). arXiv:cond-mat/0501169.
- [6] Przulj, N., Corneil, D.G. and Jurisica, I. (2004). Modeling interactome: scale-free or geometric? Bioinformatics 20, 3508-3515.
- [7] Valente, A.X.C.N, Cusick, M.E., Fagerstrom, R.M., Hill, D.E. and Vidal, M. (2005). Yeast protein interactome topology provides framework for coordinated-functionality. arXiv:q-bio.MN/0505006.
- [8] Yook, S.-H., Oltvai, Z.N. and Barabási, A.-L. (2004). Functional and topological characterization of protein interaction networks. Proteomics 4, 928-942.
- [9] Mandelbrot, B.B. (1997). Fractals and scaling in finance: discontinuity, concentration, risk. Springer-Verlag, NY.
- [10] Han, J.-D., Bertin, N., Hao, T., Goldberg, D.S., Berriz, G.F., Zhang, L.V., Dupuy, D., Walhout, A.J.M., Cusick, M.E., Roth F.P. and Vidal, M. (2004). Evidence for dynamically organized modularity in the yeast protein-protein interaction network. Nature 430, 88-93.
- [11] Lehner, B. and Fraser, A.G. (2004). A first-draft human protein-interaction map. Genome Biology 5:R63.
- [12] Uetz, P., Giot, L.,Cagney, G., Mansfield, T.A., Judson, R.S., Knight, J.R., Lockshon, D., Narayan, V., Srinivasan, M., Pochart, P., et al. (2000). A comprehensive analysis of protein-protein interactions in Saccharomyces cerevisiae. Nature 403, 623-627.
- [13] Ito, T., Chiba, T., Ozawa, R., Yoshida, M., Hattori, M., Sakaki, Y. (2001). A comprehensive two-hybrid analysis to explore the yeast protein interactome. Proc. Natl. Acad. Sci. USA 98, 4569-4574.
- [14] Gavin, A.C., Bosche, M., Krause, R., Grandi, P., Marzioch, M., Bauer, A., Schultz, J., Rick J.M., Michon, A.M., Cruciat, C.M., et al. (2002). Nature 415, 141-147.
- [15] Ho, Y. Gruhler, A., Heilbut, A., Bader, G.D., Moore, L., Adams, S.L., Millar, A., Taylor, P., Bennett, K., Boutilier, K., et al. (2002). Systematic identification of protein complexes in Saccharomyces cerevisiae by mass spectrometry. Nature 415, 180-183.
- [16] Tong, A.H., Evangelista, M., Parsons, A.B., Xu, H., Bader, G.D., Page, N., Robinson, M., Raghibizadeh, S., Hogue, C.W., Bussey, H., et al. (2001). Systematic genetic analysis with ordered arrays of yeast deletion mutants. Science 294, 2364-2368.
- [17] von Mering, C., Krause, R., Snel, B., Cornell, M., Olivier, S.G., Fields, S. and Bork, P. (2002). Comparative assessment of large-scale data sets of protein-protein interactions. Nature 417, 399-403.
- [18] Giot, L, Bader, J.S., Brouwer, C., Chaudhuri, A., Kuang, B., Li, Y., Hao, Y.L., Ooi, C.E., Godwin, B., Vitols, E., et al. (2003). Science 302, 1727-1736.
- [19] Li, S., Armstrong, C.M., Bertin, N., Ge, H., Milstein, S., Boxem, M., Vidalain, P.O., Han, J.D., Chesneau, A., Hao, T., et al. (2004). A map of the interactome network of the metazoan C.elegans. Science 303, 540-543.
- [20] Li, L, Alderson, D., Doyle, J. and Willinger, W. (2004). A first principles approach to understanding the Internet’s router-level topology. Proc. ACM SIGCOMM 2004.
- [21] Tanaka, R. (2005). Scale-rich metabolic networks. Phys. Rev. Lett. 94, 168101.