Length, Protein-Protein Interactions, and Complexity
Abstract
The evolutionary reason for the increase in gene length from archaea to prokaryotes to eukaryotes observed in large scale genome sequencing efforts has been unclear. We propose here that the increasing complexity of protein-protein interactions has driven the selection of longer proteins, as longer proteins are more able to distinguish among a larger number of distinct interactions due to their greater average surface area. Annotated protein sequences available from the SWISS-PROT database were analyzed for thirteen eukaryotes, eight bacteria, and two archaea species. The number of subcellular locations to which each protein is associated is used as a measure of the number of interactions to which a protein participates. Two databases of yeast protein-protein interactions were used as another measure of the number of interactions to which each S. cerevisiae protein participates. Protein length is shown to correlate with both number of subcellular locations to which a protein is associated and number of interactions as measured by yeast two-hybrid experiments. Protein length is also shown to correlate with the probability that the protein is encoded by an essential gene. Interestingly, average protein length and number of subcellular locations are not significantly different between all human proteins and protein targets of known, marketed drugs. Increased protein length appears to be a significant mechanism by which the increasing complexity of protein-protein interaction networks is accommodated within the natural evolution of species. Consideration of protein length may be a valuable tool in drug design, one that predicts different strategies for inhibiting interactions in aberrant and normal pathways.
keywords:
protein-protein interactions , subcellular locations , essential genePACS:
87.14.Ee , 87.15.Kg , 87.23.-n1 Introduction
It has been noticed that genomes from the various domains of life differ greatly in size. For example, the human genome is roughly 30 times larger than that of the Drosophila. It has also been noticed that protein lengths vary systematically within the three domains of life [1]. The eukaryote domain is found to have the longest average protein length per genome, while the archaea domain is found to have the shortest average protein length per genome. Investigations to date have not been able to pinpoint the biological significance or evolutionary mechanism for these observations.
Following a suggestion in [1], we here propose that protein lengths are correlated with genome size in order to cope with the increased complexity of protein-protein interactions that arises within larger genomes. Examples of increased complexity and functionality associated with larger systems abound in engineering and biology. In the highly-optimized tolerance theory of Doyle, complexity of an engineering or biological system is postulated to be a requirement of robustness [2]. It is implicitly assumed in this theory that selection for increased robustness leads to larger, and more complex, systems. In simple liquid crystals, incorporation of additional molecular species can lead to the formation of new phases [3]. In materials science, it is well-known that the number of possible material phases increases dramatically with the number of elements present [4]. In protein structural biology, it is known that a finite number of distinct amino acids, more than two and typically on the order of five, is required to reproduce characteristic protein structures [5]. In polymer physics, the complexity of material phases increases greatly as consideration is expanded from homopolymers to diblock copolymers [6] to triblock polymers [7]. Organization of the collective dynamics of social networks, the internet, or traffic flow into so-called small world networks allows for efficient communication within large systems [8]. The latter finding is relevant in the present context, because interactions between proteins have been shown to increase with the number of proteins present at a rate that is consistent with small-world-network theory [9].
In this paper, we show that a positive correlation exists between protein length and the number of subcellular locations in which a protein is found. For yeast, we shown additionally a positive correlation between protein length and number of observed protein-protein interactions. This positive correlation of complexity with length supports the hypothesis that an increase in protein length is necessary for an increased number of specific interactions, on average. The positive correlation is shown to exist for prokaryotes and eukaryotes. Based upon these considerations of length, it is shown that most single-drug protein inhibitors are inhibiting a particular receptor or target site on a protein, rather than knocking out the whole protein.
Methods and Results
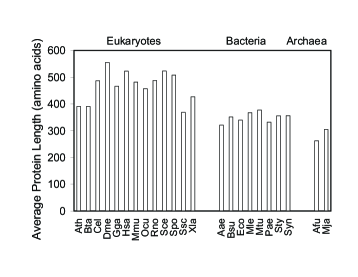
Protein length comparisons across the three domains of life were performed utilizing the Meta-A annotation of the SWISS-PROT database [10]. This allowed determination of lengths of expressed proteins. The average protein lengths were determined for each organism whose genome had a large number of completely sequenced expressed proteins. The standard error estimate of the average was also calculated. Thirteen eukaryotes, eight bacteria, and two archaea were analyzed for comparisons of protein length for the entire genome. These species were chosen because they have the highest frequency of entries in the SWISS-PROT database. The Meta-A database was made non-redundant by removing entries with different accession numbers but identical sequences as returned by a SWISS-PROT FASTA query [11], of which there were very few. Accession numbers that corresponded to protein fragments were also removed. Shown in table 1 are the numbers of proteins used within each species.
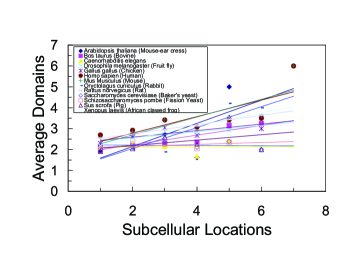
The Meta-A annotation determines with which subcellular locations each protein is associated. This number of subcellular locations is used as one measure of the number of interactions in which a protein participates. Thus, the data from the analysis of the SWISS-PROT database is separated according to each organism and according to the domain of life, archaea, bacteria, or eukaryote, to which the organism belongs. Each protein of the organism is then categorized according to how many subcellular locations to which it is associated. The possible subcellular locations are intracellular, membrane related, extracellular, cytoplasmic, transmembrane, mitochondrial, chloroplast, nuclear, endoplasmic reticulum/Golgi apparatus, viral, and DNA binding. For the archaea domain the number of locations ranges from one to four, for the bacteria domain the number ranges from one to six, and for the eukaryote domain the number ranges from one to seven. The locations nuclear, mitochondrial, chloroplast and ER/Golgi are available only for the eukaryote proteins. There is no protein that is associated with all of the compartments for bacteria and eukaryotes. The number of amino acids in each protein is downloaded from SWISS-PROT. The average length of a protein is correlated by a linear least squares fit with the number of subcellular locations for each species (a non-linear correlation does not substantially better represent the data). The standard error estimate of the slope of the correlation (and -statistic) was calculated. The number of domains contained within each protein was also calculated, using the Pfam database (swisspfam datafile) [12], and correlated by a linear least squares fit with the number of subcellular locations. The standard error estimate of the slope of the correlation (and -statistic) was calculated.
Number of protein interactions for S. cerevisiae is determined from two databases, the updated data of Uetz et al. [13] and the comprehensive MIPS database [14]. The number of protein-protein interactions was correlated with protein length by a linear least squares fit, and the standard error estimate of the slope of the correlation (and -statistic) was calculated. It was necessary to make the set of associated interacting proteins non-redundant for each protein within MIPS. For both Uetz et al. and MIPS, all proteins with greater than zero interactions were used, starting from those within the Meta-A dataset. These data were used to correlate protein length directly with number of interactions. Those proteins within the Meta-A protein dataset that are essential were determined from the Saccharomyces Genome Deletion Project [15]. The relationship between protein length and the probability that the encoding gene is essential was determined. The standard error estimate of the probability was also calculated.
Finally, a list of protein targets of known, marketed drugs was constructed by selecting from the Harvard Small Molecule Bioactives Database [16] those compounds that targeted a specific protein which could be identified in SWISS-PROT. Of the greater than 2000 compounds in the database, 186 targeted a specific protein, of which 100 were unique. The number of drug targets is in agreement with Pfizer’s proprietary list of protein drug targets, which contains 120 unique proteins [17].
Figure 1 shows the plot of the average protein lengths for the various genomes across the three domains of life. The mean values of the protein lengths decrease from eukaryote to bacteria to archaea. This trend in protein lengths is identical to that previously observed for gene lengths [1].
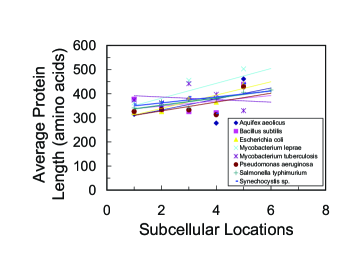
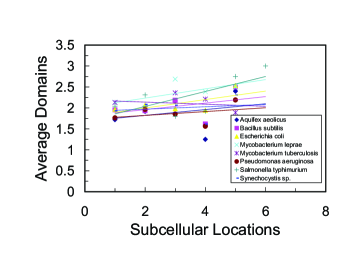
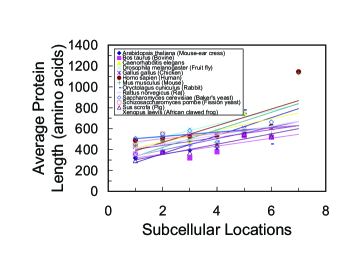
Figure 2 shows a positive correlation between average protein length and number of associated subcellular locations for the bacteria domain. Figure 3 shows a positive correlation between average protein length and number of associated subcellular locations for the eukaryote domain. Positive correlations are found for all thirteen eukaryote species shown in figure 3. A similar correlation was not found for the archaea domain (data not shown). Also shown in figures 2 and 3 are the correlations between number of domains within a protein and number of associated subcellular locations.
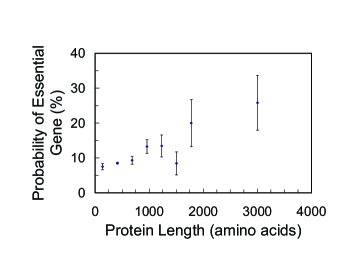
The probability that a protein of a given length will be encoded by an essential gene is shown in figure 4. A positive correlation is found between length and essentiality.
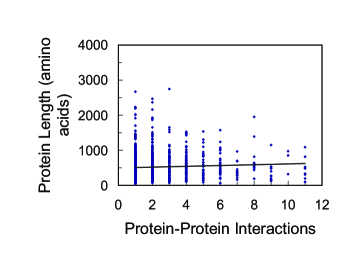
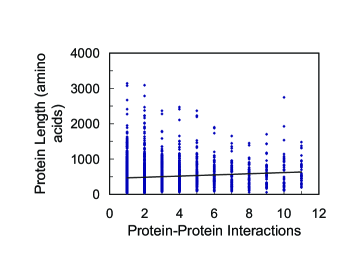
The number of interactions for yeast proteins of various lengths is shown in figure 5. Since the data become sparse for large numbers of interactions, only those proteins with fewer than a dozen interactions are shown.
The average lengths and number of subcellar locations of human proteins are shown in table 2, along with these same quantities for the protein targets of marketed drugs.
Discussion
That proteins must be longer in order to achieve and distinguish among an increased number of interactions is a mechanistic explanation for the positive correlations found in bacteria and eukaryotes. At a more coarse-grained level, comparisons between human, fly, worm, and yeast have shown that the human proteome set contains 1.8 times as many protein domains as the worm or fly and 5.8 times as many as yeast [18]. Moreover, the average eukaryote gene length is roughly 1.4 times the average bacterial gene length and 1.6 times the average archaea gene length [1]. The increase in the number of domain architectures and genome complexity correlates with the observed increase in protein length. The larger vocabulary of protein domain architectures allows the more evolved systems to accommodate an increased number of interactions.
The results in figures 2 and 3 are statistically significant. Most significant is that if one assumed the correlations were random, with a slope symmetrically distributed about zero, the probability that 20 or more out of 21 of these correlations would be positive is . Taken in aggregate, therefore, figures 2a and 3a suggest that there is a highly significant and positive correlation between protein length and number of subcellular locations to which a protein is associated. At the level of each individual correlation, the average -statistic for the positive correlations in figure 2a is 1.80, and that of figure 2b is 0.87. The average values are 0.64 and 0.44, respectively. The average -statistic for the positive correlations in Figure 3a is 2.46, and that of figure 3b is 2.70. The average values are 0.80 and 0.65, respectively. Interestingly, the correlations for the eukaryotes are somewhat more significant ( for figure 3a) than those for the bacteria ( for figure 2a). For the bacteria, the correlations with protein length observed in figure 2a are slightly more significant than the the correlations with number of domains observed in figures 2b. For the eukaryotes, the correlations with protein length are of roughly the same significance as those with number of domains.
An alternative means of correlating length with number of locations would be to use all of the protein entries, rather than preaverage them within each location, as in figures 2a and 3a. When this is done for the bacteria, the positive correlations persist, except for Aquifex aeolicus, Bacillus substilis, and Synechocystis sp. Similarly, when this is done for the eukaryotes, the positive correlations persist, except for Saccharomyces cerevisiae. Overall, then, the trend of increasing number of interactions with increasing length among the prokaryotes and eukaryotes is rather robust to the means of measurement. The average -statistic for the positive correlations determined by this method for the analog of Figure 2a is 2.5035, and the average -statistic for the positive correlations determined by this method for the analog of figure 3a is 6.454, with the increased significance due to the greater number of data points.
The topological scaling properties of metabolic networks of organisms show similarities to complex systems in general [19]. The topology of these scale-free networks is dominated by highly-connected nodes, “hubs,” that link together the less-connected nodes. Deletion of these hubs is an especially efficient way to destroy the connectivity of the network [20]. From our results, the hub proteins of large protein-protein networks are more likely to be the longer proteins, since we have shown that longer lengths typically possess more inter-protein interactions. Figure 4, moreover, explicitly shows that longer proteins are more essential, precisely because they are more connected [21].
As shown in table 2, protein targets of known drugs are not substantially shorter or less numerous in number of subcellular interactions than are average human proteins. Given the above arguments about protein-protein networks, this lack of difference might seem surprising [22]. What this result implies, in fact, is that most known single-drug protein inhibitors are inhibiting a particular receptor or target site on a protein, rather than knocking out the whole protein.
If it is desired to disrupt a pathway with many distinct interactions, most likely the best proteins to knock out will be the longer ones. Therefore, it may be advisable for multiple drug regimen therapies that target aberrant pathways to target multiple receptors of the longest proteins of those pathways, within the set of otherwise equally suitable targets. However, if minimal disruption of a normal pathway is desired, the focus of the therapy should be on the smaller proteins or single-drug therapies. These smaller, shorter proteins are less likely to be at the center of network pathway hubs, and their deletion would be least likely to disrupt the network, all other factors being equal. From an evolutionary point of view, shorter proteins with fewer interactions would more readily be independently evolved, having fewer epistatic interactions [23]. Directed pathway evolution studies may benefit from a focus on such proteins [24].
It might be argued that number of subcellular locations is only an approximate measure of the number of interactions to which a protein participates. For yeast, there are explicit measurements of the number of protein-protein interactions. Shown in figure 5 is the positive correlation between length and number of interactions determined in yeast when all of the proteins with entries in SWISS-PROT are correlated. The correlation in figure 5a is significant to the level (-statistic ), and the correlation in figure 5b is significant to the level (-statistic ). The R values are 0.24 and 0.32, respectively. The positive correlation in figure 5 is in accord with the positive correlation found for yeast in figure 3a, and this agreement provides additional justification for the use of number of subcellular locations as a surrogate measure of number of protein interactions. There are, of course, exceptions to the general correlation between protein length and number of interactions. For example, a large number of proteins can interact with a specific short protein if all the interactions occur through the same binding site. This appears to be the case for several single-domain RNA- and DNA-binding proteins (such as SOH1, LSM2, RPB9, LSM5, and SR14). The single-domain GTP-binding protein (TEM1) as well as the membrane proton channel (AT14) of the ATPase complex are also short and bind many proteins. Notwithstanding these and other exceptions, the correlations in figure 5 are striking, and the positive correlation persists even when data for all numbers of interactions are considered (data not shown).
The positive correlations observed in the bacteria and eukaryote domains were not observed in the archaea domain. The correlations for the archaea remain negative also when all proteins are used in the correlation. Archaea have substantially fewer subcellular locations and total numbers of proteins. It is also evident from figure 1 that the archaea domain possesses the shortest proteins. The archaea domain, being the least evolved, may, therefore, lack the necessary diversity of protein-protein interactions necessary to drive the evolution of the increased protein lengths observed in the bacteria and eukaryote domain.
Conclusions
Increased protein length appears to be a significant mechanism by which the increasing complexity of protein-protein interaction networks is accommodated within the natural evolution of species. It would be interesting to measure within experimental evolution protocols [24] the degree to which selection for an increased number of specific interactions within various pathways or subsystems is a major driver of increased protein length. It also appears that consideration of protein length may be a valuable tool in drug design, one that predicts different strategies for inhibiting interactions in aberrant and normal pathways.
Acknowledgments
This research was supported by the U.S. National Institutes of Health.
References
- [1] J. Zhang, Protein-length distributions for the three domains of life, Trends in Genetics 16 (2000) 107–109.
- [2] J. M. Carlson, J. Doyle, Complexity and robustness, Proc. Natl. Acad. Sci. USA 99 (2002) 2538–2545.
- [3] J. Prost, P. G. de Gennes, The Physics of Liquid Crystals, 2nd Edition, Clarendon Press, 1993.
- [4] F. N. Rhines, Phase Diagrams in Metallurgy, McGraw-Hill Book Company, Inc., New York, 1956, Ch. 19.
- [5] D. S. Riddle, et al., Functional rapidly folding proteins from simplified amino acid sequences, Nat. Struct. Biol. 4 (1997) 805–809.
- [6] F. S. Bates, G. H. Fredrickson, Block copolymer thermodynamics–Theory and experiment, Ann. Rev. Phys. Chem. 41 (1990) 525–557.
- [7] F. S. Bates, G. H. Fredrickson, Block copolymers–Designer soft materials, Physics Today 52 (1999) 32–38.
- [8] D. J. Watts, S. H. Strogatz, Collective dynamics of ‘small-world’ networks, Nature 393 (1998) 440–442.
- [9] R. Mott, J. Schultz, P. Bork, C. P. Ponting, Predicting protein cellular localization using a domain projection method, Genome Research 12 (2002) 1168–1174.
- [10] F. Eisenhaber, P. Bork, Evaluation of human-readable annotation in biomolecular sequence databases with biological rule libraries, Bioinformatics 15 (1999) 528–535, http://mendel.imp.univie.ac.at/CELL_LOC/; Release 40.
- [11] B. Boeckmann, A. Bairoch, R. Apweiler, M.-C. Blatter, A. Estreicher, E. Gasteiger, M. J. Martin, K. Michoud, C. O. I. Phan, S. Pilbout, M. Schneider, The SWISS-PROT protein knowledgebase and its supplement TrEMBL in 2003, Nucleic Acids Res. 31 (2003) 365–370, http://us.expasy.org/sprot/; Release 41.16.
- [12] A. Bateman, E. Birney, L. Cerruti, R. Durbin, L. Etwiller, S. R. Eddy, S. Griffiths-Jones, K. L. Howe, M. Marshall, E. L. Sonnhammer, The Pfam protein families database, Nucleic Acids Res. 30 (2002) 276–280, http://www.sanger.ac.uk/Software/Pfam/index.shtml; version 9.0.
- [13] P. Uetz, et al., A comprehensive analysis of protein-protein interactions in Saccharomyces cerevisiae, Nature 403 (2000) 623–627, http://portal.curagen.com/extpc/com.curagen.portal.servlet.PortalYeastList; downloaded 1 December 2002.
- [14] H. W. Mewes, D. Frishman, U. Güldener, G. Mannhaupt, K. Mayer, M. Mokrejs, B. Morgenstern, M. Münsterkoetter, S. Rudd, B. Weil, MIPS: A database for genomes and protein sequences, Nucleic Acids Res. 30 (2002) 31–34, http://mips.gsf.de/genre/proj/yeast/index.jsp; downloaded 10 June 2003.
- [15] L. M. Steinmetz, C. Scharfe, A. M. Deutschbauer, D. Mokranjac, Z. S. Herman, T. Jones, A. Chu, G. Giaever, H. Prokisch, P. J. Oefner, R. W. Davis, Systematic screen for human disease genes in yeast, Nat. Genetics 31 (2002) 400–404, http://www-deletion.stanford.edu/YDPM/YDPM_index.html; downloaded 10 June 2003.
- [16] R. L. Strausberg, S. L. Schreiber, From knowing to controlling: A path from genomics to drugs using small molecule probes, Science 300 (2003) 294–295, http://chembank.med.harvard.edu/; downloaded 10 June 2003.
- [17] A. L. Hopkins, C. R. Groom, The druggable genome, Nat. Rev. Drug Discov. 1 (2002) 727–730.
- [18] E. S. Lander, et al., Initial sequencing and analysis of the human genome, Nature 409 (2001) 860–921.
- [19] H. Jeong, B. Tombor, R. Albert, Z. N. Oltval, A. L. Barabási, The large-scale organization of metabolic networks, Nature 407 (2000) 651–654.
- [20] R. Albert, H. Jeong, A.-L. Barabási, Error and attack tolerance of complex networks, Nature 406 (2000) 378–382.
- [21] H. Jeong, , S. P. Mason, A.-L. Barabási, Z. N. Oltvai, Lethality and centrality in protein networks, Nature 411 (2001) 41–42.
- [22] J. Hasty, J. J. Collins, Unspinning the web, Nature 411 (2001) 30–31.
- [23] D. Waxman, J. R. Peck, Pleiotropy and the preservation of perfection, Science 279 (1998) 1210–1213.
- [24] Y. X. Zhang, K. Perry, V. A. Vinci, K. Powell, W. P. C. Stemmer, S. B. del Cardayré, Genome shuffling leads to rapid phenotypic improvement in bacteria, Nature 415 (2002) 644–646.
Figures
| Species | Number of Proteins |
|---|---|
| Eukaryotes | |
| Ath | 1313 |
| Bta | 1015 |
| Cel | 1333 |
| Dme | 1383 |
| Gga | 833 |
| Hsa | 6608 |
| Mmu | 4227 |
| Ocu | 534 |
| Rno | 2572 |
| Sce | 3394 |
| Spo | 1319 |
| Ssc | 535 |
| Xla | 648 |
| Bacteria | |
| Aae | 496 |
| Bsu | 1635 |
| Eco | 3478 |
| Mle | 424 |
| Mtu | 943 |
| Pae | 527 |
| Sty | 733 |
| Syn | 694 |
| Archaea | |
| Afu | 481 |
| Mja | 769 |
| All Human | Proteins Targeted | Non-redundant | ||
|---|---|---|---|---|
| Proteins | by Drugs | Protein Targets | ||
| Number of Proteins | 6608 | 186 | 100 | |
| Average Length | 523 5.98 | 577 22.5 | 554 34.0 | |
| Average Number of Locations | 2.68 0.02 | 2.64 0.11 | 2.72 0.15 | |
| Average Number of Domains | 3.06 0.03 | 3.22 0.14 | 3.26 0.23 |