Phase synchronization in cerebral hemodynamics
Abstract
A healthy human brain is perfused with blood flowing laminarly through cerebral vessels, providing brain tissue with substrates such as oxygen and glucose. Under normal conditions, cerebral blood flow is controlled by autoregulation as well as metabolic, chemical and neurogenic regulation. Physiological complexity of these mechanisms invariably leads to a question as to what are the relations between the statistical properties of arterial and intracranial pressure fluctuations. To shed new light on cerebral hemodynamics, we employ a complex continuous wavelet transform to determine the instantaneous phase difference between the arterial blood pressure (ABP) and intracranial pressure (ICP) in patients with traumatic brain injuries or spontaneous cerebral hemorrhage. For patients with mild to moderate injury, the phase difference slowly evolves in time. However, severe neurological injury with elevated ICP are herein associated with synchronization of arterial and intracranial pressure. We use Shannon entropy to quantify the stability of ABP-ICP phase difference and discuss the clinical applicability of such measure to assessment of cerebrovascular reactivity and autoregulation integrity.
pacs:
87.80.Tq, 87.19.Uv, 87.10.+eSynchronization between different physiological systems or subsystems has long been recognized as a ubiquitous dynamical effect Glass and Mackey (1988). Examples of such synchronization are as diverse as circadian rhythm Glass and Mackey (1988); Aschoff et al. (1982), correlation of respiration with mechanical ventilation Petrill and Glass (1984) or locomotory rhythm Bramble and Carrier (1983), coordinated motion Glass and Mackey (1988), animal gait Collins and Stewart (1993), or synchronization of oscillations of human insulin secretion with glucose infusion Sturis et al. (1995). These phenomena are essentially confined to nearly periodic rhythms. However, the development of novel concepts Tass et al. (1998); Rosenblum et al. (1998) has paved the way for the application of synchrony analysis to inherently nonstationary and noisy signals; time series that are characteristic of cardiology and encephalography Schafer et al. (1998); Foucher et al. (2001) (see also references therein).
A healthy human brain is perfused with blood flowing laminarly through cerebral vessels, providing brain tissue with substrates such as oxygen and glucose. Cerebral blood flow (CBF) is relatively stable, with typical values between 45 and 65 ml/100g of brain tissue per second, despite variations in systemic pressure as large as 100 Torr. This phenomenon, known as cerebral autoregulation (CA) Paulson et al. (1990), is mainly associated with changes in cerebrovascular resistance of small precapillary brain arteries. CBF is also affected by metabolic, chemical and neurogenic regulation. Strong susceptibility of brain tissue to even short periods of ischemia underlies the physiological significance of these intricate control mechanisms. In the phenomenological description of cerebral hemodynamics, fluctuations of arterial blood pressure (ABP), due to pressure reactivity of cerebral vessels, lead to fluctuations of intracranial pressure (ICP). The goal of this paper is to quantitatively analyze the interplay of ABP and ICP from the viewpoint of synchronization. In particular, we investigate time evolution of instantaneous phase difference between ABP and ICP time series in patients with traumatic brain injuries or spontaneous cerebral hemorrhage. We examine the extent to which the relative phase dynamics reflects pathological conditions. We adopt the mathematical framework of synchronization since it is particularly well-suited to the analysis of non-stationary bivariate time series. Interestingly enough, we have not been able to find previous application of this approach to cerebral hemodynamics, see, for example Aaslid et al. (1989); Diehl et al. (1995); Tiecks et al. (1995); Panerai et al. (1999); Zhang et al. (1998); Czosnyka et al. (2002, 2003); Balestreri et al. (2004).
Let us consider two signals , and their corresponding instantaneous phases and . Phase synchronization takes place when where , are integers indicating the ratios of possible frequency locking. Herein we consider only the simplest case Furthermore, as with most biological signals contaminated by noise, we are forced to search for approximate phase synchrony, i.e. . Thus, the studies of synchronization involve not only the determination of instantaneous phases of signals but also the introduction of some statistical measure of phase locking.
The wavelet transform is an integral transform for which basis functions, known as wavelets, are well localized both in time and frequency Mallat (1998). Moreover, the wavelet basis can be constructed from a single function by means of translation and dilation . The function is commonly referred to as the mother function or analyzing wavelet. The wavelet transform of function is defined as
| (1) |
where denotes the complex conjugate of . In this work we employ the Morlet wavelet:
| (2) |
and set the bandwith parameter as well as the center frequency to 1. For a given sampling period , it is possible to associate a pseudofrequency with scale :
| (3) |
Obviously, the dual localization of wavelets makes the above frequency assignment approximate.
The instantaneous phase of a signal can be readily extracted by calculating a wavelet transform with a complex mother function Lachaux et al. (1999); Foucher et al. (2001):
| (4) |
where we explicitly indicated the dependence of phase on the scale to emphasize that we are investigating frequency-specific synchronization, i.e. transient phase-locking.
Following Tass et al. Tass et al. (1998) we characterize the strength of phase synchronization with the help of the index :
| (5) |
derived from the Shannon entropy . In the well known formula , is the number of bins and is the relative frequency of finding the phase difference within the -th bin. Due to normalization in (5), the synchronization index lies in the unit interval . A vanishing index corresponds to uniform distribution of phase differences (no synchronization) while corresponds to perfect synchronization (phase locking of the two processes).
We have applied the synchronization theory formalism (cf. equations (4) and (5)) to analyze the instantaneous phase difference between ICP and ABP time series. Both pressures were averaged over a cardiac cycle. The hemodynamic time series were invasively acquired during long-term monitoring of patients with traumatic brain injuries or spontaneous cerebral hemorrhage. The study comprised 10 juvenile patients who were admitted to the Pediatric Intensive Care Unit of Doernbecher Children’s Hospital and 10 adult subjects who underwent the surgery at the Department of Neurosurgery of Opole Regional Medical Center.
In Table 1 we collected the values of mean arterial and intracranial pressures for a juvenile patient with traumatic brain injury. From two long-term monitoring sessions, we have chosen 30 min segments from the time series and labeled them , and .
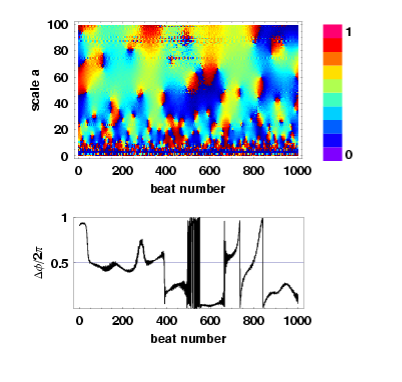
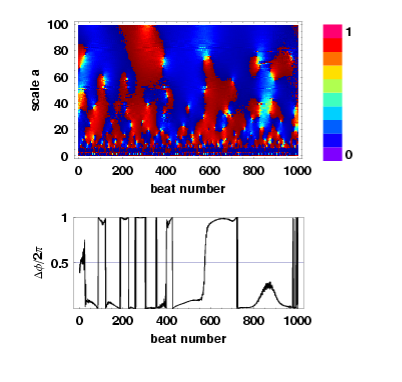
In the left column of Fig. 1 we present the synchrony analysis for data segment A from the first session. During this period the intracranial pressure remained at an elevated but physiologically acceptable level. It is interesting that for larger scales the phase difference between ICP and ABP evolves very slowly. Moreover, the distribution of colors indicates that the normalized phase difference fluctuates most of the time around 0.5. This behavior is in sharp contrast with the phase dynamics for segment B from the second session (cf. right column of Fig. 1). During this second period the increase in ICP was accompanied by the drop in ABP, which is strong evidence of the intermittent failure of regulatory mechanisms. This failure resulted in insufficient perfusion pressure. Essentially bichromatic structure of right-top panel in Fig. 1 is a clear indication of strong synchronization between arterial and intracranial pressure. This observation is corroborated by the plot of phase for which elucidates that the phase variability merely amounts to rapid transitions between 0 and 1, equivalent values from the point of view of synchronization.
In Fig. 2 the synchronization parameter for the hemodynamic data analyzed in Fig. 1 is drawn as a function of scale of the complex Morlet wavelet transform. For both curves in this plot, the prominent peak is followed by a plateau. Please note that for the chosen values of the Morlet wavelet parameters and (mean cardiac interbeat interval), gives the approximation of the pseudofrequency of the wavelet basis functions , cf. (3). The appearance of such high peaks in the low /high pseudofrequency region is not surprising since these maxima are merely the manifestation of the inability of cerebral vessels to respond to rapid changes in arterial blood pressure. In patients with severely restricted cerebral blood flow, the characteristic peaks are often missing. In Table 1 we present the values of the synchronization strength averaged over scales 30 to 100: . The maximum value of 0.34 corresponds, as expected, to the high pressure/low perfusion episode. To assess statistical significance of the observed increase we calculated for 49 surrogate hemodynamic time series Hegger et al. (1999). For the surrogate data we found the mean of equal to 0.07 and since the maximum value was 0.13, we can reject the null hypothesis that the increase was accidental, at the 97.5% level of confidence.
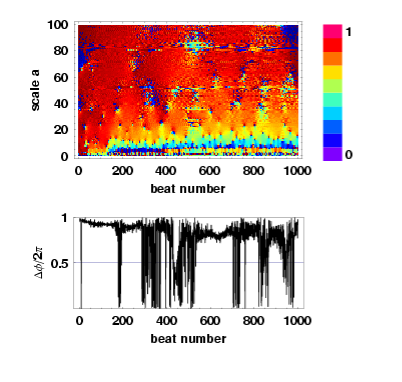
Fig. 3 shows the instantaneous phase calculations for an adult patient after a second massive subarachnoid hemorrhage which resulted in severe cerebral edema. During monitoring, the average ABP was equal to 81 Torr and the average ICP was equal to 73 Torr. In this case, not only was ICP extremely high but also perfusion was negligible. The structure of the phase map (Fig. 3) and high value of reflects strong entrainment of arterial and intracranial pressure time series. Thus, there is no doubt that the phase synchronization observed in the two case studies is pathological. In fact, for seven patients with a good clinical outcome the average value of was On the other hand, for five patients with severe injury (high ICP, low cerebral perfusion) and poor clinical outcome the synchronization parameter was consistently high and varied between 0.30 and 0.70.
The relations between the statistical properties of arterial and intracranial pressure fluctuations are poorly understood. Progress in understanding has undoubtedly been hindered by the physiological complexity of mechanisms which affect intracranial hemodynamics, see Czosnyka (2000) for references. In the widely accepted phenomenological description of the interaction between ICP and ABP, under normal conditions a decrease in ABP results in the vasolidation of cerebral vessels which increases cerebral blood volume and consequently ICP. In pathology, cerebral vessels are non-reactive and changes in arterial blood pressure are passively transmitted to ICP.
Steinmeier et al. and Czosnyka et al. Steinmeier et al. (1996); Czosnyka et al. (1997); Balestreri et al. (2004) have introduced moving cross-correlation indices which quantify the reactivity of vessels to changes in ABP. The clinical studies demonstrated that these indices are positively correlated with the high intracranial pressure, low admission Glasgow Coma Scale score and poor outcome after injury. However, moving correlation or other coherence measures based on spectral analysis cannot separate the effects of amplitude from those of phase in the interrelations between ABP and ICP signals. Complex wavelet analysis provides an effective tool for the investigation of phase relations in a chosen frequency range and consequently can shed new light on inherently nonstationary cerebral hemodynamics.
It is worth pointing out that cerebrovascular vasomotor reactivity reflects changes in smooth muscle tone in the arterial wall in response to changes in transmural pressure. The same mechanism underlies cerebral autoregulation - a fundamental neuroprotective mechanism Paulson et al. (1990). In further studies we shall thoroughly test the clinical significance of measures derived from instantaneous phase dynamics for assessment of autoregulation integrity. In addition, we shall establish the connection between the phase synchronization approach introduced in this paper and those based on moving cross-correlation indices Steinmeier et al. (1996); Czosnyka et al. (1997) or scaling properties of arterial and intracranial pressure time series Kolodziej et al. (2003); Latka et al. (2004).
We gratefully acknowledge the financial support of the U.S. Army Research Office (Grant DAAD19-03-1-0349). B. Goldstein acknowledges the partial support from the Thrasher Research Fund.
References
- Glass and Mackey (1988) L. Glass and M. C. Mackey, From Clocks to Chaos, The Rhythms of Life (Princeton University Pres, NJ, 1988).
- Aschoff et al. (1982) J. Aschoff, S. Daanand, and G. Groos, Vertebrate Circadian Systems. Structure and Physiology. (Springer, Berlin, 1982).
- Petrill and Glass (1984) G. Petrill and L. Glass, Am. J. Physiol. 246, 311 (1984).
- Bramble and Carrier (1983) D. Bramble and D. Carrier, Science 219, 251 (1983).
- Collins and Stewart (1993) J. Collins and I. Stewart, J. Nonlinear Sci. 3, 349 (1993).
- Sturis et al. (1995) J. Sturis, C. Knudsen, N. O’Meara, J. Thomsen, E. Mosekilde, E. V. Cauter, and K. Polonsky, Chaos 5, 193 (1995).
- Tass et al. (1998) P. Tass, M. Rosenblum, J. Weule, J. Kurths, A. Pikovsky, J. Volkmann, A. Schnitzler, and H.-J. Freund, Phys Rev Lett 81, 3291 (1998).
- Rosenblum et al. (1998) M. Rosenblum, J. Kurths, A. Pikovsky, C. Schafer, P. Tass, and H. H. Abel, IEEE Eng Med.Biol.Mag. 17, 46 (1998).
- Schafer et al. (1998) C. Schafer, M. Rosenblum, J. Kurths, and H. Abel, Nature 392, 239 (1998).
- Foucher et al. (2001) M. Q. J. Foucher, J. Lachaux, E. Rodriguez, A. Lutz, J. Martinerie, and F. Varela, J. Neuoscience Methods 111, 83 (2001).
- Paulson et al. (1990) O. B. Paulson, S. Strandgaard, and L. Edvinsson, Cerebrovasc. Brain Metab. Res. 2, 161 (1990).
- Aaslid et al. (1989) R. Aaslid, K. F. Lindegaard, W. Sorteberg, and H. Nornes, Stroke 20, 45 (1989).
- Diehl et al. (1995) R. R. Diehl, D. Linden, D. Lucke, and P. Berlit, Stroke 26, 1801 (1995).
- Tiecks et al. (1995) F. P. Tiecks, A. M. Lam, R. Aaslid, and D. W. Newell, Stroke 26, 1014 (1995).
- Panerai et al. (1999) R. B. Panerai, S. L. Dawson, and J. F. Potter, 277, H1089 (1999).
- Zhang et al. (1998) R. Zhang, J. H. Zuckerman, C. A. Giller, and B. D. Levine, Am J Physiol 274 (1998).
- Czosnyka et al. (2002) M. Czosnyka, P. Smielewski, S. Piechnik, and J. Pickard, Acta Neurochir Suppl 81, 117 (2002).
- Czosnyka et al. (2003) M. Czosnyka, P. Smielewski, Z. Czosnyka, S. Piechnik, L. Steiner, E. Schmidt, I. Gooskens, M. Soehle, E. Lang, B. Matta, et al., Acta Neurochir.Suppl 86, 581 (2003).
- Balestreri et al. (2004) M. Balestreri, M. Czosnyka, L. Steiner, E. Schmidt, P. Smielewski, B. Matta, and J. Pickard, Acta Neurochir (Wien ) 146, 131 (2004).
- Mallat (1998) S. Mallat, A Wavelet Tour of Signal Processing (Academic Press, San Diego, 1998).
- Lachaux et al. (1999) J. Lachaux, E. Rodriguez, J. Marinerie, and F. Varela, Hum.Brain Mapp. 8, 194 (1999).
- Hegger et al. (1999) R. Hegger, H. Kantz, and T. Schreiber, CHAOS 9, 413 (1999).
- Czosnyka (2000) M. Czosnyka, Br.J.Neurosurg. 14, 127 (2000).
- Steinmeier et al. (1996) R. Steinmeier, C. Bauhuf, U. Hubner, R. Bauer, R. Fahlbusch, R. Laumer, and I. Bondar, Stroke 27, 2236 (1996).
- Czosnyka et al. (1997) M. Czosnyka, P. Smielewski, P. Kirkpatrick, R. Laing, D. Menon, and J. Pickard, Neurosurgery 41, 11 (1997).
- Kolodziej et al. (2003) W. Kolodziej, M. Latka, D. Latka, M. Glaubic-Latka, B. Goldstein, and B. West, in 12th European Congress of Neurosurgery (Monduzzi Editore, 2003), pp. 581–586.
- Latka et al. (2004) M. Latka, B. Telenczuk, W. Kolodziej, D. Latka, B. Goldstein, and B. West, to be submitted to Phys. Rev. E (2004).
| N | 1 | 2 | ||||
|---|---|---|---|---|---|---|
| A | B | C | A | B | C | |
| 78.9 | 77.0 | 74.6 | 59.3 | 63.3 | 70.7 | |
| 13.9 | 13.0 | 13.0 | 16.4 | 19.8 | 9.2 | |
| 0.13 | 0.08 | 0.13 | 0.17 | 0.34 | 0.13 |