Unbound Protein-Protein Docking Selections by the DFIRE-based Statistical Pair Potential
Song Liu1, Chi Zhang1, and Yaoqi Zhou∗
Howard Hughes Medical Institute Center for Single Molecule Biophysics, Department of Physiology & Biophysics, State University of New York at Buffalo, 124 Sherman Hall, Buffalo, NY 14214
∗Corresponding Author: Dr. Yaoqi Zhou, Howard Hughes Medical Institute Center for Single Molecule Biophysics and Department of Physiology & Biophysics, State University of New York at Buffalo, 124 Sherman Hall, Buffalo, NY 14214, Phone: (716) 829-2985, Fax: (716) 829-2344, Email: yqzhou@buffalo.edu
1 These two authors contribute equally to this work
Abstract
A newly developed statistical pair potential based on Distance-scaled Finite Ideal-gas REference (DFIRE) state is applied to unbound protein-protein docking structure selections. The performance of the DFIRE energy function is compared to those of the well-established ZDOCK energy scores and RosettaDock energy function using the comprehensive decoy sets generated by ZDOCK and RosettaDock. Despite significant difference in the functional forms and complexities of the three energy scores, the differences in overall performance for docking structure selections are small between DFIRE and ZDOCK2.3 and between DFIRE and RosettaDock. This result is remarkable considering that a single-term DFIRE energy function was originally designed for monomer proteins while multiple-term energy functions of ZDOCK and RosettaDock were specifically optimized for docking. This provides hope that the accuracy of the existing energy functions for docking can be improved.
Keywords: potential of mean force, knowledge-based potential, energy score functions, reference state, binding affinity, and docking decoys.
INTRODUCTION
Docking prediction refers to the prediction of the structure of a protein-protein complex from the structures of individual subunits. This is a challenging task because an unbound subunit often changes its conformation upon binding with its partner (induced fit). Docking prediction involves decoy generation and the selection of the near-native structure from decoys using a filter and/or energy function. Thus, the success of docking prediction requires an efficient method that samples near-native conformations and an accurate energy function that ranks the near-native conformations as low energy conformations. Advances in sampling methods and energy functions for docking have been highlighted in several recent reviews [4, 47, 45, 21, 25, 24, 33, 2].
Various energy functions have been used in docking prediction to separate near-native structures from other structures. They are classified into two groups: “integrated” and “edge” functions based on whether or not they were used directly in sampling procedures or applied at the end of sampling procedures [21]. Energy functions are also classified based on the methods used to obtain them. Physical-based energy functions [3, 49, 26, 44], derived based on the laws of physics, have been applied to docking [e.g. DARWIN [46], DOT [13], Hex [41], Guided Docking [15], TSCF [27], SmoothDock [5]]. Some docking algorithms use semi-empirical energy functions that combine various physical terms such as surface complementarity, van der Waals interaction, generalized Born-surface area (GB/SA), and hydrogen bonding with optimized weight factors. Examples are Dock [50, 11, 28], ICM-DISCO [14], PPD [37, 38], GRAMM [48], FTDOCK [16], 3D-DOCK [23], AutoDock [35], Surfdock [12], GAPDOCK [17], MolFit [22, 1], BIGGER [39], Northwestern DOCK [30], ZDOCK [6] and RosettaDock [20]. Still others use statistical energy functions derived from known protein structures [53, 42, 34, 40, 18, 31, 36]. The use of energy functions is often accompanied with clusterization to incorporate entropic contribution as demonstrated in recent CAPRI (Critical Assessment of PRedicted Interaction) [19, 20, 8].
Recently, a residue-specific all-atom, distance-dependent potential of mean-force was extracted from the structures of single-chain proteins by using a physical state of uniformly distributed points in finite spheres [distance-scaled, finite, ideal-gas reference (DFIRE) state] as the zero-interaction reference state [55]. The new energy function is shown to be one of the best energy functions in selecting native structures from decoys [55], predicting mutation-induced change in stability [55] and loop conformations [55, 52], and reproducing the partitioning of hydrophobic and hydrophilic residues within a single protein [54]. More importantly, the physical reference state of ideal gases appears to make the DFIRE energy function physically more accurate because its performance is largely independent of the structural database ( or proteins) used for energy extraction [51]. Moreover, an initial application of the DFIRE-based “monomer” potential (i.e. the potential extracted from the structures of single-chain proteins) to protein-protein binding [29] suggests that the monomer potential is likely to be useful for docking prediction because it yields a high success rate for native structure selection in docking decoy sets, discriminates true dimer from crystal interfaces, and provides an accurate prediction of protein-protein binding free energies.
In this paper, we further assess the ability of the “monomer” DFIRE energy function to select near-native structures using a large benchmark of unbound docking decoy sets [7]. They are the RosettaDock unbound docking decoy set [20], ZDOCK1.3 [9], ZDOCK2.1 [9], and ZDOCK2.3 [6] docking decoy sets. Each docking set contains about 50 protein-protein complexes. We show that the unmodified version of the DFIRE energy function achieves a success rate in ranking near-native structures that is comparable to the success rates given by both ZDOCK and RosettaDock score functions. The implication of this result is discussed.
RESULTS
RosettaDock Unbound Docking Decoy Set
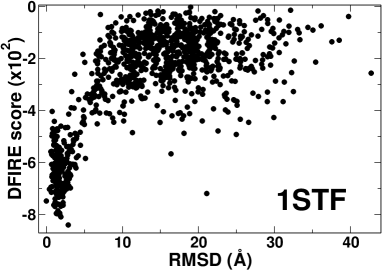
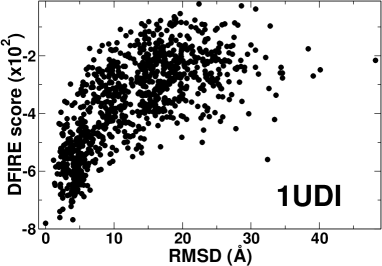
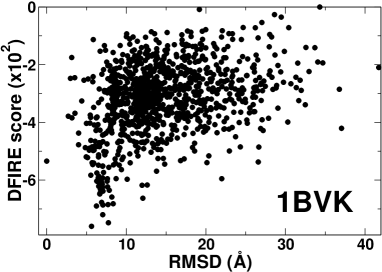
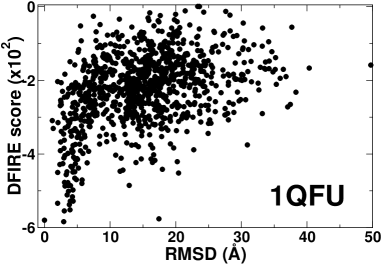
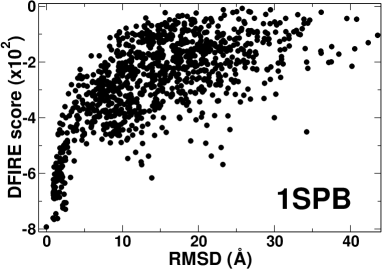
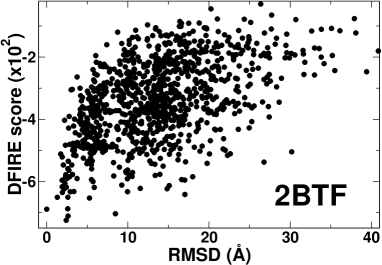
The DFIRE energy function is tested in the RosettaDock unbound docking decoy set. As in Ref. [20], the selection capability of a score function is characterized by the number of structures within the five lowest energy structures whose root mean squared deviation (rmsd) values are less than 10Å from the native complex structure () or whose fractions of native residue-residue contacts are greater than 25% (). Gray et al. further defined that a discrimination is successful (a docking funnel is detected) if (or ) is greater than or equal to 3. Table 1 compares the performance of the DFIRE energy function with that of RosettaDock on the docking decoys of 54 complexes. It shows that the success rate based on is 32/54 for DFIRE and 34/54 for RosettaDock, respectively. Similar success rates are obtained if the criterion is used. The overall performance of DFIRE continues to be comparable to RosettaDock when 38 complexes used by RosettaDock for parameter optimization are removed. Comparable performance between the two methods is also observed when dividing the complexes into enzyme/inhibitor, antibody/antigen, and other complexes. This suggests that the finding is robust. Figure 1 shows several examples in which the DFIRE energy function produces a “funnel”-like shape by plotting its energy score as a function of rmsd from native complex structures.
ZDOCK docking decoy sets
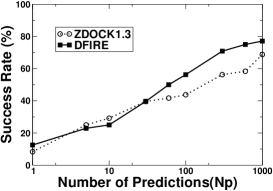
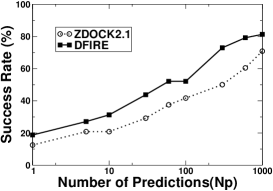
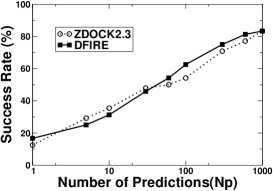
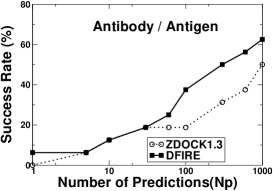
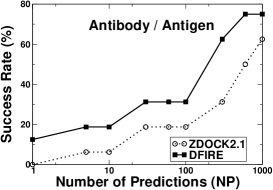
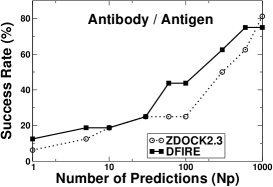
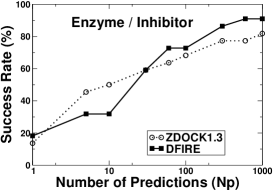
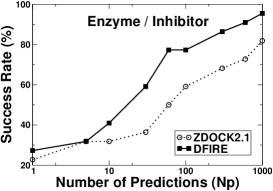
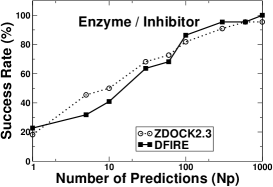
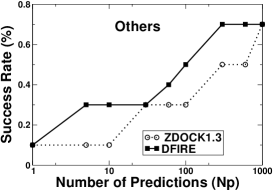
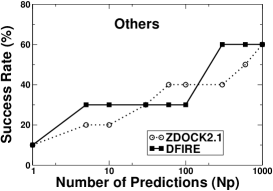
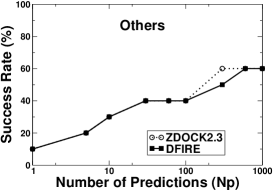
The DFIRE energy function is applied to docking decoy sets generated by different versions of ZDOCK. These unbound docking decoy sets contain 48 protein-protein complexes. In ZDOCK, the success rate is defined by number of first near-native structures detected within a given number of energy-ranked structures in the 48 complexes (see methods). Figure 2 compares the success rates as a function of number of energy-ranked structures (or number of predictions ) given by DFIRE, ZDOCK1.3, ZDOCK2.0, and ZDOCK2.3. The results are reported for 16 antibody/antigen complexes, 22 enzyme/inhibitor complexes, 10 other complexes and all 48 complexes. For antibody/antigen complexes, the DFIRE energy function gives a better success rate than all three versions of ZDOCK except that at certain intermediate number of predictions (around 10), the DFIRE energy function gives essentially the same success rate as ZDOCK 1.3 and ZDOCK 2.3. For enzyme/inhibitor complexes, the performance of the DFIRE energy function continues to be better than that of ZDOCK 2.1 but is only better than that of ZDOCK 1.3 or ZDOCK 2.3 at small and large . For other complexes, the success rates based on top 1 ranking or top 1000 ranking are essentially the same for all four score functions. At other values, the performance of DFIRE is essentially the same as that of ZDOCK 2.3, better than that of ZDOCK 1.3, and mixed as compared to ZDOCK 2.1. For all 48 complexes, the success rate of DFIRE is significantly higher (10% or more) than that of ZDOCK 2.1, higher than that of ZDOCK 1.3 for or and than that of ZDOCK 2.3 for or . The difference between the results of DFIRE and those of ZDOCK 2.3, however, is small.
Table 2 presents the best rank of near-native structures given by different methods. In all three decoy sets, DFIRE increases the ranks of near-native structures for more complexes than decreases them from the ranks given by different versions of ZDOCK. More specifically, the ranks given by DFIRE are higher for 23 protein complexes and lower for 12 protein complexes than those given by ZDOCK 1.3. The corresponding numbers are 27 higher and 9 lower, relative to ZDOCK 2.1 and 20 higher and 18 lower, relative to ZDOCK 2.3.
Another method to compare different energy score functions is to compare the number of near-native structures (or number of hits) that are included within a given number of lowest energy structures (number of predictions, ). Table 3 compares the number of near-native structures within the top-1000 decoys given by different methods in three decoy sets. The application of DFIRE energy function leads to more protein complexes having a greater number of near-native structures within the top 1000 decoys. For example, the numbers of near-native structures given by DFIRE are higher for 22 protein complexes and lower for 12 protein complexes than those given by ZDOCK 1.3. The corresponding numbers are 29 higher and 7 lower, relative to ZDOCK 2.1 and 20 higher and 18 lower, relative to ZDOCK 2.3. The average number of near-native structures per protein complex given by DFIRE is higher than ZDOCK 2.1 but is lower than ZDOCK 1.3 and 2.3. We found that this is mainly caused by relative higher penalty for hard core overlaps in the DFIRE energy function. If a softer DFIRE energy function (see methods) is used, the DFIRE energy function will have a higher average near-native structures per protein complexes than that given by three versions of ZDOCK. The softer DFIRE energy function also further increases the number protein complexes having a greater number of near-native structures within the top 1000 decoys than those given by either ZDOCK 1.3, 2.1 or 2.3. We also applied softer DFIRE energy function to RosettaDock decoy set, but did not find similar results. This result indicates that the ZDOCK decoy sets contain significant van der Waals overlaps whereas the RosettaDock decoy set has removed those overlaps via minimization.
DISCUSSION
In this paper, we have compared the performance of DFIRE, RosettaDock, and three versions of ZDOCK in selection of near-native structure from unbound-proteins docking decoy. The three energy functions were designed very differently. ZDOCK energy functions were optimally designed for docking. The shape complementarity was an important component in ZDOCK. The energy score in ZDOCK 1.3 has three terms: grid-based shape complementarity, desolvation, and electrostatics. The energy score in ZDOCK 2.1 uses a pairwise shape complementarity. In ZDOCK 2.3, the pairwise shape complementarity is further combined with desolvation and electrostatics. The RosettaDock energy function, on the other hand, attempts to include many physical interactions via physical, empirical, and/or knowledge-based approaches. The energy function contains 11 terms that include van der Waals (attractive and repulsive) interactions, implicit solvation, surface-area solvation, hydrogen bonding, rotamer probability, residue-residue pair probability, and electrostatic interactions (short and long-range attractive and repulsive components). In both ZDOCK and RosettaDock, weight parameters for different terms were optimized for best performance. In contrast, the DFIRE energy function only has one distance-dependent pair potential term that contains no adjustable parameters (except the energy value for van der Waals core overlaps). Despite significant difference in three energy functions, the performance of the DFIRE energy function is comparable to those of either RosettaDock or ZDOCK 2.3 based on the decoys generated by them. This is remarkable considering the fact that the DFIRE energy function was originally designed for monomer proteins. It remains to be seen if the performance of DFIRE can be further improved if the DFIRE energy function is used directly in sampling and minimization (work in progress).
The result that a single term of statistical pair potential has a performance similar to multiple-term energy functions provides new hope for going beyond the existing accuracy of energy functions for docking. This is because some physical interactions were not taken into account by the DFIRE energy function. One obvious example is the multibody hydrogen bonding interaction. Thus, it is possible that incorporating some terms used in the RosettaDock energy function or the ZDOCK energy function may further improve the accuracy of the DFIRE energy function. On the other hand, the matching performance among three very different energy functions may signal that a bottleneck in the accuracy of energy function has reached. One possible source of the error in all three energy functions is implicit solvation. If this is true, combining additional terms such as hydrogen bonding and/or surface-accessible solvation with DFIRE will unlikely make a significant improvement in the accuracy of docking prediction. Work is in progress to determine which scenario is true.
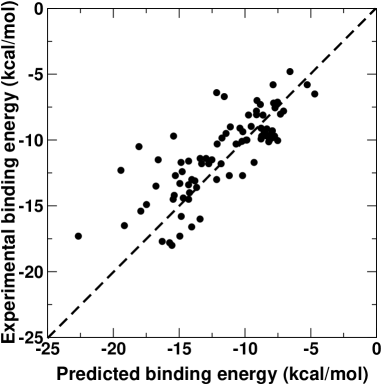
It should be noted that the DFIRE energy function is one of the best energy functions for predicting the protein-protein (peptide) binding free energy. Using a combined database of 28 binding free energies collected by Gray et al. (2003b) and 69 binding free energies [29], the correlation coefficient and the rmsd between measured binding free energies and that predicted by DFIRE is 0.79 and 2.35 kcal/mole, respectively (See Figure 3). This suggests that an accurate prediction of binding free energy does not guarantee an accurate docking prediction. This further suggests that the interaction energy missed in the DFIRE energy function only makes a small contribution to the binding free energy of the native complex structure but significantly destabilizes other alternative conformations. This highlights one of the biggest weaknesses of statistical potentials: they are trained by native structures only.
METHODS
DFIRE-based Potential and Soft DFIRE potential
The derivation of equations, the method for extracting the DFIRE-based potential using a structure database as well as the resulting potential have been described or obtained previously [55]. Here, we give a brief summary for completeness.
The atom-atom potential of mean force between atom types and that are distance apart is given by [55]
| (1) |
where , is the gas constant, K, , is the number of pairs within the distance shell observed in a given structure database, Å, and () is the bin width at (). (Å, for Å; Å for 2Å8Å; Å for 8Å15Å.) The prefactor was determined so that the regression slope between the predicted and experimentally measured changes of stability due to mutation (895 data points) is equal to 1.0. The exponent for the distance dependence was obtained from the distance dependence for the number of pairs of ideal gas points in finite spheres (finite ideal-gas reference state). Residue specific atomic types were used (167 atomic types) [43, 32]. The number of observed atomic pair within the distance shell [] was obtained from a structural database of 1011 non-homologous (less than 30% homology) proteins with resolution Å , which was collected by Hobohm et al. (1992)http://chaos.fccc.edu/research/labs/dunbrack/culledpdb.html ). This database provides sufficient statistics for most distance bins (except near the repulsive van der Waals regions). The average number of observed atomic pairs per bin is 655. The sufficiency of statistics is also reflected from the fact that the results for structural discrimination are insensitive to the size of structural database [55] or the type of structural database [51] used to generating the potential . The potential is set to 10 if . For a soft-DFIRE energy function, the value is set to 2.
Binding Free Energy and Structure Selections from Docking Decoys
The total atom-atom potential of mean force, , for each structure is given by
| (2) |
where the summation is over atomic pairs that are not in the same residue and a factor of 1/2 is used to avoid double counting of residue-residue and atom-atom interactions. The binding free energy of a dimer is obtained as follows:
| (3) |
Since the structures of monomers are approximated as rigid bodies and the residues at the interface contribute most to , Eq. (3) can be further simplified to
| (4) |
where the summation is over any two atoms belong to an “interacting” residue pair from different chains at the interface. We follow the definition, due to Lu et al. (2003), in which an interacting residue pair is a pair of residues from different chains that have at least one pair of heavy atoms within 4.5Å of each other. The binding free energy is calculated for each docking decoy and the ranking is based on the value of calculated binding free energy.
Unbound Docking Decoy Sets
The first decoy set (RosettaDock set) consists of 54 decoy sets [version 1.0 of Chen-Mintseris-Janin-Weng’s benchmark [7]] downloaded from the website http://gr aylab.jhu.edu/docking/decoys/. The decoy sets are generated by random starting position of unbound monomer components superimposed on the native bound complex structure, followed by RosettaDock protocol to create a diffuse space distribution that covers a reasonable area ( 20 Å radius rmsd) with moderate density around the native position. Each decoy set has 1000 decoys per protein complex [For more detailed description, see Gray et al. (2003a).]
The second decoy sets (ZDOCK decoy sets) consist of 48 protein-protein complexes [version 0.0 of the benchmark [7]] downloaded from the website http://zlab.bu. edu/rong/dock/software.shtml. The decoy sets are generated using fast Fourier transform (FFT) algorithm based on three different scoring function developed. They are ZDOCK1.3 that combines grid-based shape complementarity, GSC, with desolvation and electrostatics (GSC+DE+ELEC) [9], ZDOCK2.1 with pairwise shape complementarity (PSC) [10] and ZDOCK2.3, with combined PSC, desolvation and electrostatics (PSC+DE+ELEC) [6]. That is, we have three different sub-decoy sets and each sub-decoy set has 2000 decoys per protein complex.
Performance Evaluation
In RosettaDock unbound decoy set, the rmsd between decoy and native structure is calculated over the Cα atoms of the smaller docking partner (ligand) in the fixed coordinate frame of the larger partner (receptor). The native residue-residue contact fraction is calculated as the fraction of the contacts (residue pairs with at least one inter-residue heavy atom pairs 4Å ) identified in the native structure that are also present in the decoy structures. The performance of scoring function is evaluated by the number of energy funnels formed. The unbound perturbation funnels are quantified by examining the five lowest DFIRE energy decoys. If at least three of these structures either have less than 10 Å rmsd from the native structure or a native residue-residue contact fraction above 25%, a successful energy funnel exists for this target. [For more detailed description of the above criterion, see Gray et al. (2003a).]
In ZDOCK’s docking decoys, the rmsd between decoy and native structure is calculated over the Cα atoms of interface residues, which are residue pairs between receptor and ligand with at least one inter-residue heavy atom pairs 10Å . A hit (near-native structure) is defined as decoy with rmsd 2.5Å . The performance of a scoring function is evaluated by using success rate and hit count, as defined by Rong and Weng (2003). Success rate is defined as the percentage of test cases in the 48 targets sets for which at least one hit has been found within a given number of lowest-energy structures (predictions) for each test case (). Hit count is the average number of hits (near-native structures) per target within a given . Success rate only relies on the first best rank of hit in each protein-protein complex decoy set. Hit count characterizes the ability to retain near-native structures for post-processing within a given number of allowed candidates.
Acknowledgments
We gratefully thank Professors Jeffrey J. Gray and David Baker for providing us the RosettaDock docking decoy sets, Professor Ziping Weng, Dr. Rong Chen, and Ms. Li Li for ZDOCK decoys. We are also indebted to Professor Jeffrey J. Gray for many helpful discussion during this work. This work was supported by NIH (R01 GM 966049 and R01 GM 068530), a grant from HHMI to SUNY Buffalo and by the Center for Computational Research and the Keck Center for Computational Biology at SUNY Buffalo.
References
- [1] E. Ben-Zeev and M. Eisenstein. Weighted geometric docking: Incorporating external information in the rotation-translation scan. Proteins, 52:24–27, 2003.
- [2] Natasja Brooijmans and Irwin D. Kuntz. Molecular recognition and docking algorithms. Annu. Rev. Biophys. Struct., 32:335–373, 2003.
- [3] B. R. Brooks, R. E. Bruccoleri, B. D. Olafson, D. J. States, S. Swaminathan, and M. Karplus. CHARMM: A program for macromolecular energy, minimization, and dynamics calculations. J. Comput. Chem., 4:187–217, 1983.
- [4] C. J. Camacho and S. Vajda. Protein-protein association kinetics and protein docking. Curr. Opin. Stru. Biol., 12:36–40, 2002.
- [5] C.J. Camacho and S. Vajda. Protein docking along smooth association pathways. Proc. Natl. Acad. Sci. USA, 98:10636–10641, 2001.
- [6] R. Chen, L. Li, and Z. Weng. ZDOCK: an initial-stage protein-docking algorithm. Proteins, 52:80–87, 2003.
- [7] R. Chen, J. Mintseris, J. Janin, and Z. Weng. A protein-protein docking benchmark. Proteins, 52:88–91, 2003.
- [8] R. Chen, WW Tong, J. Mintseris, L. Li, and ZP Weng. Zdock predictions for the capri challenge. Proteins, 52:68–73, 2003.
- [9] R. Chen and Z. Weng. Docking unbound proteins using shape complementarity, desolvation, and electrostatics. Proteins, 47:281–294, 2002.
- [10] R. Chen and Z. Weng. A novel shape complementarity scoring function from protein-protein docking. Proteins, 51:397–408, 2003.
- [11] J. Cherfils, S. Duquerroy, and J. Janin. Protein-protein recognition analyzed by docking simulation. Proteins, 11:271–280, 1991.
- [12] B. Duncan and A. Olson. Applications of evolutionary programming for the prediction of protein-protein interactions. evolutionary programming v. Proceedings of the 5th annual conference on evolutionary programming. Boston, MA: MIT Press, 1996.
- [13] L.F. Ten Eyck, J. Mandell, V.A. Roberts, and M.E. Pique. Surveying molecular interactions with dot. Supercomputing ’95, IEEE Press, 1995.
- [14] J. Fernandez-Recio, M. Totrov, and R. Abagyan. Soft protein-protein docking in internal coordinates. Protein Science, 11:280–291, 2002.
- [15] P.W. Fitzjohn and P.A. Bates. Guided docking: first step to locate potential binding sites. Proteins, 52:28–32, 2003.
- [16] Henry A. Gabb, Richard M. Jackson, and Michael J. E. Sternberg. Modelling protein docking using shape complimentarity, electrostatics and biochemical information. J. Mol. Biol., 272:106–120, 1997.
- [17] E.J. Gardiner, P. Willett, and P.J. Artymiuk. Protein docking using a genetic algorithm. Proteins, 44:44–56, 1997.
- [18] F. Glaser, D. M. Sternberg, I. Vakser, and N. Ben-Tal. Residue frequencies and pairing preferences at protein-protein interfaces. Proteins, 43:89–102, 2001.
- [19] J. J. Gray, S. E. Moughan, T. Kortemme, O. Schueler-Furman, K. M. S. Misura, A. V. Morozov, and D. Baker. Protein-protein docking predictions for the capri experiment. Proteins, 52:118–122, 2003.
- [20] J.J. Gray, S.E. Moughan, C. Wang, O. Schueler-Furman, B. Kuhlman, C.A. Rohl, and D. Baker. Protein-protein docking with simultaneous optimization of rigid body displacement and side chain conformations. J. Mol. Biol., 331:281–299, 2003.
- [21] Inbal Halperin, Buyong Ma, Haim Wolfson, and Ruth Nussinov. Principles of docking: An overview of search algorithms and a guide to scoring functions. Proteins, 47:409–443, 2002.
- [22] A. Heifetz and M. Eisenstein. Effect of local shape modifications of molecular surfaces on rigid-body protein-protein docking. Protein Eng., 16:179–185, 2003.
- [23] R.M. Jackson, H.A. Gabb, and M.J. E. Sternberg. Rapid refinement of protein interfaces incorporating solvation: application to the docking problem. J. Mol. Biol., 276:265–285, 1998.
- [24] J. Janin, Kim Henrick, John Moult, Lynn Ten Eyck, Michael J. E. Sternberg, Sandor Vajda, Ilya Vakser, and Shoshana J. Wodak. CAPRI: A critical assessment of predicted interactions. Proteins, 52:2–9, 2003.
- [25] J. Janin and B. Seraphin. Genome-wide studies of protein-protein interaction. Curr. Opin. Stru. Biol., 13:383–388, 2003.
- [26] William L Jorgensen, David S. Maxwell, and Julian Tirado-Rives. Development and testing of the OPLS all-atom force field on conformational energetics and properties of organic liquids. J. Am. Chem. Soc., 118:11225–11236, 1996.
- [27] K. Komatsu, Y. Kurihara, M. Iwadate, M. Takeda-Shitaka, and H. Umeyama. Evaluation of the third solvent clusters fitting procedure for the prediction of protein-protein interactions based on the results at the capri blind docking study. Proteins, 52:15–18, 2003.
- [28] CH Li, XH Ma, WZ Chen, and CX Wang. A soft docking algorithm for predicting the structure of antibody-antigen complexes. Proteins, 52:47–50, 2003.
- [29] S. Liu, C. Zhang, H. Zhou, and Y. Zhou. A physical reference state unifies the structure-derived potential of mean force for protein folding and binding. Proteins, in press, 2004.
- [30] D.M. Lorber, M.K. Udo, and B.K. Shoichet. Protein-protein docking with multiple residue conformations and residue substitutions. Protein Science, 11:1393–1408, 2002.
- [31] H. Lu, Long Lu, and J. Skolnick. Development of unified statistical potentials describing protein-protein interactions. Biophys. J., 84:1895–1901, 2003.
- [32] H. Lu and J. Skolnick. A distance-dependent atomic knowledge-based potential for improved protein structure selection. Proteins, 44:223–232, 2001.
- [33] R. Mendez, R. Leplae, Leonardo De Maria, and Shoshana J. Wodak. Assessment of blind predictions of protein-protein interactions: Current status of docking methods. Proteins, 52:51–67, 2003.
- [34] G. Moont, H. Gabb, and M. Sternberg. Use of pair potentials across protein interfaces in screening predicted docked complexes. Proteins, 35:364–373, 1999.
- [35] G. M. Morris, D. S. Goodsell, R. S. Halliday, R. Huey, W. E. Hart, R. K. Belew, and A. J. Olson. Automated docking using a lamarckian genetic algorithm and and empirical binding free energy function. J. Comp. Chem., 19:1639–1662, 1998.
- [36] J. Murphy, D.W. Gatchell, J.C. Prasad, and S. Vajda. Combination of scoring functions improves discrimination in protein-protein docking. Proteins, 53:840–854, 2003.
- [37] R. Norel, D. Petrey, H. Wolfson, and R. Nussinov. Examination of shape complementarity in docking of unbound proteins. Proteins, 35:403–419, 1999.
- [38] R. Norel, F. Sheinerman, D. Petrey, and B. Honig. Electrostatics contributions to protein-protein interactions: Fast energetic filters for docking and their physical basis. Protein Science, 10:2147–2161, 2001.
- [39] P.N. Palma, L. Krippahl, J.E. Wampler, and J.J. Moura. Bigger: a new (soft) docking algorithm for predicting protein interactions. Proteins, 39:372–384, 2000.
- [40] H. Ponstingl, K. Henrick, and J.M. Thornton. Discriminating between homodimeric and monomeric proteins in the crystalline state. Proteins., 41:47–57, 2000.
- [41] D.W. Ritchie and G.J.L. Kemp. Protein docking using spherical polar fourier correlations. Proteins, 39:178–194, 2000.
- [42] C.H. Robert and J. Janin. A soft, mean field poteintial derived from crystal contacts for predicting protein-protein interactions. J. Mol. Biol., 283:1037–1047, 1998.
- [43] R. Samudrala and J. Moult. An all-atom distance-dependent conditional probability discriminatory function for protein structure prediction. J. Mol. Biol., 275:895–916, 1998.
- [44] W. R. P. Scott, P. H. Hünenberger, I. G. Tironi, A. E. Mark, S. R. Billeter, J. Fennen, A. E. Torda, T. Huber, P. Krüger, and W. F. van Gunsteren. The GROMOS biomolecular simulation program package. J. Phys. Chem. A, 103:3596–3607, 1999.
- [45] G. R. Smith and M. J. E. Sternberg. Prediction of protein-protein interactions by docking methods. Curr. Opin. Struct. Biol., 12:28–35, 2002.
- [46] J. S. Taylor and R. M. Burnett. DARWIN: A program for docking flexible molecules. Proteins, 41:173–191, 2000.
- [47] S. Vajda, I.A. Vakser, M.J.E. Sternberg, and J. Janin. Modeling of protein interactions in genomes. Proteins, 47:444–446, 2001.
- [48] I.A. Vakser. Evaluation of gramm low-resolution docking methodology on the hemagglutinin-antibody complex. Proteins, Suppl.1:226–230, 1997.
- [49] S. J. Weiner, P. Kollman, D. Nguyen, and D. Case. An all atom force field for simulations of proteins and nucleic acids. J. Comput. Chem., 7:230–252, 1986.
- [50] S.J. Wodak and J. Janin. Computer analysis of protein-protein interaction. J. Mol. Biol., 123:323–342, 1978.
- [51] C. Zhang, S. Liu, H. Zhou, and Y. Zhou. The dependence of all-atom statistical potentials on training structural database. Biophys. J., under revision, 2004.
- [52] C. Zhang, S. Liu, and Y. Zhou. Accurate and efficient loop selections using DFIRE-based all-atom statistical potential. Protein Sci., in press, 2004.
- [53] C. Zhang, G. Vasmatzis, J. Cornette, and C. DeLisi. Determination of atomic desolvation energies from the structures of crystallized proteins. J. Mol. Biol., 267:707–726, 1997.
- [54] H. Zhou and Y. Zhou. Quantifying the effect of burial of amino acid residues on protein stability. Proteins, 53:in press, 2003.
- [55] Hongyi Zhou and Yaoqi Zhou. Distance-scaled, finite ideal-gas reference state improves structure-derived potentials of mean force for structure selection and stability prediction. Protein Sci., 11:2714–2726, 2002.
| PDB ID | 1ACBb | 1AVWb | 1BRCb,c | 1BRSb,c | 1CGIb | 1CHOb | 1CSEb | 1DFJb |
|---|---|---|---|---|---|---|---|---|
| RosettaDockd | 2/1e | 5/5 | 1/2 | 4/4 | 4/4 | 3/3 | 2/0 | 4/4 |
| DFIREf | 4/4g | 5/5 | 2/2 | 5/5 | 3/3 | 5/5 | 1/2 | 3/3 |
| PDB ID | 1FSSb | 1MAHb,c | 1TGSb,c | 1UGHb | 2KAIb,c | 2PTCb | 2SICb | 2SNIb |
| RosettaDockd | 5/5 | 5/5 | 5/5 | 5/4 | 4/4 | 2/2 | 5/5 | 4/4 |
| DFIREf | 5/0 | 5/5 | 5/5 | 5/3 | 4/4 | 0/1 | 5/5 | 5/5 |
| PDB ID | 1PPEb,c | 1STFb,c | 1TABb,c | 1UDIb,c | 2TECb,c | 4HTCb,c | 1AHWh | 1BVKh |
| RosettaDockd | 5/5 | 5/5 | 5/5 | 5/5 | 5/5 | 5/5 | 5/5 | 5/0 |
| DFIREf | 5/5 | 5/5 | 3/3 | 5/5 | 4/5 | 5/5 | 2/2 | 5/1 |
| PDB ID | 1DQJh | 1MLCh | 1WEJh | 1BQLh | 1EO8h | 1FBIh | 1IAIh,c | 1JHLh |
| RosettaDockd | 2/2 | 0/0 | 0/2 | 5/5 | 1/4 | 3/3 | 0/1 | 1/0 |
| DFIREf | 1/1 | 0/0 | 3/1 | 1/1 | 0/0 | 2/3 | 2/2 | 1/1 |
| PDB ID | 1MELh,c | 1NCAh | 1NMBh,c | 1QFUh | 2JELh | 2VIRh,c | 1AVZi | 1MDAi |
| RosettaDockd | 5/5 | 5/5 | 5/5 | 5/5 | 5/4 | 4/1 | 0/0 | 3/0 |
| DFIREf | 3/4 | 3/3 | 0/0 | 4/4 | 5/5 | 3/3 | 1/0 | 2/1 |
| PDB ID | 1WQ1i | 2PCCi | 1A0Oi | 1ATNi | 1GLAi | 1IGCi | 1SPBi | 2BTFi |
| RosettaDockd | 3/4 | 3/1 | 1/4 | 5/5 | 1/1 | 2/2 | 5/5 | 4/4 |
| DFIREf | 4/4 | 1/3 | 3/1 | 5/5 | 0/0 | 0/0 | 5/5 | 5/4 |
| PDB ID | 1BTHj,c | 1FINj | 1FQ1j | 1GOTj | 1EFUj | 3HHRj | %Totalk | %Subsetl |
| RosettaDockd | 0/1 | 0/0 | 2/2 | 0/0 | 0/0 | 0/0 | 34/32 | 13/12 |
| DFIREf | 0/0 | 0/0 | 3/5 | 0/0 | 0/0 | 1/0 | 32/30 | 12/12 |
a Bolded targets are decoys from docking between unbound and bound structures [7]. Others are between unbound and unbound structures. b The enzyme/inhibitor complexes. c The complexes that were not used for optimizing the weighting scores in the RosettaDock energy function. d The High-resolution RosettaDock scoring function [19, 20]. e The first (second) number in the cell is the number of top 5 decoys with rmsd10Å (more than 25% of native residue-residue contact) given by the RosettaDock scoring function. f The DFIRE-based potential derived from a database of single-chain proteins [55]. g The first (second) number in the cell is the number of top 5 decoys with rmsd10Å (more than 25% of native residue-residue contact) given by DFIRE scoring function. h The antibody/antigen complex. i Other complexes. j Difficult targets. k The success rate based on the number of targets that have greater than or equal to three rmsd10Å (or more than 25% native contact decoys) ranked in top 5 as in Ref. [20]. l The success rates of the independent subset for the complexes that were not used in weight optimization.
| ZDOCK1.3 DECOYSb | ZDOCK2.1 DECOYSc | ZDOCK2.3 DECOYSd | ||||
| PDB ID | GDEe | DFIREf | PSCg | DFIREf | PDEh | DFIREf |
| 1MLC | 134 | 64 | 1396 | 141 | 128 | 146 |
| 1WEJ | 1940 | 159 | 1106 | 406 | 183 | 36 |
| 1AHW | 11 | 10 | 26 | 5 | 7 | 4 |
| 1DQJ | – | – | 1341 | 312 | – | – |
| 1BVK | – | – | 974 | 1386 | 821 | 1239 |
| 1FBIi | 561 | 812 | 1786 | 1619 | 642 | 1418 |
| 2JELi | – | – | 112 | 214 | 233 | 1030 |
| 1BQLi | 4 | 24 | 172 | 28 | 13 | 31 |
| 1JHLi | – | – | 404 | 116 | 333 | 51 |
| 1NCAi | 211 | 90 | 2 | 14 | 1 | 152 |
| 1NMBi | 1108 | 329 | 693 | 215 | 135 | 28 |
| 1MELi | 9 | 1 | 12 | 1 | 3 | 1 |
| 2VIRi | – | – | 476 | 125 | 1101 | 315 |
| 1EO8i | – | – | – | – | 1497 | 141 |
| 1QFUi | 606 | 48 | 407 | 1 | 388 | 1 |
| 1IAIi | 905 | 102 | – | – | 997 | 299 |
| 1CGI | 3 | 4 | 4 | 7 | 4 | 78 |
| 1CHO | 22 | 1 | 1 | 1 | 3 | 1 |
| 2PTC | 65 | 14 | 1655 | 715 | 193 | 15 |
| 1TGS | 5 | 1 | 3 | 4 | 3 | 9 |
| 2SNI | 169 | 331 | – | – | 1262 | 913 |
| 2SIC | 2 | 126 | 241 | 13 | 11 | 95 |
| 1CSE | 3 | 30 | 1537 | 37 | 198 | 9 |
| 2KAI | 1772 | 1044 | 1399 | 264 | 388 | 212 |
| 1BRC | 52 | 25 | 173 | 13 | 24 | 13 |
| 1ACB | 3 | 25 | 25 | 33 | 18 | 70 |
| 1BRS | 1019 | 244 | 61 | 44 | 65 | 131 |
| 1MAH | 9 | 12 | 849 | 39 | 24 | 41 |
| 1UGH | 14 | 30 | 305 | 316 | 8 | 22 |
| 1DFJ | 2 | 48 | 37 | 14 | 1 | 26 |
| 1FSS | 1066 | 113 | 731 | 259 | 50 | 97 |
| 1AVW | 704 | 37 | 45 | 16 | 3 | 16 |
| 1PPEi | 1 | 1 | 1 | 1 | 1 | 1 |
| 1TABi | – | – | 65 | 6 | 79 | 5 |
| 1UDIi | 198 | 33 | 31 | 1 | 5 | 1 |
| 1STFi | 1 | 1 | 1 | 1 | 1 | 1 |
| 2TECi | 1 | 2 | 1 | 1 | 1 | 1 |
| 4HTCi | 2 | 2 | 1 | 1 | 3 | 3 |
| 2PCC | 702 | 234 | – | – | – | – |
| 1WQ1 | 131 | 82 | 5 | 3 | 15 | 5 |
| 1AVZ | – | – | – | – | – | – |
| 1MDA | – | – | – | – | – | – |
| 1IGCi | – | – | 22 | 239 | 153 | 452 |
| 1ATNi | 13 | 2 | 360 | 127 | 7 | 7 |
| 1GLAi | 214 | 53 | – | – | – | – |
| 1SPBi | 1 | 2 | 1 | 5 | 1 | 13 |
| 2BTFi | 27 | 1 | 32 | 1 | 2 | 1 |
| 1A0Oi | 619 | 108 | 833 | 139 | 284 | 218 |
| Ratioj | – | 12/23 | – | 9/27 | – | 18/20 |
| Top 1k | 4 | 6 | 6 | 9 | 6 | 7 |
a The 1JTG decoy set is not available (See http://zlab.bu.edu/rong/dock/software.shtml). Hits are defined as docked structures with interface rmsd2.5Å from the crystal complexes. There are 2000 decoys for each target. bDecoys generated by ZDOCK1.3 [9]. cDecoys generated by ZDOCK2.1 [10]. dDecoys generated by ZDOCK2.3 [6]. eZDOCK1.3(GDE) [9]. fThe DFIRE-based potential [55]. gZDOCK2.1(PSC) [10]. hZDOCK2.3(PDE) [6]. i Decoys from docking between unbound and bound structures. j The first (second) number is the number of targets whose ranks given by DFIRE are lower (higher) than that given by the ZDOCK scoring function. kThe number of targets whose near-native structures are scored as top 1.
| ZDOCK1.3(GDE) DECOYSb | ZDOCK2.1(PSC) DECOYSc | ZDOCK2.3(PDE) DECOYSd | |||||||
| PDB ID | GDEe | DFIREf | SoftDFIREg | PSCh | DFIREf | SoftDFIREg | PDEi | DFIREf | SoftDFIREg |
| 1MLC | 11 | 11 | 14 | 0 | 3 | 3 | 11 | 8 | 9 |
| 1WEJ | 0 | 1 | 0 | 0 | 3 | 4 | 11 | 19 | 21 |
| 1AHW | 44 | 63 | 57 | 18 | 21 | 26 | 50 | 56 | 59 |
| 1DQJ | – | – | – | 0 | 1 | 0 | – | – | – |
| 1BVK | – | – | – | 1 | 0 | 0 | 1 | 0 | 1 |
| 1FBIj | 1 | 2 | 2 | 0 | 0 | 1 | 1 | 0 | 3 |
| 2JELj | – | – | – | 33 | 21 | 43 | 17 | 0 | 19 |
| 1BQLj | 73 | 68 | 85 | 6 | 12 | 11 | 46 | 30 | 51 |
| 1JHLj | – | – | – | 7 | 10 | 6 | 5 | 9 | 7 |
| 1NCAj | 6 | 9 | 7 | 43 | 34 | 41 | 55 | 25 | 47 |
| 1NMBj | 0 | 3 | 2 | 3 | 5 | 0 | 7 | 7 | 2 |
| 1MELj | 19 | 30 | 32 | 36 | 47 | 52 | 52 | 58 | 71 |
| 2VIRj | – | – | – | 1 | 3 | 0 | 0 | 3 | 0 |
| 1EO8j | – | – | – | – | – | – | 0 | 2 | 1 |
| 1QFUj | 4 | 4 | 4 | 2 | 10 | 10 | 10 | 18 | 18 |
| 1IAIj | 1 | 3 | 3 | – | – | – | 1 | 3 | 2 |
| 1CGI | 43 | 52 | 70 | 29 | 37 | 42 | 50 | 42 | 53 |
| 1CHO | 53 | 85 | 76 | 54 | 65 | 65 | 68 | 85 | 79 |
| 2PTC | 38 | 43 | 61 | 0 | 2 | 1 | 28 | 25 | 33 |
| 1TGS | 60 | 72 | 86 | 87 | 85 | 106 | 79 | 82 | 105 |
| 2SNI | 34 | 19 | 46 | – | – | – | 0 | 1 | 0 |
| 2SIC | 96 | 53 | 105 | 10 | 20 | 16 | 38 | 28 | 30 |
| 1CSE | 61 | 30 | 48 | 0 | 3 | 0 | 15 | 22 | 8 |
| 2KAI | 0 | 0 | 1 | 0 | 2 | 2 | 3 | 13 | 14 |
| 1BRC | 9 | 17 | 20 | 13 | 16 | 16 | 35 | 47 | 49 |
| 1ACB | 154 | 120 | 136 | 21 | 25 | 32 | 54 | 51 | 54 |
| 1BRS | 0 | 1 | 3 | 20 | 25 | 32 | 14 | 14 | 16 |
| 1MAH | 45 | 40 | 51 | 3 | 6 | 6 | 22 | 24 | 26 |
| 1UGH | 36 | 43 | 53 | 2 | 3 | 4 | 14 | 14 | 20 |
| 1DFJ | 36 | 9 | 43 | 13 | 10 | 15 | 44 | 14 | 45 |
| 1FSS | 0 | 2 | 2 | 1 | 4 | 4 | 11 | 10 | 13 |
| 1AVW | 2 | 2 | 2 | 18 | 21 | 27 | 39 | 34 | 49 |
| 1PPEj | 257 | 143 | 230 | 215 | 198 | 218 | 325 | 233 | 296 |
| 1TABj | – | – | – | 31 | 40 | 29 | 28 | 39 | 31 |
| 1UDIj | 28 | 29 | 32 | 13 | 13 | 16 | 26 | 30 | 35 |
| 1STFj | 140 | 120 | 143 | 37 | 39 | 42 | 67 | 67 | 77 |
| 2TECj | 191 | 138 | 168 | 64 | 69 | 57 | 151 | 127 | 109 |
| 4HTCj | 53 | 54 | 65 | 40 | 47 | 52 | 36 | 44 | 52 |
| 2PCC | 2 | 5 | 5 | – | – | – | – | – | – |
| 1WQ1 | 5 | 8 | 10 | 21 | 17 | 22 | 40 | 29 | 46 |
| 1AVZ | – | – | – | – | – | – | – | – | – |
| 1MDA | – | – | – | – | – | – | – | – | – |
| 1IGCj | – | – | – | 4 | 4 | 1 | 2 | 2 | 1 |
| 1ATNj | 30 | 44 | 40 | 1 | 1 | 0 | 16 | 23 | 2 |
| 1GLAj | 8 | 19 | 19 | – | – | – | – | – | – |
| 1SPBj | 85 | 84 | 102 | 59 | 59 | 73 | 98 | 71 | 105 |
| 2BTFj | 15 | 14 | 14 | 11 | 13 | 13 | 28 | 33 | 30 |
| 1A0Oj | 4 | 9 | 6 | 1 | 2 | 2 | 4 | 3 | 2 |
| Ratiok | – | 12/22 | 5/30 | – | 7/29 | 9/30 | – | 18/20 | 10/29 |
| Averagel | 34.25 | 30.19 | 38.40 | 19.13 | 20.73 | 22.71 | 33.38 | 30.10 | 35.23 |
a The 1JTG decoy set is not available (See http://zlab.bu.edu/rong/dock/software.shtml). Hits are defined as docked structures with interface rmsd2.5Å from the crystal complex. There are 2000 decoys for each target. bDecoys generated by ZDOCK1.3 [9]. cDecoys generated by ZDOCK2.1 [10]. dDecoys generated by ZDOCK2.3 [6]. eZDOCK1.3(GDE) [9]. fThe DFIRE-based potential [55]. gThe Soft-DFIRE potential. hZDOCK2.1(PSC) [10]. iZDOCK2.3(PDE) [6]. jDecoys from docking between unbound and bound structures. kThe first (second) number are the number of targets whose number of hits given by DFIRE/SOFT-DFIRE are lower (higher) than that given by the ZDOCK scoring function. l The average number of hits over 48 targets.