Untangling influences of hydrophobicity on protein sequences and structures
Abstract
We fit the Fourier transforms of solvent accessibility and hydrophobicity profiles of a representative set of proteins to a joint multi-variable Gaussian. This allows us to separate the intrinsic tendencies of sequence and structure profiles from the interactions that correlate them; for example, the -helix periodicity in sequence hydrophobicity is dictated by the solvent accessibility of structures. The distinct intrinsic tendencies of sequence and structure profiles are most pronounced at long periods, where sequence hydrophobicity fluctuates more, while solvent accessibility fluctuations are less than average. Interestingly, correlations between the two profiles can be interpreted as the Boltzmann weight of the solvation energy at room temperature.
How the sequence of amino acids determines the structure and function of the folded protein remains a challenging problem. It is known that hydrophobicity is an important determinant of the folded state; hydrophobic monomers tend to be in the core, and polar monomers on the surface Kauzmann (1959); Lee and Richards (1971); Eisenberg et al. (1984); Moelbert et al. (2004). Several studies have examined the correlations in the hydrophobicity of amino-acids along the protein chain Irback et al. (1996); Pande et al. (1994); Strait and Dewey (1995); Weiss and Herzel (1998), which are in secondary structure prediction Eisenhaber et al. (1996), and in the design of good folding sequences Wilder and Shakhnovich (2000). Naturally, sequence correlations arise from locations of the amino-acids in the folded protein structure, and are best interpreted in conjunction with solvent accessibility profiles (which indicate how exposed a particular amino-acid is to water in a specific structure). For example, Eisenberg et al Eisenberg et al. (1984) note that for secondary structures lying on the protein surface, which have a strong periodicity in their solvent accessibility, hydrophobicity profiles also exhibit the period of the corresponding helix or strand. Constraints from forming compact structures induce strong correlations in the solvent accessibility profile Govorun et al. (2001); Strait and Dewey (1995); Yahyanejad et al. (2003); Khokhlov and Khalatur (1999), which should in turn induce similar correlations in the hydrophobicity profiles. It is desirable to quantify and separate the resulting correlations in protein sequences and structures.
In this paper, we aim for a unified treatment of hydrophobicity and solvent accessibility profiles, and the interactions between them. The sequence of each protein is represented by a profile , where is a standard measure of the hydrophobicity of the -th amino-acid along the backbone Biswas et al. (2003). Its structure has a profile for , where is a measure of the exposure of the amino-acid to water in the folded structure Lee and Richards (1971). While we do not expect perfect correlations between these profiles, we can inquire about the statistical nature of these correlations, and in particular whether they are diminished or enhanced at different periods. To this end, we employ the method of Fourier transforms , and examine the statistics of the resulting amplitudes , and power spectra , for a database of 1461 non-homologous proteins. In a sense, this can be regarded as extending the work of Eisenberg et al Eisenberg et al. (1984) who explore correlations between hydrophobicity and solvent independent of specific locations along the backbone. Of course, the use of Fourier analysis is by no means new, and has for example been employed to study hydrophobicity profiles Eisenberg et al. (1984); Rackovsky (1998); Irback et al. (1996); Irback and Sandelin (2000). However, we are not aware of its use as a means of correlating sequence and structure profiles.
Our results suggest that the hydrophobicity and solvent accessibility profiles are well approximated by a joint Gaussian probability distribution. This allows us to obtain the intrinsic correlations in the hydrophobicity profile, as distinct from correlations induced by solvent accessibility. For example, the -helix periodicity in hydrophobicity profiles is shown to be induced by the corresponding periodicity in the solvent accessibility profiles. We also find that at long wavelengths the two profiles have different intrinsic characteristics: solvent accessibility profiles are positively correlated while hydrophobicity profiles are anti-correlated. Interestingly, the coupling between the two profiles is independent of wave-number, and hence can be interpreted as the Boltzmann weight of the solvation energy. The corresponding temperature is close to room temperature, consistent with the “mean” temperature estimated in previous work from the frequencies of occurrence of amino acid residues in the core and on the surface Miller et al. (1987); Finkelstein et al. (1995).
For our protein data set, we selected 2200 representative chains from the Dali/FSSP database. Any two protein chains in this set have more than 25 percent structural dissimilarity. We removed all the multi-domain chains by using the CATH domain definition database, leaving 1461 protein chains Holm and Sander (1998); Orengo et al. (1997); Moelbert et al. (2004). The hydrophobicity profiles, , were generated from the sequence of amino-acids using the experimentally measured scale of Fachere and Pliska Fauchere and Pliska (1983) (in units of kcal/mol). We used the relative solvent accessibility reported by NACCESS Hubbard et al. (1991) to generate solvent accessibility profiles . (The relative solvent accessibility is the ratio of the solvent accessibility of a residue to the solvent accessibility of that residue in an extended tripeptide ALA-X-ALA for each amino acid type X.) We then computed the corresponding Fourier components as
| (1) |
where , with , and similarly for . (The average values were subtracted to remove the DC component in the Fourier transform.)
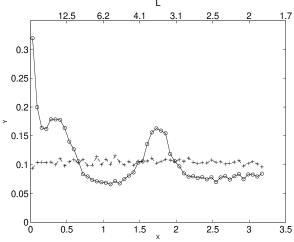
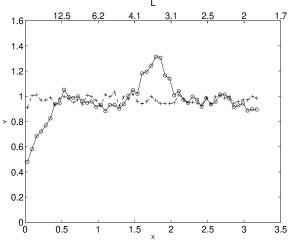
Our results for the power spectra of solvent accessibility and hydrophobicity profiles are indicated respectively in Figs. 1 and 1 ( is related to the periodicity through ). A prominent feature of both plots is the peak at the -helix periodicity Eisenberg et al. (1984). Its presence in the solvent accessibility spectrum indicates that solvation energy plays a role in the spatial arrangement of helices when they lie on the surface, the hydrophobic monomers are more likely to be exposed to the solvent. Eisenberg et al. (1984).
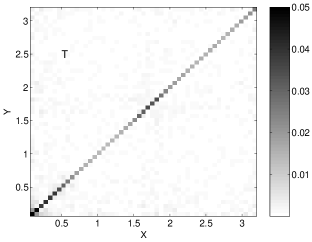
We would like to untangle correlations between the two profiles, so as to determine their intrinsic tendencies, by finding a joint probability distribution . Clearly this cannot be decomposed as a product of contributions from different sites , as neighboring components such as and , are highly correlated. We anticipate that the Fourier components for different are independently distributed (i.e. ) for the following reasons: (i) For the subgroup of cyclic proteins Weikl and Dill (2003) the index is arbitrary, and the counting can start from any site. The invariance under relabeling then implies that the probability can only depend on , and hence separable into independent Fourier components. This exact result does not hold for open proteins because of end effects, but should be approximately valid for long sequences when such effects are small. (ii) Numerical analysis of a lattice model of proteins in Ref. Yahyanejad et al. (2003) confirms the exact decomposition into Fourier modes for cyclic structures, and its robustness even for open structures of only monomers. To test this hypothesis, we examine all possible covariances involving for different . Note that the Fourier amplitudes are complex (i.e. , and similarly for ), and hence there are covariance plots, such as in Fig. 2) for the covariance of with itself. In all cases we find that the diagonal terms are small; the only exceptions are at small where we expect end effects to be most pronounced.
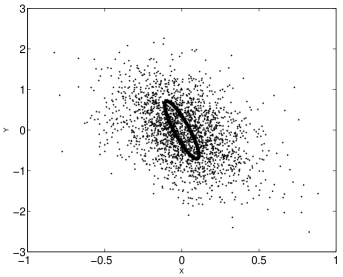
One can make a similar case for the independence of the real and imaginary components at a given . (For cyclic structures the phase is arbitrary.) The real (imaginary) components are, however, correlated as illustrated by the scatter plot of for in Fig. 2. We made similar scatter plots for different values of in the interval to , with similar results which were well fitted to Gaussian forms. Based on these results, we describe the joint probability distribution in Fourier space by the multivariate Gaussian form
| (2) | |||||
with the parameters plotted in Fig. 3. If the probabilities depend only on the separation between sites, the real and imaginary Fourier amplitudes should follow the same distribution. In our fits we allowed the corresponding parameters to be different to obtain a measure of the accuracy of the model and the fitting procedure. As indicated in Fig. 3 the resulting values are quite close, differing by less than 5%.
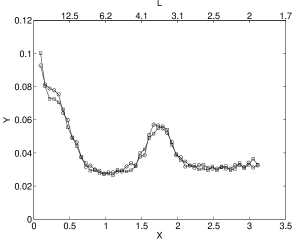
We interpret and as measures of intrinsic tendencies of hydrophobicity and surface exposure profiles, while indicates the strength of the interactions that correlate them. In the absence of any such interactions, and would be the same as the power spectra in Fig. 1. With this in mind, let us now examine these plots in more detail.
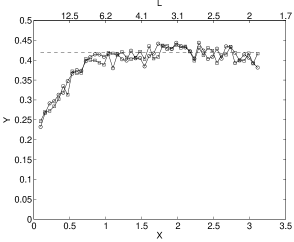
The prevalence of -helices in structures is reflected in the peak at in Fig. 3. As a check, we repeated the analysis for 493 proteins in our database that are classified as mainly by CATH Orengo et al. (1997). The -helix peak disappears completely for this subset, and a weaker peak corresponding to strands at (which was not visible in Fig. 3) emerges in its places. This may indicate that the formation and arrangement of strands is less influenced by hydrophobic forces. The other prominent feature of Fig. 3 is the increase in as . We believe this reflects the fact that at a coarse level the protein is a compact polymer; it is well known that polymer statistics leads to long-range correlations in the statistics of segments in the interior of a compact structure Govorun et al. (2001). While the precise manner in which this could lead to correlations as in Fig. 3 has not been worked out, we note that similar effects have been observed before in studies of protein-like structures in three dimensions Khokhlov and Khalatur (1999), and compact lattice polymers in two dimensions Yahyanejad et al. (2003).
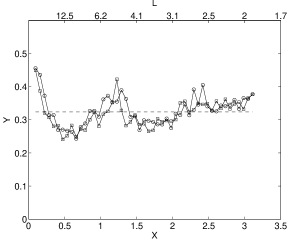
The -helix peak, which is prominent in the hydrophobicity power spectrum of Fig. 1 is absent from Fig. 3. Thus, the observed periodicity in sequence data is not an intrinsic feature of the amino-acid profiles, but dictated by the required folding of structures. If the sequence of amino-acids were totally random, we would expect a distribution , where indicates the frequency of a particular base. The corresponding distribution in Fourier space would also be independent of . The observed are indeed constant (approximately ), at large . This constant is different from the average indicated in Fig. 1, with the assumption that the amino-acids are distributed randomly. This difference is due to the interaction term in equation 2.
Reduced values of are observed as , corresponding to large periodicities, as seen in Fig. 3. A similar feature is also present in the power spectrum in Fig. 1, as noted before by Irback et al. Irback et al. (1997) who suggest that anti-correlations can be advantageous for removing the degeneracies of ground state for folding sequences. More recent studies also indicate that long stretches of hydrophobic monomers, which could be a source of long range positive correlations, are avoided Schwartz et al. (2001). Further investigations of this issue would be helpful.
Finally, we note that the interaction terms in Fig. 3 which correlate sequence and structure profiles (at different periodicities) are approximately constant. As , these terms can be regarded as arising from the Boltzmann weight of a solvation energy at some temperature . Using kcal/mol, we can extract a corresponding temperature of . Interestingly, this fictitious is around room temperature, i.e. in the range of temperatures that most proteins fold and function. This indicates that an important factor in correlating sequence hydrophobicity, and structural solvent accessibility is indeed the free energy of solvation. This conclusion is also consistent with the analysis done by Miller Miller et al. (1987); Finkelstein et al. (1995), which estimated differences in the free energies of amino-acids between the surface and the core of the proteins by counting their relative frequencies in the different locations.
In principle, the Gaussian distribution in Eq. 2 can be used as a tool for predicting structures, at least as far as their surface exposure profile is concerned. Given a specific sequence, we can calculate the hydrophobicity profile , and the corresponding . The conditional probability for surface exposure profiles is then given by
| (3) |
Thus is Gaussian distributed with a mean value of , and a variance , with the ‘susceptibility’ , and the ‘noise’ easily related to . The corresponding distribution of in real space is then obtained by Fourier transformation.
We investigated correlations between protein sequences and structures due to hydrophobic forces, by application of Fourier transforms to profiles of hydrophobicity and solvent accessibility. Each Fourier component is separately well approximated by a Gaussian distribution; their joint distribution is described by a product of multivariate Gaussians at different periodicities. This approach enables us to separate the intrinsic tendencies of the profiles from the interactions that couple them. We thus find that -helix periodicity is a feature of structures and not sequences, and that at long periods the structural profiles are more correlated than average, while the sequences are less correlated. A quite satisfying outcome is that the correlations between the two profiles can be explained by the Boltzmann weight of the solvation energy at room temperatures.
Our joint distribution can be used in applications such as predicting solvent accessibility from hydrophobicity profiles Naderi-manesh et al. (2001), or protein interaction sites Gallet et al. (2000). Incorporating the impact of correlations within solvent accessibilities is likely to improve predictions. The distribution can also be used in analytical approaches to protein folding, wherever there is a need for taking into account the complexities of structure and sequence space.
MY and CBB are supported by Functional Genomics Innovation Award (CBB and Philip A. Sharp). MK is supported by NSF through grant No. DMR-01-18213. MY thanks M. Povinelli for helpful discussions.
References
- Kauzmann (1959) W. Kauzmann, Advan. Protein Chem. 16, 1 (1959).
- Lee and Richards (1971) B. K. Lee and F. M. Richards, J. Mol. Biol 55, 379 (1971).
- Eisenberg et al. (1984) D. Eisenberg, R. M. Weiss, and T. C. Terwilliger, Proc. Nat. Acad. Sci. US 81, 140 (1984).
- Moelbert et al. (2004) S. Moelbert, E. Emberly, and C. Tang, Protein Sci. 13, 752 (2004).
- Irback et al. (1996) A. Irback, C. Peterson, and F. Potthast, Proc. Nat. Acad. Sci. USA 93, 9533 (1996).
- Pande et al. (1994) V. S. Pande, A. Y. Grosberg, and T. Tanaka, Proc. Nat. Acad. Sci. USA 91, 12972 (1994).
- Strait and Dewey (1995) B. J. Strait and T. G. Dewey, PRE 52, 6588 (1995).
- Weiss and Herzel (1998) O. Weiss and H. Herzel, Journal of Theoretical Biology 190, 341 (1998).
- Eisenhaber et al. (1996) F. Eisenhaber, F. Imperiale, P. Argos, and C. Frommel, Protein-Struct. Funct. Genet. 25, 157 (1996).
- Wilder and Shakhnovich (2000) J. Wilder and E. I. Shakhnovich, Phys. Rev. E 62, 7100 (2000).
- Govorun et al. (2001) E. N. Govorun, V. A. Ivanov, A. R. Khokhlov, P. G. Khalatur, A. L. Borovinsky, and A. Y. Grosberg, Phys. Rev. E 64, R40903 (2001).
- Yahyanejad et al. (2003) M. Yahyanejad, M. Kardar, and C. Tang, J. Chem. Phys. 118, 4277 (2003).
- Khokhlov and Khalatur (1999) A. R. Khokhlov and P. G. Khalatur, Phys. Rev. Lett. 82, 3456 (1999).
- Biswas et al. (2003) K. M. Biswas, D. R. Devido, and J. G. Dorsey, J. Chromatogr. A 1000, 637 (2003).
- Rackovsky (1998) S. Rackovsky, Proc. Nat. Acad. Sci. USA 95, 8580 (1998).
- Irback and Sandelin (2000) A. Irback and E. Sandelin, Biophysical Journal 79, 2252 (2000).
- Miller et al. (1987) S. Miller, J. Janin, A. M. Lesk, and C. Chothia, J. Mol. Biol. 196, 641 (1987).
- Finkelstein et al. (1995) A. V. Finkelstein, A. Y. Badretdinov, and A. M. Gutin, Protein-Struct. Funct. Genet. 23, 142 (1995).
- Holm and Sander (1998) L. Holm and C. Sander, Nucl. Acid Res. 26, 316 (1998).
- Orengo et al. (1997) C. A. Orengo, A. D. Michie, S. Jones, D. T. Jones, M. B. Swindells, and J. M. Thornton, Structure 5, 1093 (1997).
- Fauchere and Pliska (1983) J. Fauchere and V. Pliska, Eur. J. Med. Chem. 18, 369 (1983).
- Hubbard et al. (1991) S. J. Hubbard, S. F. Campbell, and J. M. Thornton, J. Mol. Biol. 220, 507 (1991).
- Weikl and Dill (2003) T. R. Weikl and K. A. Dill, J. Mol. Biol. 332, 953 (2003).
- Irback et al. (1997) A. Irback, C. Peterson, and F. Potthast, Phys. Rev. E. 55, 860 (1997).
- Schwartz et al. (2001) R. Schwartz, S. Istrail, and J. King, Protein Sci. 10, 1023 (2001).
- Naderi-manesh et al. (2001) H. Naderi-manesh, M. Sadeghi, S. Arab, and A. A. Movahedi, Protein-Struct. Funct. Genet. 42, 452 (2001).
- Gallet et al. (2000) X. Gallet, B. Charloteaux, A. Thomas, and R. Brasseur, J. Mol. Biol. 302, 917 (2000).