Evolution at the Edge of Chaos: A Paradigm for the Maturation of the Humoral Immune Response
*
Abstract
We study the maturation of the antibody population following primary antigen presentation as a global optimization problem. Emphasis is placed on the trade-off between the safety of mutations that lead to local improvements to the antibody’s affinity and the necessity of eventual mutations that result in global reconfigurations in the antibody’s shape. The model described herein gives evidence of the underlying optimization process from which the rapidity and consistency of the biologic response could be derived.
1 Introduction
The study of the mechanisms underlying the physiology of the immune system has been a very promising area for applications of mathematical models. The spectacular success of the healthy immune system to recognize the combinatorial plethora of antigenic agents while being endowed with a substantially smaller repertoire of immunoglobulin (Ig) molecules is a problem that shares much in common with mathematical problems of combinatorial complexity and optimization.
This article focuses on the maturation of the humoral immune response as a conveniently fast-paced example of selection-based evolution. Through this example, we attempt to investigate the interplay between lessons learned from mathematical models of global optimization and the need for theoretical models in the biological sciences.
The paper begins by providing a brief overview of the B cell immune response. The following sections provide the biological context for the presentation of our model and results, and a summary of the techniques involved in our analysis. The presentation of our model and results proceeds in five steps of increasing complexity which assume a familiarity with the corresponding sections in the biological discussion of the model.
2 The Naive B Cell Repertoire
The ability of the specific immune response to recognize and respond to myriad foreign antigen challenges rests in the generation of diversity at different stages in the development of the immune cells. With regards to the B cell, diversity is first explored at the time of antibody naive maturation with somatic recombination from a pool of genes that construct the variable and constant domains of the heavy and light chains of the antibody molecule, along with their inherent combinatorial freedom. At this stage, there is additional diversity introduced via imprecise rearrangements and junctional nucleotide insertions. It is now believed that conformational isomerism of Ig molecules may also add additional diversity to the primary repertoire [16]. Conservatively, these processes have been calculated to generate a repertoire on the order of [14].
3 B Cell Response
The introduction of foreign antigen into the host results in a complex response that occurs rapidly and effectively. The initial phase following antigen introduction involves elimination via innate immunity. The mediators of this response are nonspecific, including the phagocytic cells, complement, and NK cells. Subsequently, the mediators of specificity in the immune response, represented by the T cells and B cells, are activated following interactions with macrophages, and other soluble factors. The evolution of specificity into the immune repertoire greatly enhanced the organism’s ability to respond to foreign invaders, and even more importantly, to develop memory of this invader that is protective upon reintroduction of the pathogen.
Antigen localization following exposure occurs within two compartments in the lymph node. The first is the primary follicles, which are comprised of antigen–antibody complexes and follicular dendritic cells that present antigen to a circulating population of B cells. The second compartment is the paracortex. Within minutes of introduction, the antigen is taken up by the phagocytic cells present in the paracortex. These cells will process the antigen for presentation via MHC to specific CD4+ T cells. The interaction of the T cells, antigen-presenting cells (APCs), and B cells will give rise to a population of low affinity B cells that can generate large amounts of antibody for a fixed period of time, called the plasmacytes of the primary response, and another population that will give rise to the secondary follicles and germinal centers (GC) where hypermutation will take place [14, 2]. Usually only 3–5 of these antigen stimulated B cells enter a given follicle and there they undergo exponential growth that fills the follicular network in 3–4 days [2]. These cells, called centroblasts, are believed to lose surface Ig expression and undergo hypermutation. It is believed that these hypermutating cells undergo several rounds of mutation followed by selection within the microenvironment of the germinal center [23, 6]. The selection process is believed to encompass both a positive selection for higher affinity and a negative selection barrier to remove clones that have developed self-recognizing phenotype or other detrimental mutations [20]. Those cells that pass the selection barriers enter the circulation as high affinity plasma cells or memory cells.
4 The Process of Hypermutation
The primary repertoire appears to be sufficient for the organism to recognize with a certain threshold affinity, and in some cases even high affinity, the antigenic challenges presented by the environment. The additional mechanism of somatic hypermutation, that in humans appears to be primarily antigen driven, improves the affinity of the antibody for the antigen by two orders of magnitude or more, with some expense of energy and cells, and some risk (i.e., autoimmunity and malignancy) to the organism. It has been hypothesized that this process is simply an evolutionary relic [3] that was initially needed to generate primary repertoire locally. However, it seems unlikely that this process which produces immunologic memory and high affinity effector antibody molecules at some expense and risk to the organism is redundant. It provides at the very least the security that in a world of countless and evolving pathogens, the organism can protect itself, but one might also suspect that the true utility of this process may even extend beyond antigen response and into a larger control mechanism for the organism, whose role may be appreciated more during early development, [21] or during the shaping and maintenance of memory.
Although the actual mechanism of hypermutation is still not understood, it appears to have some link to the transcription process, and several models have been suggested along these lines [17, 32, 11, 3]. The mutations introduced are primarily point mutations, although deletions and insertions do occur, and more frequently than previously suspected [24]. Mutations seem to occur preferentially in the region bounded by the transcriptional promoter at the 5′ end, and the C gene at the 3′ end. The pattern displayed is that of a rapid peak in mutation frequency, followed by a slow decline out to about 1.5–2kb downstream [14, 26]. The regions of both light and heavy chain V genes that are selected have an average of 3–13 mutations, but can have upwards of 20 [19]. The primary targets for hypermutation are the CDRs, or complementary determining regions, of which there are three in both heavy and light chain, separated from each other by intervening framework sequences(FRW). The CDRs are only a few residues in length but their position in the protein molecule and configuration in three-dimensional space make them crucial in the evolution of diverse antigen combining sites [14].
The substrates within each CDR that are frequently seen mutated are defined as “hotspots”. They are described by preferences for purines, rather than pyrimidines, as well as for particular codons, or codon motifs within the sequence. The fact that mutation in a hotspot can create or delete other hotspots indicates a higher order structure to the mutation process than that which is currently observable [5]. In vitro random mutagenesis studies show loss of around 50% of clones that accumulate more than one mutation [42]. This is due to the effects of both diminished antigen binding, as well as loss of expression of a functional Ig molecule. These cells are believed to undergo apoptosis, perhaps mediated via T cells [27, 1]. Despite the evidence suggesting high loss and apoptosis in germinal centers [27], true numbers of in vivo loss are not well documented. If mutation results in the production of a functional Ig molecule, then it is believed to be tested for affinity against the available antigen trapped in the follicular dendritic network of the particular germinal center. The role of competition for limited antigen, although figuring prominently in prior models [23], is still being elucidated [31]. Following this process of selection, which appears to have both a positive and a negative barrier as described above, the high affinity antibody-producing B cell may leave the germinal center and enter the circulation as a plasma cell or a memory cell [20].
5 The Model
The model presented here attempts to delineate a selection-based model of the evolution of the affinity-matured antibody. The contribution of the microenvironment in the germinal center as well as the intrinsic properties of primary repertoire antigen– antibody interactions versus affinity-matured interactions are considered. In addition, the desire to understand such observations as repertoire shift of variable region genes in the memory compartment, as well as to suggest an underlying mechanism of somatic hypermutation which is an unique adaptive evolutionary process in mature organisms are considered. The following sections give a more detailed biological context within which the methods and results can be interpreted.
5.1 Local Steps versus Global Jumps
This component attempts to model the biological “trade-off” that occurs during the mutation process and allows the rapid generation of high affinity antibodies. One might understand this trade-off in terms of the mutations that produce only local changes in the conformation and are therefore more likely, although not exclusively, to produce incremental changes in the affinity, versus those mutations that produce more global changes in conformation and therefore might be expected to produce rather large jumps in affinity.
In terms of affinity, the prior treatment of affinity changes and mutational studies lead to the idea that through the mutation process, the selection is for those clones that undergo a stepwise increase in affinity [33, 5] – an additive effect of changes that create new H bonds or new weak electrostatic or hydrophobic interactions between the residues and associated solvent molecules [7, 1, 4]. However, it is observed that all codon changes cannot be translated into stepwise energetic changes [7]. In the literature, this affinity increase is often correlated with a lower more so than a higher for affinity measurements, although which one is more important for overall affinity increase of Igs is still unclear [41, 1]. With regards to the changes in conformation, the nature of the affinity change secondary to the stepwise energetic changes in the selected antibodies has also led to the idea that the conformation is handled likewise. This progression to a lock and key conformation occurs at the expense of entropy in exchange for a decrease in free energy and a commensurate increase in affinity [41]. Since we cannot reliably observe the process, we cannot presume that this stepwise search is what is always functioning in the germinal center. We predict that the rapid elaboration of high affinity antibodies through the germinal center reaction may necessitate that the system occasionally make a large jump in order to better sample the affinity landscape.
The positions of positively selected mutations show that replacement mutations occur preferentially in the CDRs versus the intervening framework regions (FRWs). The FRW was often described as being very sensitive to replacement mutations, but it appears now that they too can tolerate a certain number of replacement mutations, and that the CDRs may alternately, possess a sensitivity to mutation through the coding structural elements as well [42]. The greatest diversity a priori is seen in the CDR 3, which appears to have the most contact residues with the antibody, while the other CDRs usually comprise the sides of the binding pocket [21]. During hypermutation, it is often in CDR 1 and 2 that one observes most of the mutations, whereas in CDR 3, there are relatively fewer, and they do not usually affect the existing contact residues [21, 13, 40]. We might then hypothesize that the local steps will result preferentially from mutations in CDR 1 and 2 and that global conformation changes might occur from CDR 3 or even FRW mutations. This is of course not absolute, as experimentally, CDR 2 regions have also been seen to contribute to the binding pocket, and to have long range interactions at certain residues that make mutations in them change significantly the antibody conformation [42]). Furthermore, certain base pair positions that are frequently mutated in the CDRs may create conservative local changes, while mutations outside of these positions may be more frequently associated with global changes [40, 26]. The less frequently mutated codons are more common within the CDR 3, and this CDR experiences fewer mutations than the other CDRs or FRW regions, thus supporting the above generalization.
Growing evidence suggests that the primary repertoire is composed of multivalent, and highly flexible Igs that conform to the antigen, but through hypermutation they generate a rigid lock and key fit. Studies comparing germline diversity with hypermutated V genes showed that the amino acid differences introduced by mutation were fewer than the underlying diversity of the primary repertoire, and further suggested that through mutation, the more conserved residues of the CDR 1 and 2 that often create the periphery of the binding site are favored for mutation, whereas the more diverse residues are generally not mutated [13]. Although exceptions were cited for both of these generalizations, this supports a notion that the mutation mechanism has evolved to focus mutations primarily in those residues which, in the three-dimensional geometry of the CDR loops, will create a tighter fit for the antigen, and decrease flexibility of CDR 1 and CDR 2 at the periphery of the binding pocket [40]. The diversity of the primary repertoire can rarely achieve this energetic feat.
An additional mechanism for global jumps may be appreciated from the relative frequency of deletions and insertions. Recent work has identified deletions and insertions in single cell analysis of GC derived B cells at a frequency much higher than previously suspected, in the range of 4–16 percent of in-frame rearrangements [24]. These types of alterations would be suspected to contribute greatly to the occurrence of global changes in conformation and affinity.
5.2 Consistency of Response
Another component of the model will be the robustness of this evolutionary optimization to the diverse population of antigens that the organism faces. How do the mutation and selection processes ensure consistency in their response? The resulting affinities as well as the timing of response exhibit remarkable consistency both within the response to a given antigen and across responses to diverse antigens. The naive repertoire usually produces antibodies with affinities on the order of , and the somatic hypermutation process produces antibodies with a range of affinities from to within a period of days from a finite number of clones.
Additional consistency arises within a response to a given antigen, as the high affinity clones share many favorable mutations [31]. Although other amino acid substitutions in that same position also confer high affinity, they are not selected for or observed in the mature response [31]. This is considered as evidence of a negative selection barrier in the process that might be protecting against harmful mutations [31, 20], although it may be an intrinsic feature of the mutating sequences. There is also evidence of consistency in specific base pair positions selected for mutation across different responses in both productive and non-productive rearrangements [13]. The codons in the CDRs seem, by their nature, to be predisposed in favor of replacement mutations during hypermutation. How does the system work within the constraints of the available number of clones, the timing observed for response, and even the physical or energetic limitations of the mechanism to ensure a consistent response? [30]. The potential benefits of the germinal center may be discussed in this respect.
The compartmentalization of the germinal center provides ease of interaction of the necessary components, ability to segregate beneficial from detrimental mutations in a controlled fashion, perhaps decreased energy expenditure for the organism, and improved diversity of antibodies, since each germinal center appears to function autonomously [31]. If we treat our model according to this compartmentalized representation, the parameters are defined independently within each germinal center. The initial number of clones entering a given GC is observed to be 3–5 antigen stimulated B cells that have received helper T cell signals [14]. Previous models have suggested that these cells enter a division phase that fills the GC over a period of 3–4 days [28, 23], stop expressing surface Ig, and begin hypermutation. This would be followed by selection against the antigen trapped within the individual GC follicular dendritic network. Current evidence favors several rounds of mutation and selection [23], and more than one mutation per cycle of hypermutation [30, 18]. In between these rounds of selection and mutation, one might presume that the positively selected clones would have to be given an advantage, i.e., by generating more offspring, but how this is translated into a number of cell divisions is not clear, nor is how the final decision is made to allow the cell to exit the GC when and if it attains a high enough affinity. Maybe it is a time-related phenomenon, or perhaps an affinity threshold controlled process. Even with the benefit of the fastest observed generation time in the GC, which is 6 hours [30], the 3–4 days of generation time gives a population of -. From this starting point, we want to understand the probability of generating a high affinity clone, and how many mutations it will take to get us there.
5.3 The Affinity Threshold
A third component will be to treat the dependence of response time on the affinity threshold level. Following the initial antigen presentation, at around day 5, there appear in circulation low affinity plasma cells. The germinal center begins to form a few days after antigen exposure, and the first mutated V genes are detected around day 5–7 [30, 37]. Samples of V genes throughout this primary GC reaction show increasing numbers of mutations over time [30]. Subsequent immunization produces a fast response of high affinity antibodies, usually within 1–3 days [14]. The V genes of the high affinity antibodies of secondary and tertiary immune responses are also seen to have more accumulated mutations, but the incremental increase in affinity following the primary response is low [14, 15]. This implies a point of diminishing returns for this process.
Interestingly, the high affinity antibody molecules of the secondary response frequently use different V genes than the primary response population. This is referred to as repertoire shift and there does not appear to be enough time for these cells to be created de novo from the newly forming germinal centers. Therefore, these cells must have evolved into memory either late in the primary germinal center response or during the interval between. This of course presumes adequate time between innoculations, as too short or long an interval between exposures will produce a diminished response. In humans, hypermutation seems to be largely confined to the germinal center. The reaction in the GC lasts about 2–3 weeks, although antigen has been shown to remain on follicular dendritic cells for years following the primary immune response [14] and Ig-expressing B cell blasts can be evident for months following initial exposure [28]. It has been suggested that this remaining antigen is the force behind the shaping of the memory immune response between exposures, and that it also accounts for the repertoire shift. In addition, the memory compartment for a given epitope is often oligoclonal, whereas the high affinity late primary stage clonotypes can be numerous [31]. It is possible that following the primary exposure, there are two populations of cells generated through the germinal center– a fast response effector population and a slow response memory population. It is interesting to note that there may be an energetic advantage to some of these repertoire shifted memory cells–that they do not necessarily have higher affinity, but perhaps they cross an energy barrier more easily [15]. This would imply kinetic selection as opposed to affinity selection during this phase of the immune response. Attempting to understand these other selection parameters in shaping the memory response would be an interesting prospect for future models.
5.4 Evolution of the Mutation Dynamics
The fourth component deals with the evolution of the above outlined trade-off and how it is optimized in the organism. The observed mutation distribution is not random, because if it were, the degeneracy rate predicted would be too high. Instead it has evolved to target certain sites preferentially [31, 13]. Intrinsic hotspots are usually characterized as 3–4 base pair sequences such as AGC and TAC and their inverted repeats and RGYW motifs (R=purine, Y=pyrimidine and W=A,T) [43, 12]. These motifs are shown to be hotspots independent of antigenic selection, and concentrated in the CDRs, often in an overlapping fashion [12, 14]. Other characteristics of this mutator mechanism include a preference for point mutations over deletions/insertions, a bias against mutations in thymidine and in favor of mutations in purines instead of pyrimidines. Mutations are favored in non-degenerate sites, and the replacement/silent mutation (R/S) ratios are higher in the CDRs in both selected and non-selected V genes, also suggesting intrinsic targeting of these areas [12]. Most significantly, in experiments with a light chain transgene, silent mutation in one part of the gene resulted in loss of a hotspot motif and in the appearance and loss of hotspots in other areas [18]. This argues for a higher order template as well as an evolving dynamic with loss and acquisition of mutations. This higher order structure may be conferred by DNA folding, or perhaps DNA–protein interactions [18]. Nevertheless, this dynamic might be expected to exhibit some convergence in order to maintain the consistency observed between individual responses.
6 The Evolutionary Landscape
As described in the previous sections, we treat the affinity maturation of the primary humoral immune response as a problem of global optimization. This paradigm should be contrasted with the “population dynamics” approach. The latter class of models entails the tallying of individual immune cell types and the investigation of the transition dynamics between their allowable states. Such models stress the emergence of affinity optimization as a result of these cell population dynamics. In this vein, it is generally the evolution of the average affinity in the population that is the dominant variable.
The paradigm we employ here begins instead by considering the problem of affinity optimization. We study the sources of complexity in this problem and infer general principles that this optimization must adhere to, avoiding whenever possible making ad hoc assumptions about the particular mechanics at play. In this regard, our model concentrates on the hypermutation process inside the germinal centers.
Moreover, the dominant variable in our model is the maximum affinity level that has been achieved at any stage of the hypermutation process. Thus, the size of the B cell population is exogenous to our model. We assume that the hypermutation process is initiated via a mechanism outside the scope of our model. Our treatment of the hypermutation process terminates upon the development of a clone with sufficiently high affinity. Finally, as a result of our focus on the affinity improvement steps, we measure time in a discrete fashion by the inter-mutation periods.
Specifically, we begin with the space of all DNA sequences encoding the variable regions of the Ig molecules and a function on that space that models the likelihood that the resulting Ig molecule becomes attached to a particular antigen. This affinity function is conceptualized in a series of mappings which portray the biochemical mechanisms involved.
To begin with, the gene in question is transcribed into RNA and subsequently translated into the primary Ig sequence. This step describes the mapping from the genotype (a 4–letter alphabet per site) to the sequence of amino acids making up the Ig molecule (a 20–letter alphabet per site). The next step is the folding of the resulting protein into its ground state in the presence of the antigen under consideration. This step is modeled as a mapping from the space of amino acid sequences to the three- dimensional geometry of the resulting Ig molecule111This concept is analogous to that of shape space in Chap. 13 of [35]..
Finally, the protein shape gives rise to the free energy of the Ig molecule in the presence of the antigen. The free energy in turn is used to define the association/dissociation constants and the Gibbs measure which determines the likelihood of attachment. The resulting affinity is visualized as a high-dimensional landscape, where the peaks represent DNA sequences that encode Ig molecules with high affinity to the particular antigen.
The process outlined above for modeling the affinity landscape depends on detailed knowledge which is often unavailable. Furthermore, our interest in the universality of the immune response has led us to a model that does not assume a detailed knowledge of the particular invading antigen. We will return to this critical theme in the section on Performance Robustness. For the time being, we acknowledge the need to reduce the series of mappings described above to a set of affinity classes, as in [23].
The underlying theme of our modeling effort has been the delineation of the trade-off between the safety of mutations leading to local steps in shape space (and consequently incremental affinity improvements) and the eventual necessity of mutations that result in global jumps in shape space as discussed in section 5.1. The main ingredient of our affinity landscape model reflects this trade-off by associating to each point in the space of DNA sequences the unique sequence to which it converges following a discrete gradient ascent algorithm.
Let denote the space of DNA sequences encoding the and regions of an Ig molecule. Let be a positive, real-valued function on , which denotes the affinity function, as described above. Finally, consider the gradient operator , where describes the neighborhood structure222In this paper we concentrate on point mutations as the mechanism for local steps and thus the neighborhood we consider consists of all 1–mutant sequences. It has been suggested [30, 18] that more than one point mutation may occur before the resulting Ig molecule is tested against an antigen presenting cell to determine its affinity. Our model can capture such an eventuality by appropriately modifying the neighborhood structure to include the 2– or generally k–mutant sequences. in . With this notation, for each sequence , successive applications of the gradient operator converge to the closest local optimum, i.e., there is a finite positive integer and a sequence such that for all ,
Using this association, we partition into subsets that map to the same integer under . These level sets contain all sequences that are a fixed number of point mutations away from their closest local optimum.
A further ingredient of our model for the affinity landscape is the relative nature of the separation between strictly local and global optima. In practice, the global optimum is not necessarily the goal. Instead, some sufficient level of affinity is desired. This affinity threshold is generally unknown a priori. Our model allows us to view the landscape as a function of the desired affinity threshold. As we show in section 9.4, we are able to study the dependence of our model’s performance for a variety of affinity thresholds and thus investigate the trade-off between the desired affinity and the required time.
The consideration of strictly local versus global optima as a variable characteristic necessitates a finer partition of the level sets. Specifically, for each level of affinity threshold, some of the local optima in are below it and therefore are considered strictly local, while others are above it and are therefore considered global. This leads to a finer decomposition of each level set into the part containing sequences a certain number of steps below a strictly local optimum versus sequences whose closest local optimum is also global because its affinity is above the desired threshold.
Let be a probability distribution333Often, as is the case in this paper, the uniform distribution is used. If there are prior preferences observed for particular alleles at certain base pairs, they can be modeled by altering accordingly. on . Let
and
where is the affinity threshold, and
is the set of sequences that converge to a member of after sufficient iterations of the gradient operator. Using this notation, let
and
denote the height of the strictly local and the global optima, respectively. Notice that for notational convenience, we have suppressed the dependence of these measures on the affinity threshold . Unless stated explicitly otherwise, these measures of the affinity landscape will always depend on the affinity threshold as discussed above.
Despite the lack of detailed knowledge of the biologically relevant affinity landscapes, there is broad agreement that the size of the level sets decreases rapidly. A popular model used previously in [23] asserts that the level sets are decreasing in size at an exponential rate controlled by a parameter (in the notation of [23] this parameter corresponds to ). In this paradigm, one has and with , , the appropriate normalization constants, and , a parameter that determines the relative size of the set of points for which discrete gradient ascent traps them at strictly local optima versus those points for which this greedy algorithm is sufficient to take them to a global optimum.
While the biologically meaningful range of values for the parameters , , , and is uncertain, the values we use are in agreement with the values for similar parameters used by other authors. Specifically, we restrict our attention to , , and .
7 Optimization Dynamics
We model the dynamics of evolutionary optimization on the affinity landscape as a Markov chain. Specifically, the chain may take one of two actions at each time step: it may search locally to find the gradient direction, and take one step in that direction or it may perform a global jump, which effectively randomizes the chain. The decision between the two available actions is taken based on a Bernoulli trial with probability : when , the chain performs global jumps all the time while prohibits any global jumps. Thus, the parameter controls the degree of randomization in the Markov chain. The biological distinction between local search versus global jumps is realized by means of at least two mechanisms described earlier: deletions/insertions and point replacements that lead to large changes in the resulting geometry.
The mathematical description of the Markov chain model described above uses the following generator:
We are interested in estimating the extreme left tail of the distribution of the exit times for the resulting Markov chain. In particular, let
where denotes the Markov chain under consideration. We are interested in estimating the likelihood that at least one out of a population of identical, non-interacting replicas of the Markov chain will reach an affinity level higher than before time . It should be noted that, by virtue of the discrete nature of the Markov chain, time in this context is measured by the number of mutation cycles experienced by the system. The probability we are looking for takes the form
where denotes the path measure induced by the Markov chain and the index tallies the replica under consideration. Since we are focusing our attention to the GC reaction, is approximately -.
8 Methodology
The study of the evolutionary optimization process outlined in the previous section uses results by the second author on the covergence rates of exit times of Markov chains [38]. The general approach for estimating the desired tails of the exit time distributions consists of the following steps:
-
(i)
We formulate a Dirichlet problem for on whose solution provides a martingale representation of the Laplace transform of the exit time .
-
(ii)
We solve the resulting Dirichlet problem and compute the desired Laplace transform as
where denotes the expectation starting from a –distributed initial sequence.
-
(iii)
We compute the Legendre-Fenchel transform of the cumulant of as
where is the (positive or negative depending on whether or not) solution to
It turns out [38] that, for ,
-
(iv)
We estimate by performing a Taylor expansion of the cumulant of at , yielding
as . Inverting the polynomial on the right-hand side we obtain the general form
Specifically, if we stop the Taylor series after the linear term we have and .
9 Results
Our goal in the modeling exercise described in the previous few sections was not to produce exact quantitative predictions for the behavior of the immune system. Instead, our main goal has been to elucidate the drivers behind the apparently complex behavior of the immune system and develop a qualitative understanding of what makes the system work so efficiently. With this in mind, we acknowledge that our model is purposely kept simple enough to allow a thorough analysis and simulation.
Our results are presented in this section in order of increasing complexity. First we discuss the surprisingly quick response of the system which is governed by a variant of the recently discovered cutoff phenomenon in many Markov chains. Then, we proceed to exhibit the dependence of the system’s response time on the value of the trade-off parameter . A relatively narrow band of values for are shown to significantly outperform all others.
Until this point, we consider one antigen and resulting affinity landscape at a time. In order to appreciate the general applicability of the trade-off discussed above, we proceed next to describe the response dynamics as a function of for a sequence of landscapes, randomly generated from the biologically motivated range of parameters presented earlier. This investigation yields a sharp transition between two regimes: a frozen, ordered regime with too little randomization and a liquid, chaotic regime with too much randomization. The corresponding phase transition occurs within the same range of that strikes the right balance in the trade-off studied before.
The next step is to investigate the trade-off between the diminishing incremental benefit in affinity against the increasing time burden as the system attempts to reach higher affinity peaks. This trade-off may cast some light on the mechanism that ends the hypermutation process.
Once we have established the existence of the narrow band of desired values of the parameter , we finally turn our attention to its biological implementation. How does the system know to set the parameter at the right level? It turns out that it doesn’t need to know. In fact, with some mild assumptions, we show that the system cannot help but adapt to exhibit a value of within the narrow desired range despite exogenous shocks.
9.1 The Cutoff Phenomenon
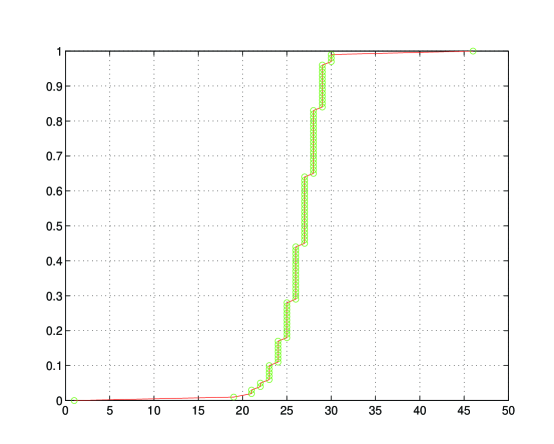
This phenomenon has been studied by Diaconis and his collaborators in [8, 9, 10]. In the context of the Markov chain modeling the affinity maturation dynamics, Fig. 1 shows a typical realization of the observed cutoff. Methodologically, our approach differs from that of Diaconis in the measure of convergence used. The more traditional approach employs the total variation distance between the sample distribution of the Markov chain after a finite number of steps and the stationary distribution. Instead, we concentrate our attention on the left tail of a family of exit times. At a deeper level, the two approaches are not as dissimilar as they may appear. The technique for estimating the total variation distance often relies on coupling arguments which reduce to the distribution of the coupling time, a stopping time not unlike the ones underpinning our approach.
In the immunological literature, this behavior has been captured by previous models of the humoral response maturation process [6, 23, 34]. Qualitatively, this result corroborates the observed speed of the affinity maturation in the immune system. Within a few mutation cycles spanning 3–4 days, the specific immune response gains 2–3 orders of magnitude in affinity. This time, measured in the number of mutational cycles, is at least 2 orders of magnitude less than the expected time to equilibrium of the Markov chain. Thus, the observed affinity maturation is a decidedly disequilibrium effect. This is certainly one of the sources of complexity in the system that defies interpretation using traditional equilibrium-oriented techniques.
9.2 The Optimal Value of
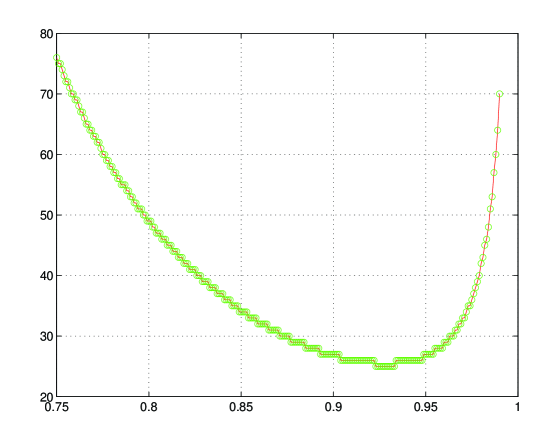
The result described in this section is an outgrowth of previous work by the second author. In [39] similar techniques as the ones described above were applied in the study of the asymptotic convergence rate of a class of Markov chains encompassing the one employed here. In that context, it was shown that under very mild conditions on the landscape, there is a nonzero level of randomization by design (i.e., beyond the minimum randomization required to avoid remaining trapped in strictly local optima asymptotically) that substantially increases the convergence rate.
Here we study the more complex problem of transient behavior of the Markov chain. Nevertheless, we obtain a qualitatively equivalent result. A fine-tuning of the parameter in a narrow range of values confers a remarkable performance improvement (Fig. 2). This qualitative behavior appears to be surprisingly insensitive to the structure of the landscape. In [39] this was investigated for exponential landscapes similar to the ones studied here, as well as broader classes of polynomial, logarithmic, and uniformly random landscapes. In all cases, the optimal level of was within a narrow overlapping range. It is this hint of universality that has led us to the robustness investigation that follows next and which uncovers a further charactreristic of this class of complex systems.
9.3 Performance Robustness
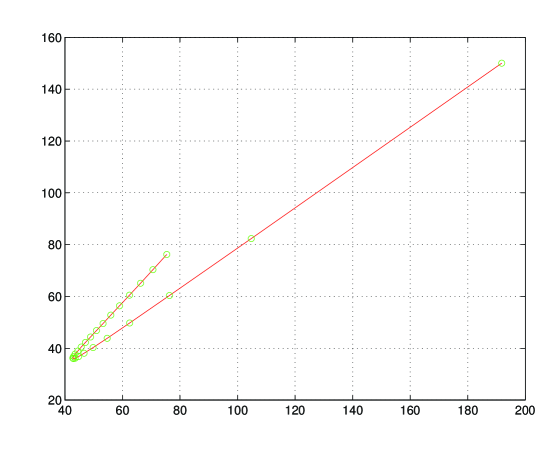
As alluded to above, performance robustness refers to the surprising consistency in the efficiency of the immune system response to a combinatorially large set of invading antigens. We studied this problem by performing the trade-off analysis for the optimal value of for a population of randomly generated landscapes from within the biologically justifiable range of parameters mentioned earlier. One thousand different antigens were tried, and the resulting mean and standard deviation of the response time were plotted for a series of values. In Fig. 3 we have suppressed the third dimension () in order to illustrate more clearly the two observed regimes. For clarity, note that corresponds to the point close to (80,80) in the graph, while corresponds to the point close to (190,150), with equally-spaced, increasing values in between. We observe that for very high values of , the system’s expected performance suffers a rapid decrease accompanied by an increase in the variability of that response across different antigens. As we lower the value, there is a narrow range between about 0.85 and 0.91 for which the system attains the best response time and the lowest variability of that performance as it faces varying antigens. Past that point, there is a sharp change in the system’s behavior. The expected response time deteriorates and the variability of that response grows even faster. Using the same approach as in [39], we identify the first of these two regimes with a solid phase which is too ordered to escape the strictly local optima that abound in a randomly generated ladnscape. Similarly, the second regime is seen as a liquid phase with too little structure to effect the desired progression towards higher affinity peaks. Instead, systems in this regime appear to diffuse aimlessly in sequence space. The observed sharp transition between these two regimes is analogous to the concept of the edge of chaos introduced by Kauffman [22] as well as the notion of a critical level of parallelism investigated in [29].
9.4 The Affinity Threshold
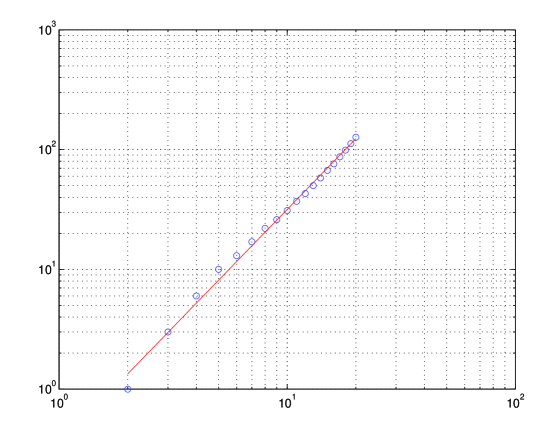
So far, our results related to the time it takes the system to achieve a fixed desired level of affinity. In this subsection we ask the question how the system knows when to terminate the hypermutation process. Clearly, a new trade-off becomes relevant between the energetic costs and immunologic risks (e.g. autoimmunity or malignancy) of continuing the hypermutation process for longer and the expected incremental affinity gains as discussed in detail in Sect. 9.4.
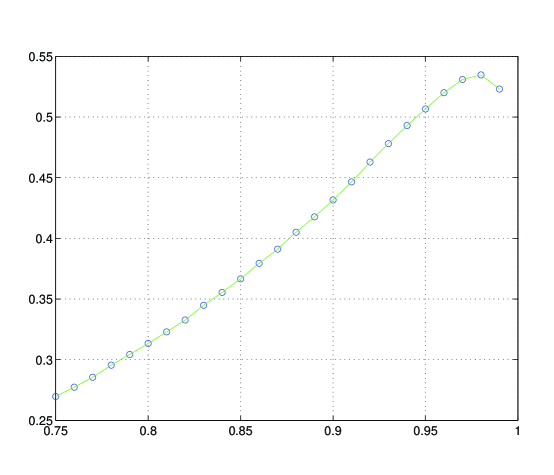
As one might expect, diminishing incremental affinity gains are a rule. Figure 4 exhibits the power-law relationship that holds between the response time and the resulting affinity for a fixed value of . We are interested to investigate how this power law varies as moves across the two regimes outlined above. In general, we obtain an approximate power law of the form . Figure 5 shows the behavior of . We observe that the rate at which incremental gains diminish increases as is lowered deeper into the liquid phase. It is worthwhile to note that the value of , which corresponds to the scaling behavior of Brownian motion, is attained close to the value of that leads to the phase transition described in the previous paragraph.
One biological interpretation of this observed variation of the scaling law as a funtion of is that lower values of are intrinsically riskier, in that they entail more global jumps. Thus, it is not surprising that lower values of exacerbate the trade-off between time and diminishing affinity gains in favor of stopping the hypermutation process sooner. We conjecture that this type of behavior leads to a two-tiered response:
-
(i)
After a relatively modest amount of time, a sufficient affinity improvement has been gained to allow the mature plasma cells to exit the GC and mount a highly specific and effective attack on the invading antigen.
-
(ii)
The hypermutation process continues in the background and now strives to generate an even more specialized population of memory cells to maintain long-term immunity to the antigen in subsequent reinfections.
The above results lead to the consideration of the repertoire shift phenomenon. The emergence of this phenomenon has been studied in earlier models. Specifically, within the population dynamics paradigm, Shannon and Mehr in [36] use the “destructive effect of hypermutation on the primary B cell repertoire” to show that the memory cell population converges to a moderately high affinity level: lower than the constituents of the fast primary response, which die out due to the overwhelming likelihood of affinity-reducing (and thus lethal) subsequent mutations, but higher than the background average due to the hypermutation and antigen-constrained selection processes in the germinal centers.
The global optimization paradigm presented in this paper offers a further, direct explanation for the occurrence of repertoire shift. While the result is not new, we present it mainly to illustrate the usefulness of the proposed paradigm. During the ongoing hypermutation process suggested in step (ii) above, new peaks in the affinity landscape eventually emerge, arising from V genes not present in the primary response. Specifically, while some sufficiently high affinity peaks are reached relatively fast during the primary response, they sometimes lead to lineages whose affinity plateaus shortly thereafter. At the same time, other clones, which found themselves in more modestly rising affinity “hills” during the primary response, eventually experience more rapid affinity improvement, which leads them to surpass the performance of the lineages that dominated the primary response.
9.5 Evolving to the Edge of Chaos
Having exhibited the critical dependence of the response time to the value of , we address the question of how the immune system knows to fine-tune the value of within the narrow desired band. We hypothesize that the nature of the evolutionary dynamics is such that the system cannot avoid being drawn to operate within the desired band of values.
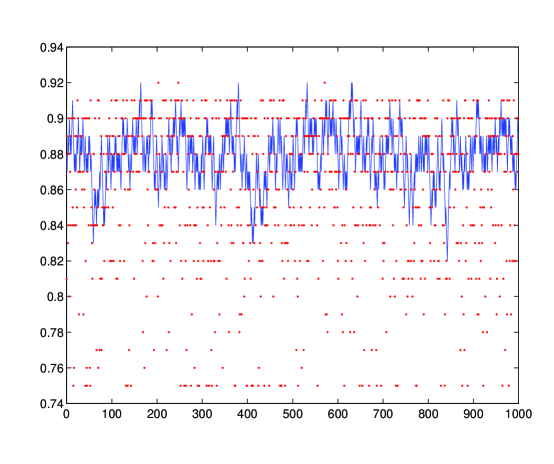
In order to examine this hypothesis, we conjectured that the mutator control mechanism which biologically instantiates the parameter is itself coded in the genome along with the rest of the Ig molecule. Even though that part of the genome is not involved directly in the affinity-based selection as it doesn’t code for the Ig molecule, it may be subject to a longer scale mutation and selection process. Such a stipulated evolution may theoretically occur at the level of individual cells (as is the case with the evolution of Ig affinity during the hypermutation process), or at the level of organisms across more traditional evolutionary time scales. The mechanics of mutation control, which account for the value, are not understood well enough to determine this point with certainty. In any case, the simulations we present below of an evolving value apply equally well to either interpretation. The idea is that, as a population of individuals is facing ever changing antigens, values in the optimal range dominate the population. The main difference between the two interpretations would be in the meaning of individual (cell vs. organism). For the rest of this subsection we assume that such a process exists. We further assume that we can model the process as a reversible nearest neighbor random walk with biased transitions towards the neighboring value that reduces the immune response time. We justify this bias by the strong selectional advantage of clones with faster immune response times. Using this hierarchical evolution model, we simulated one thousand successive infections with different antigens. During each infection the system has a fixed value of and behaves as described in the sections above. Between infections, the system performs one step of the biased random walk, motivated by the selectional advantage of the clones with the faster response time to the previous infection. Fig. 6 depicts the evolving value of in the population (solid line) and the optimal value of corresponding to the landscape for each new infection (dashes). This optimal value for each new landscape acts as an exogenous shock to the system. Figure 6 shows that despite these periodic exogenous shocks (which would have the system decrease its value into the liquid phase), the system stays within the desired narrow band, without explicit instruction.
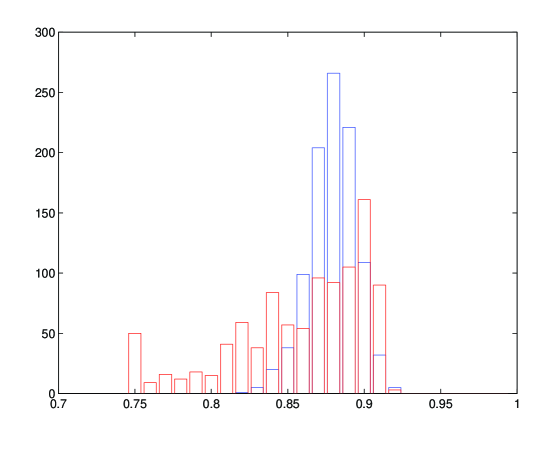
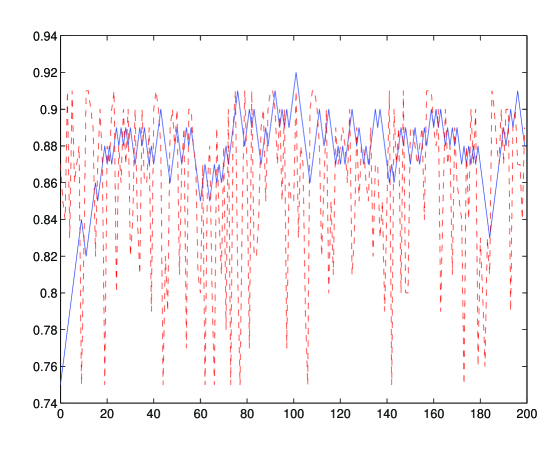
In Fig. 7 we show the histograms associated with the values in Figure 6. Once again, we see the system converging to a much tighter distribution of values than the exogenous shocks. Finally, Fig. 8 shows the transient behavior of this hierarchical evolution model. We purposely started the system at , distinctly outside the desired range, and let it evolve autonomously. Once again, without any instruction, the system converges rapidly to the desired band of values and is stabilized within that band.
10 Conclusions and Directions of Further Study
Our model gives evidence that the mutator mechanism functioning during somatic hypermutation has evolved to a trade-off value of that gives a fast, efficient, and consistent response. While this mechanism is still not understood, certain transcriptional elements appear to be necessary for mutation in both heavy and light chain genes, although additional, novel molecular mechanisms need to be considered. Our model shows that global jumps need to occur during the process, and from a biologic standpoint, these may be understood in two ways. They may be encompassed by the less frequent, but necessary mutations in the more diverse regions of the CDRs or in the FRW regions, or in the form of deletions and insertions. This latter characteristic in particular implies the occurrence of double strand breaks in the DNA and may support evidence of recombination [25] or reverse transcription models [3].
With regards to the affinity threshold, our model demonstrates the diminishing incremental gains in affinity as a function of an increasing number of mutations. Future investigation might inlcude analysis of the selection process during the ongoing shaping of the memory compartment that likely encompasses alternative selection parameters, kinetics, for example, being one of them [15].
Our model also shows that the evolution of mutations seems to have an internal driver that points us toward the higher order template underlying the observable hotspots. This finding emphasizes the evolutionary efficiency with which nature approaches this problem.
As was mentioned during the description of the model, the process of hypermutation has been suggested to be redundant or unnecessary [3]. We proposed larger control mechanisms underlying the changes between primary and secondary repertoire that might explain the persistence of this process. A next step might include an attempt to understand these mechanisms, perhaps in regards to tolerance and early development, or in regards to the dynamics of the antibody repertoire acting beyond affinity selection. Hypermutation may be a necessary step to set the stage for these other processes to occur.
References
- [1] Kerstin Andersson, Jens Wrammert, and Tomas Leanderson. Affinity selection and repertoire shift: paradoxes as a consequence of somatic mutation. Immunological Reviews, 162:172–182, 1998.
- [2] C. Berek, A. Berger, and M. Apel. Maturation of the immune response in germinal centers. Cell, 67:1121–1129, December 1991.
- [3] Robert V. Blanden, Harald S. Rothenfluh, Paula Zylstra, Georg F. Weiller, and Edward J. Steele. The signature of hypermutation appears to be written into the germline IgV segment. Immunological Reviews, 162:117–132, 1998.
- [4] Bradford C. Braden, Ana Cauerhff, William Dall’Acqua, Barry A. Fields, Fernando A. Goldbaum, Emilio L Malchiodi, Roy A. Mariuzza, Roberto J Poljak, Frederick P. Schwarz, Xavier Ysern, and T.N. Bhat. Structure and thermodynamics of antigen recognition by antibodies. Annals of NY Academy of Science, 764:315–327, 1995.
- [5] McKay Brown, Mary Stenzel-Poore, Susan Stevens, Sophia K. Kondoleon, James Ng, Hans Peter Bachinger, and Marvin B. Rittenberg. Immunologic memory to phosphocholine keyhole limpet hemocyanin. Journal of Immunology, 148(2):339–346, January 1992.
- [6] Franco Celada and Philip Seiden. Affinity maturation and hypermutation in a simulation of the humoral immune response. European Journal of Immunology, 26:1350–1358, 1996.
- [7] D.G. Covell and A. Wallqvist. Analysis of protein-protein interactions and the effects of amino acid mutations on their energetics. Journal of Molecular Biology, pages 281–297, 1997.
- [8] P. Diaconis and L. Saloff-Coste. Walks on generating sets of abelian groups. Probability Theory and Related Fields, 105:393–421, 1996.
- [9] Persi Diaconis. The cutoff phenomenon in finite markov chains. Proceedings of the National Academy of Science, 93:1659–1664, February 1996.
- [10] Persi Diaconis. From shuffling cards to walking around the building: an introduction to modern markov chain thery. Documenta Mathematica, Extra Volume ICM 1998(I):47–64, August 1998.
- [11] Marilyn Diaz and Martin F. Flajnik. Evolution of somatic hypermutation and gene conversion in adaptive immunity. Immunological Reviews, 162:13–24, 1998.
- [12] Thomas Dorner, Hans-Peter Brezinschek, Ruth I. Brezinschek, Sandra J. Foster, Rana Domiati-Saad, and Peter E. Lipsky. Analysis of the frequency and pattern of somatic mutations within nonproductively rearranged human variable heavy chain genes. Journal of Immunology, 158:2779–2789, 1997.
- [13] Thomas Dorner, Sandra J. Foster, Hans-Peter Brezinschek, and Peter E. Lipsky. Analysis of the targeting of the hypermutational machinery and the impact of subsequent selection on the distribution of nucleotide changes in human VDJH rearrangements. Immunological Reviews, 162:161–171, 1998.
- [14] K. Elgert. Immunology: Understanding the Immune System. Wiley-Liss, 1996.
- [15] Jefferson Foote and Cesar Milstein. Kinetic maturation of an immune response. Nature, 352:530–532, August 1991.
- [16] Jefferson Foote and Cesar Milstein. Conformational isomerism and the diversity of antibodies. Proc. Natl. Acad. Sci., 91:10370–10374, October 1994.
- [17] Y. Fukita, H. Jacobs, and K. Rajewsky. Somatic hypermutation in the heavy chain locus correlates with transcription. Immunity, 9:105–114, July 1998.
- [18] Beatriz Goyenechea and Cesar Milstein. Modifying the sequence of an immunoglobulin V gene alters the resulting pattern of hypermutation. Immunology, 93:13979–13984, 1996.
- [19] Nancy S. Green, Mark M. Lin, and Matthew D. Schraff. Somatic hypermutation of antibody genes: a hot spot warms up. BioEssays, 20:227–234, 1998.
- [20] Shailaja Hande, Evangelia Notidis, and Tim Manser. Bcl-2 obstructs negative selection of autoreactive, hypermutated antibody V regions during memory B cell development. Immunity, 8:189–198, February 1998.
- [21] Harry W. Schroeder Jr, Frank Mortari, Satoshi Shiokawa, Perry Kirkham, Rotem A. Elgavish, and F.E. Bertrand III. Developmental regulation of the human antibody repertoire. Annals of NY Acad. of Science, pages 242–260, September 1995.
- [22] Stuart Kauffman. At Home in the Universe: The Search for Laws of Self-Organization and Complexity. Oxford University Press, 1995.
- [23] Thomas B. Kepler and Alan S. Perelson. Somatic hypermutation in B cells: An optimal control treatment. Journal of Theoretical Biology, 164:37–64, 1993.
- [24] Ulf Klein, Tina Goossens, Matthias Fischer, Holger Kanzler, Andreas Braeuninger, Klaus Rajewsky, and Ralf Kuppers. Somatic hypermutation in normal and transformed B cells. Immunological Reviews, 162:261–280, 1998.
- [25] Qingzhong Kong, Reuben S. Harris, and Nancy Maizels. Recombination-based mechanisms for somatic hypermutation. Immunological Reviews, 162:67–76, 1998.
- [26] Serge Lebecque and Patricia J. Gearhart. Boundaries of somatic mutation in rearranged immunoglobulin genes. Journal of Experimental Medicine, 172:1717–1727, December 1990.
- [27] Y-J Liu, D.E. Joshua, G.T. Williams, C.A. Smith, J. Gordon, and I.C.M. MacLennan. Mechanism of antigen-driven selection in germinal centres. Nature, 342:929–931, December 1989.
- [28] Ian MacLennan. The centre of hypermutation. Nature, 354:352–353, 1991.
- [29] William G. Macready, Athanassios G. Siapas, and Stuart A. Kauffman. Criticality and parallelism in combinatorial optimization. Science, 271:56–59, January 1996.
- [30] Tim Manser. The efficiency of antibody affinity maturation: can the rate of B-cell division be limiting. Immunology Today, 11(9):305–308, 1990.
- [31] Tim Manser, Kathleen M. Tumas-Brundage, Lawrence P. Casson, Angela M. Giusti, Shailaja Hande, Evangelia Notidis, and Kalpit A. Vora. The roles of antibody variable region hypermutation and selection in the development of the memory B cell compartment. Immunological Reviews, 162:182–196, 1998.
- [32] M. Neuberger, Norman Klix, Christopher J. Jolly, Jose Yelamos, Cristina Rada, and Cesar Milstein. The intrinsic features of somatic hypermutation. Immunological Reviews, 162:107–116, 1998.
- [33] G.J.V. Nossal. The molecular and cellular basis of affinity maturation in the antibody response. Cell, 68:1–2, 1992.
- [34] Mihaela Oprea and Alan S. Perelson. Somatic mutation leads to efficient affinity maturation when centrocytes recycle back to centroblasts. Journal of Immunology, 158:5155–5162, 1997.
- [35] G.W. Rowe. Theoretical Models in Biology. Oxford University Press, 1994.
- [36] Michele Shannon and Ramit Mehr. Reconciling repertoire shift with affinity maturation: the role of deleterious mutations. Journal of Immunology, 162(7):3950–3956, April 1999.
- [37] Haifeng Song, Xiaobo Nie, Subhendu Basu, and Jan Cerny. Antibody feedback and somatic mutation in B cells: regulation of mutation by immune complexes with IgG antibody. Immunological Reviews, 162:211–218, 1998.
- [38] T.V. Theodosopoulos. Stochastic Models for Global Optimization. PhD thesis, MIT, May 1995.
- [39] T.V. Theodosopoulos. Some remarks on the optimal level of randomization in global optimization. In P.M. Pardalos, S. Rajasekaran, and J. Rolim, editors, Randomization Methods in Algorithm Design. American Mathematical Society, 1999.
- [40] Ian Tomlinson, Gerald Walter, Peter T. Jones, Paul H. Dear, Erik L.L. Sonnhammer, and Greg Winter. The imprint of somatic hypermutation on the repertoire of human germline V genes. Journal of Molecular Biology, 256:813–817, 1996.
- [41] Gary J. Wedemayer, Phillip A. Patten, Leo H. Wang, Peter G. Schultz, and Raymond C. Stevens. Structural insights into the evolution of an antibody combining site. Science, 276(5319):1421–1423, June 1997.
- [42] Gregory D. Wiens, Victoria A. Roberts, Elizabeth A. Whitcomb, Thomas O’Hare, Mary P. Stenzel-Poore, and Marvin B. Rittenberg. Harmful somatic mutations: lessons from the dark side. Immunological Reviews, 162:197–209, 1998.
- [43] J. Yelamos, N. Klix, B. Goyenechea, F. Lozano, Y.L. Chui, A. Gonzalez Fernandez, R. Pannell, M.S. Neuberger, and C. Milstein. Targeting of non-Ig sequences in place of the V segment by somatic hypermutation. Nature, 376:225–229, July 20, 1995.