An Exact Model of Fluctuations in Gene Expression
Abstract
Fluctuations in the measured mRNA levels of unperturbed cells under fixed conditions have often been viewed as an impediment to the extraction of information from expression profiles. Here, we argue that such expression fluctuations should themselves be studied as a source of valuable information about the underlying dynamics of genetic networks. By analyzing microarray data taken from Saccharomyces cerevisiae, we demonstrate that correlations in expression fluctuations have a highly statistically significant dependence on gene function, and furthermore exhibit a remarkable scale-free network structure. We therefore present what we view to be the simplest phenomenological model of a genetic network which can account for the presence of biological information in transcript level fluctuations. We proceed to exactly solve this model using a path integral technique and derive several quantitative predictions. Finally, we propose several experiments by which these predictions might be rigorously tested.
The classical approach to molecular biology is to characterize living systems principally by analyzing their individual components and determining how these components interact with each other on a case-by-case basis. In contrast, the recent development of high-throughput gene expression assays has made it possible to study the cell’s web of interacting gene products as a single, complex system with many degrees of freedom. schena_brown ; wen_somogyi .
This approach has proved to be useful not only as a new tool for medical diagnosis veer_friend ; alizadeh_staudt , but also as a fount of novel insights into how biological systems function as a whole arava_herschlag ; laub_shapiro ; spellman_futcher .
It has previously been observed in the case of gene microarray assays that data which are taken from repetitions of the same experiment can nonetheless exhibit a substantial amount of variation. These fluctuations in measured gene expression have typically been treated as a drawback to using microarrays, so much so that even where it has been observed that expression fluctuations do contain information about gene function, efforts still have been focused on finding ways to deconvolute their impact from the data hughes . This attitude is mirrored in the characteristics of many previously proposed theoretical models of gene networks; despite ample evidence that gene expression is a fundamentally “noisy,” stochastic process thattai_oudenaarden ; hasty_collins ; elowitz_swain , many such models have attempted to describe whole-network dynamics using deterministic differential equations or Boolean models collins_gardner ; kauffman_troein
In this work, we present analyses of yeast microarray data which illustrate the value of expression fluctuations as a potential source of information about genetic networks. We therefore propose what we believe to be the simplest analytical model of a whole genetic network which can explain the biological information we observe in these fluctuations. In what follows, we first solve the model using a path integral technique and derive from it several quantitative predictions. Subsequently, we propose experiments by which these predictions could be straightforwardly tested.
I Biological Information in Expression Fluctuations
In their large scale study of yeast expression profiles conducted in 2000, Hughes et al. hughes carried out 63 identically prepared gene expression assays of yeast cells under normal conditions. Though the investigators noted in passing that correlations in the fluctuations of their control data could be used to cluster genes by function, their aim was principally to gauge the magnitude of this “intrinsic biological noise” in order to be able subtract its effects from their subsequent experiments. Here, we present similar analyses of the same set of control data, arguing that the amount of biological information contained in such noise merits further study in its own right.
Using data from the same 63 assays, we constructed a series of gene networks. Networks were made by representing each gene as a node in a graph, and by drawing links between gene pairs when the Pearson correlations of their levels of expression exceeded some cut-off threshhold in magnitude. The Pearson correlation between the expression levels of two genes is defined as follows:
| (1) |
where and are the expression levels of the genes. The averaging is taken over the 63 experiments. The Pearson correlation measures how the natural fluctuations of any two genes track each other in identically prepared experiments. Two types of analyses were applied to these correlation networks.
In a fashion very similar to the original analysis done by Hughes et al., we gauged the ability of these networks to assign genes with identical functional classifications mips to the same cluster. For each constructed network, clusters were defined as sets of genes belonging to disconnected subgraphs. By tuning the Pearson correlation cut-off threshhold, we constructed networks with varying “connectedness” and thus varying sizes of the giant component. The giant component is defined as the largest disconnected subgraph of the network. At one extreme, when the cut-off threshhold is very low, the network is completely connected and the giant component is the entire set of genes. At the other extreme, when the cut-off threshhold is very high, the network is completely disconnected and all subgraphs are orphan nodes. Thus the size of the giant component varies between 1 and (where is the number of genes) and serves as a natural scale for the “connectedness” of the network.
To assess how well identically annotated genes were clustered, we calculated the fraction of gene pairs that were in the same cluster and annotated with the same functional classification, for different sizes of the giant component (Fig. 1). Specifically, any cluster of size has total possible pairs. Thus a network of clusters with sizes , has a total number of possible pairings given by . Of these possible clustered pairings, a certain number will have matching functional classification. The calculated fraction is then the number of gene pairs with matching classification divided by the total number of possible pairs.
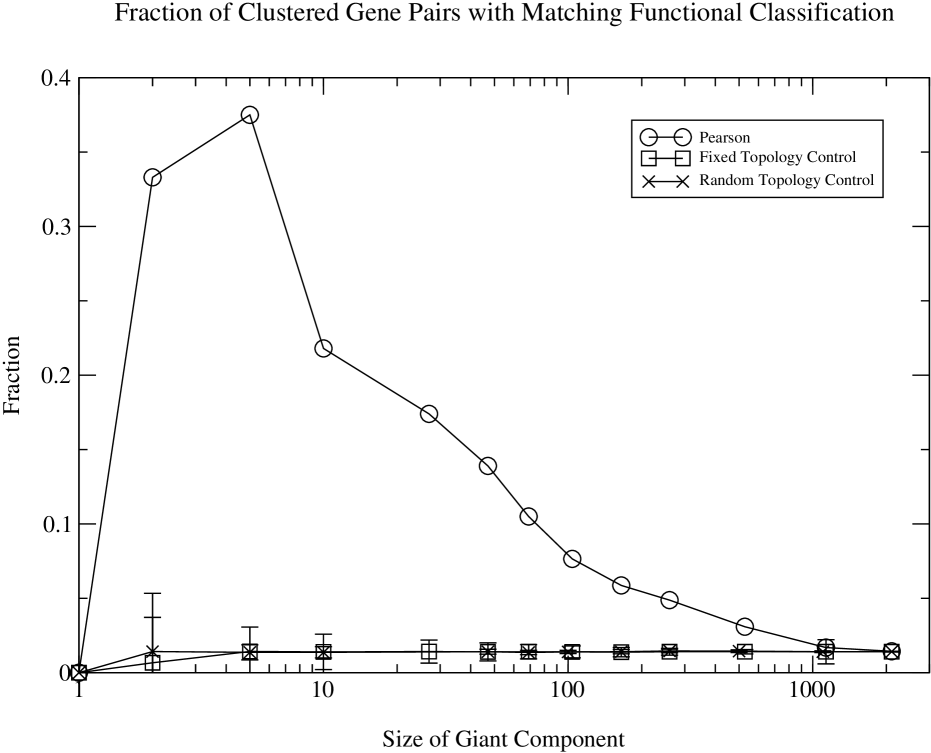
This fraction increases with decreasing giant component size until a peak value of 0.375, and then steeply drops when the size of the giant component reaches 1. For permissive cut-offs and giant components exceeding more than half the total number of genes, this fraction is near that of a random network, reflecting the loss of information as the network becomes, trivially, completely connected. Two types of random networks served as controls. The first random control set was created by fixing the topology of the network, and randomizing the classification of the genes to calculate a complementary control probability. The second random control set was created by randomly linking genes, in effect creating random topologies. Comparing the pair matching fraction of the Pearson data set to either null model shows substantial significance. At the peak of the Pearson fraction curve in Fig. 1, the p-value is over the fixed topology control, and over the random topology control.
At each cut-off, we also looked at a global property of the networks generated from noise data. We calculated the degree distribution of the networks, which is the distribution of the number of edges per node. We show the degree distribution at the giant component transition in Fig. 2. The giant component transition occurs at the cut-off (0.69) at which the size of the largest connected cluster is half the total number of nodes.
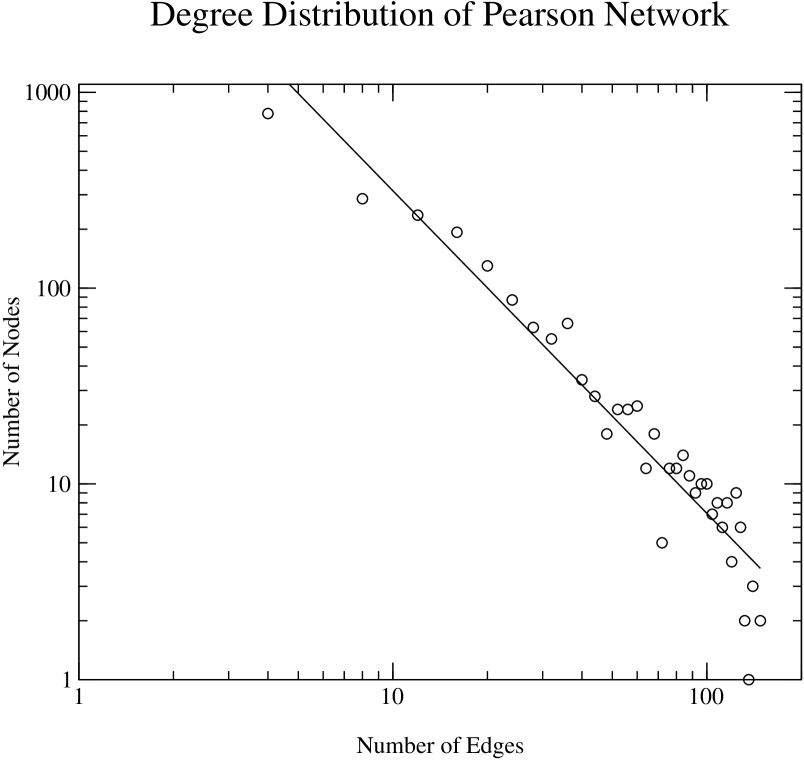
What is observed is a striking power-law. In a variety of other types of networks, power-laws are thought to reflect highly non-random assignment of links albert_barabasi . Such degree distributions have been identified previously in microarray-based gene clusterizations, but have been restricted to the context of examining large-scale time-series changes in expression due to some drastic change in the cell’s overall state (e.g. diauxic shift or cell-division cycling) bhan_dewey ; bergmann_barkai . In contrast, we observe here that power-law behavior is visible in the mere fluctuations in expression across identically prepared cell samples.
The above analyses illustrate that the seeming randomness of mRNA expression fluctuations belies the presence of highly structured, biologically significant patterns in the correlations of these fluctuations. In what follows, we propose a model which incorporates both deterministic and stochastic aspects into an explanation of why these patterns might emerge. Our goal is not to derive this model from any set of established, underlying equations known to govern biological systems. Rather, our purpose is to keep the model as simple and analytically tractable as possible, and to let the question of its validity in describing gene networks be decided based on its empirical success or failure in the laboratory.
II The Model
We seek to model the stochastic dynamics of gene expression. A natural starting point for this undertaking would seem to be the description of expression in a single cell. This would certainly be the most sensible approach if it were our intention to test our model using data measured on a single-cell basis. However, many high-throughput gene expression assays (such as mRNA microarray experiments) are carried out on samples containing populations of cells. Within these populations, it is certainly reasonable to expect a priori that there might be correlations in the noise experienced from one cell to another. Thus, in order to be as general as possible, we begin by assuming that we must describe some population of cells as a single, irreducible system, although this does not rule out the possibility that the same simple model of gene expression might also be applied gainfully to the study of single cells.
We begin by postulating, for the time being, that the total levels of all types of mRNA throughout the cell population fully characterize the state space of the system. This is obviously a gross over-simplification of real gene expression dynamics; a gene’s activity can be regulated post-transcriptionally through processes as diverse as alternative splicing, RNA interference, phosphorylation, and proteolysis. Furthermore, an mRNA’s region of localization can in many cases be at least as important to its impact as the amount of it that is transcribed, particular if it is found in some cells in the population, but not in others ghaemmaghami_weissman ; huh_oshea !
Nevertheless, since our aim is to develop the simplest possible model of gene expression that will grant us some predictive power, we proceed with our assumption despite these valid criticisms.
Our next assumption is that, in the absence of noise, the expression levels (total mRNA levels) in the population of cells would reach a stable, steady-state profile. From a biological perspective, such a premise may at first seem totally indefensible: a cell often passes through successive, cycling stages of growth during which aspects of its expression profile must change dramatically. However, we may wish to restrict our discussion for the moment to the modeling of growth-arrested cells which, for the most part, lack cycling degrees of freedom. Furthermore, since we are modeling the expression dynamics for a population of cells, it may be the case that individual members of this population are at differents points in the cell cycle, but that a steady state has been achieved, on average, for the population as a whole.
We also require, still in the absence of noise, that the rate at which the expression level of one gene changes at a given time is some analytic function of the current expression levels of all genes in the system. Though it is reasonable to think that such a view of gene expression is at least approximately valid for describing a network of genes affecting each other’s rate of production, it is also entirely possible that it is factually incorrect. Current changes in expression may, for example, depend in a discontinuous fashion on whether certain levels are above or below some threshold vilar_leibler ; hasty_collins , or else they may depend more strongly on the expression profile at some finite time in the past than on the current profile. The sensibility of this analyticity requirement can only be judged by how accurate the quantitative predictions of the model prove to be in the laboratory.
Finally, we assume that the rate of expression of each gene is subject to random noise which is uncorrelated from gene to gene. Rather than attempting to tie this noise directly to any particular source, we leave its origin deliberately vague. Our aim is solely to introduce a stochastic aspect to the dynamics of our simple phenomenological model, without attempting to explain things in terms of underlying biological mechanisms.
The next step is to formalize the simple model that is implicit in these assumptions.
In a system of genes, let the element in the vector describe the deviation of the expression level of gene from its steady-state level. In this case, we have
| (2) |
where the steady-state condition is expressed as . If we define
| (3) |
then, for small deviations from the steady-state in the absence of noise, we obtain
| (4) |
Demanding that the steady-state (SS) be stable is clearly equivalent to requiring the real parts of all eigenvalues of to be positive so that all trajectories eventually decay to the SS.
Thus far, our model has followed the same course of previous theoretical work on linear response experiments in gene networks collins_gardner . At this point, however, we move in a new direction by introducing noise to the system, which can be achieved by simply adding a randomly distributed quantity to the right hand side of Eq. 4:
| (5) |
The above -dimensional first order heterogeneous equation was first investigated by Ornstein and Zernicke ornstein_zernike as a class of Langevin models. Here we reinterpret it to be the equation of motion for gene expression dynamics. In another work, a Langevin model has been used in the single gene context to explore dynamics of transcription and translation ozbudak_vanoudenaarden . However, our work is contrasted by the fact that we are specifically interested in a many-gene network and the effects of noise on this network.
The simplest, non-trivial type of noise our system can experience is so-called uncorrelated white noise, which is defined through the following:
| (6) | |||||
| (7) |
The matrix is the identity matrix. is some fictitious parameter that governs the global noise strength. Here the average is an ensemble average over all possible noise trajectories of the system.
Implicit in the noise distribution described above is the assumption that the magnitude of noise experienced by each gene is the same. More generally, it is possible that the noise correlation is fixed by some general diagonal matrix, . Thus, when comparing the predictions of the model to experiment, it might be necessary to treat the different elements of as free, unknown parameters. The differences in the magnitude of noise may have a simple biological underpinning. For example, large relative fluctuations can arise from low expression levels. For this study, however, we consider the analytically simpler case of uniform noise magnitude.
The formal solution to the equation of motion is given by
| (8) |
The solution is a functional that depends on the noise trajectory . Since any one specific realization of the noise is uninteresting, we would like to know the statistical behavior of the system over all possible realizations. In other words, we would like to obtain the propagator of the system, which gives the probability that the cell population attains a state , given that it began in some initial state at time zero.
The propagator of Eq. 8 is given by averaging a -function of over all possible time trajectories of noise .
| (9) | |||||
| (10) |
Substituting Eq. 8 into Eq. 9 and performing the Gaussian path integral in Eq. 10 yields the propagator.
| (11) |
The propagator is complicated by the argument of the exponential. The matrix of the argument is only expressible in terms of an integral and is not easily simplifiable except for special cases of .
| (12) |
For finite time, the inverse of the matrix gives the equal time correlators of the system.
| (13) |
While time-dependent pheneomena are very interesting, the experimental measurement of noise-averaged, time-dependent quantities is likely to be a technically challenging task. We therefore focus our attention for the present on the simpler case of taking repeated, uncorrelated expression measurements from identically prepared cell samples. This is equivalent to probing the system in its equilibrium limit, when traces of the initial conditions are lost. This condition can be realized by taking the infinite-time limit of Eq. 11 and 12.
| (14) | |||||
| (15) |
Thus, we obtain an expression relating the covariance of fluctuations in expression measurements to the underlying matrix of interactions between the different genes in the network:
| (16) |
III Results and Discussion
Eq. 16 is striking because it describes an exact relationship that must exist between the rate constants of a deterministic gene network near a steady-state and the expression fluctuations that will result if such a system is driven by random noise (). Interestingly, the relationship implied by our model provides us with a means to understand how biological information contained in the underlying interactions between genes () can be preserved to some extent in the covariance matrix () that we examined in Fig. 1. For the sake of being most illustrative, let us assume for the moment that is a symmetric matrix that can be expressed as the difference of the identity matrix and a symmetric off-diagonal matrix , all of whose eigenvalues are less than unity in magnitude. In this special case, Eq.16 can be simplified, yielding the simple result
| (17) |
In other words, the covariance of fluctuations in genes and is obtained by summing over all of the ways in which the two genes are indirectly coupled to each other across the network of interactions. Eq. 17 indicates that whatever biologically meaningful structure might originally be represented in , it is likely to be preserved, and possibly even reinforced, in the subsequent correlation fluctuations described in , since it is likely that genes of similar function will be more highly connected to each other through indirect routes across the network.
Even more significant than the qualitative result discussed above, however, is the rigorously testable quantitative prediction that is also implicit in Eq.16. Obviously, it is possible to measure . If we were also able to determine all of the linear rate constants contained in the matrix by some independent means, then we would be able to calculate using the model and then compare the predicted covariances to the experimentally measured ones.
A straight-forward method of determining has already been proposed and implemented on a small scale collins_gardner . The matrix elements of can be calculated by measuring the linear response of the system’s steady state to a small, constant, exogenous increase in the rate of production of some gene in the network. More formally, this amounts to introducing a “source term” into (5):
| (18) |
which gives
| (19) |
By measuring the SS shift of every gene in response to a source pointing in the “direction” of the gene, we obtain one column of the inverse of :
| (20) |
It should be possible to introduce such a source experimentally in a number of ways, such as by insertion of an inducible plasmid in S. cerevisiae, or by effecting low, quantitative levels of RNAi in Drosophila cell culture. The validation of the model’s equilibrium predictions using such experimental approaches would have remarkable implications for our understanding of the dynamics of these systems over shorter times scales.
Another intriguing possibility is that one might use experimental measurements of in order to extract information about the linear response coefficients . In the special case examined above, we were able to derive a closed-form expression for in terms of . In the more general and realistic case of a non-symmetric , however, the noise erases some of the information we need in order to completely reconstruct from .
To see this most clearly, it is helpful to consider the cases where either the symmetric or anti-symmetric part of is small. In either instance, we can then Fourier transform our expression for and obtain the approximate result
| (21) |
If we think of as the an -dimensional analog of a complex number, then we can see that while it is possible to recover the “magnitude” of using , the noise has caused us to lose information about the “phase”. Put another way, if we were able to find one matrix which satisfied (21), we could generate another by applying any -dimensional rotation to the rows of
It is conceivable that a well-designed set of experiments might provide us with the complementary information necessary to recover from . This raises the exciting possibility that the dynamical coefficients of large gene networks might be obtainable without the need for conducting large numbers of painstaking linear response measurements. Alternatively, it may be fruitful to follow the example of Gardner et. al. collins_gardner and make simplifying assumptions about the underlying structure of which would make its construction from into an overdetermined problem.
One point that remains to be addressed is the issue of sampling. In any statistical system with multiple variates, the covariance matrix obtained from a finite sampling of the distribution is singular, and therefore not invertible, at least until the sample size exceeds the number of variates. This immediately implies that good sampling can only be achieved with microarrays for relatively small networks because of the costliness of the technology.
This stumbling block might be avoided, however, if we were to use protein as our proxy for gene expression instead of mRNA (This substitution is a perfectly acceptable one as far as the model is concerned, since it was constructed to be a rough, general model of gene expression). In this case, it would be possible to prepare cell lines with pairs of proteins labeled with different fluorescent reporters huh_oshea . Through the use of FACS methods, one could therefore measure the expression covariance of genes using thousands of independent samples.
Finally, it should be noted that, though we have focused on a linear network model here, the theoretical methods we have employed here can be easily generalized to incorporate non-linear effects. Using a related path integral technique, it should be possible to perturbatively account for higher-order couplings between different genes in the network, as well as more sophisticated noise distributions. Such an undertaking, however, would be much more involved, and should almost certainly be postponed until the limitations of the linear model are probed in experiment.
In this study, we presented evidence for the presence of ample amounts of biological information in the expression fluctuations of unperturbed genetic networks, and we introduced a dynamical model of gene expression that seeks to explain the informational content of these fluctuations. We believe our model to be the first to incorporate the intrinsic noisiness of gene expression into an exactly solvable dynamical description of the web of genetic interactions that exists in a cell. We used the model to derive a non-trivial prediction about the relationship between the dynamical linear response coefficients of the network near a steady-state and the correlations which must exist among steady-state fluctuations in the expression of different genes over time. Given enough experimental data, it is not inconceivable that at some future time, researchers will be able to model genetic networks exactly with detailed simulations on powerful computers. The spirit of this work lies at the other end of the spectrum; we are hopeful that the simple, coarse-grained model presented here incorporates enough of the salient features of genetic networks that it may provide some analytical insight into their fundamental nature in addition to being a useful tool for predicting their behavior.
We thank Boris Shakhnovich for useful discussions. We also thank Siraj Ali and Saeed Tavazoie for pointing us in the direction of the Hughes et al. data set. This work was supported by the National Institutes of Health.
References
- (1) Wen, X., Fuhrman, S., Michaels, G. S., Carr, D. B., Smith, S., Barker, J. L. & Somogyi, R., (1998) Proc. Natl. Acad. Sci. 95, 334-339.
- (2) Schena, M., Shalon, D., Davis, R. & Brown, P. O., (1995) Science 270, 467-470.
- (3) van’t Veer, L. J., Dai, H., van de Vijver, M. J., He, Y. D., Hart, A. A. M., Mao, M., Peterse, H. L., van der Kooy, K., Marton, M. J., Witteveen, A. T., Schreiber, G. J., Kerkhoven, R. M., Roberts, C., Linsley, P. S., Bernards, R. & Friend, S. H., (2002) Nature 415, 530-536.
- (4) Alizadeh, A. A., Eisen, M. B., Davis, R. E., Ma, C., Lossos, I. S., Rosenwald, A., Boldrick, J. C., Sabet, H, Tran, T., Yu, X., Powell, J. I., Yang, L., Marti, G. E., Moore, T., Hudson Jr, J., Lu, L., Lewis, D. B., Tibshirani, R., Sherlock, G., Chan, W. C., Greiner, T. C., Weisenburger, D. D., Armitage, J. O., Warnke, R., Levy, R., Wilson, W., Grever, M. R., Byrd, J. C., Botstein, D., Brown, P. O. & Staudt, L. M., (2000) Nature 403, 503-511.
- (5) Arava, Y., Wang, Y., Storey, J. D., Liu, C. L., Brown, P. O. & Herschlag, D., (2003) Proc. Natl. Acad. Sci. 100, 3889-3894.
- (6) Laub, M. T., McAdams, H. H., Feldblyum, T., Fraser, C. M. & Shapiro, L., (2000) Science 290, 2144-2148.
- (7) Spellman, P. T., Sherlock, G., Zhang, M. Q., Iyer, V. R., Anders, K., Eisen, M. B., Brown, P. O., Botstein, D. & Futcher, B., (1998) Mol. Biol. Cell. 9, 3273-3297.
- (8) Hughes, T. R., Marton, M. J., Jones, A. R., Roberts, C. J., Stoughton, R., Armour, C. D., Bennet, H. A., Coffey, E., Dai, H., He, Y. D., Kidd, M. J., King, A. M., Meyer, M. R., Slade, D., Lum, P. Y., Stepaniants, S. B., Shoemaker, D. D., Gachotte, D., Chakraburtty K., Simon, J., Bard, M. & Friend, S. H., (2000) Cell 102, 109-126.
- (9) Thattai, M. & van Oudenaarden, A., (2001) Proc. Natl. Acad. Sci. 98, 8614-8619.
- (10) Hasty, J., Pradines, J., Dolnik, M. & Collins, J. J., (2000) Proc. Natl. Acad. Sci. 97, 2075-2080.
- (11) Elowitz, M. B., Levine, A. J., Siggia, E. D. & Swain, P. S., (2002) Science 297, 1183-1186.
- (12) Gardner, T. S., di Bernardo, D., Lorenz, D. & Collins, J. J., (2003) Science 301, 102-105.
- (13) Kauffman, S., Peterson, C., Samuelsson, B. & Troein, C., (2003) Proc. Natl. Acad. Sci. 100, 14796-14799.
- (14) http://mips.gsf.de/genre/proj/yeast/
- (15) Albert, R. & Barabasi, A-L., (2002) Rev. Mod. Phys. 74, 47-97.
- (16) Bhan, A., Galas, D. J. & Dewey, T. G., (2002) Bioinformatics 18, 1486-1493.
- (17) Bergmann, S., Ihmels, J. & Barkai, N., (2004) PLoS Biology 2, 0085-0093.
- (18) Ghaemmaghami, S., Huh, W., Bower, K., Howson, R. W., Belle, A., Dephoure, N., O’Shea, E. K. & Weissman, J. S., (2003) Nature 425, 737-741.
- (19) Huh, W., Falvo, J. V., Gerke, L. C., Carroll, A. S., Howson, R. W., Weissman, J. S. & O’Shea, E. K., (2003) Nature 425, 686-691
- (20) Vilar, J. M. G., Guet, C. C. & Leibler, S., (2003) J. Cell Biol. 161, 471-476.
- (21) Risken, H., (1989) The Fokker-Planck Equation: Methods of Solution and Applications, Springer Verlag, Berlin.
- (22) Ozbudak, E. M., Thattai, M., Kurtser, I. & van Oudenaarden, A., (2002) Nature Genetics 31, 69-73.