LU TP 03-40
November 13, 2003
Folding Thermodynamics of Three -Sheet Peptides: A Model Study
Anders Irbäck and Fredrik Sjunnesson***E-mail: anders, fredriks@thep.lu.se
Complex Systems Division, Department of Theoretical Physics
Lund University, Sölvegatan 14A, SE-223 62 Lund, Sweden
http://www.thep.lu.se/complex/
Submitted to Proteins
Abstract:
We study the folding thermodynamics of a -hairpin and two
three-stranded -sheet peptides using a simplified
sequence-based all-atom model, in which folding is driven
mainly by backbone hydrogen bonding and effective hydrophobic
attraction. The native populations obtained for these three
sequences are in good agreement with experimental data. We also
show that the apparent native population depends on which
observable is studied; the hydrophobicity energy and the number of native
hydrogen bonds give different results. The magnitude of this
dependence matches well with the results obtained in two
different experiments on the -hairpin.
1 Introduction
Peptide folding is currently attracting considerable attention. Recent advances in this area include the de novo design of two monomeric three-stranded antiparallel -sheet peptides, Betanova[1, 2] and Beta3s.[3] Peptides that have the ability to fold on their own and are well characterized experimentally are valuable not least as a testbed for theoretical models for protein folding. -sheet peptides are particularly interesting in this respect, as -sheet formation is more challenging to model than -helix formation. Therefore, it is no surprise that both Betanova[4, 5] and Beta3s[6] have become the subject of computational studies. Simulations of peptide sequences that are somewhat similar to these and occur in natural proteins, so-called WW domains, have been reported, too.[7] For a recent review of computational studies of peptide folding, see Granakaran et al.[8]
Here we present a study of the C-terminal -hairpin from the protein G B1 domain and a triple mutant of Betanova called LLM.[2] The original Betanova, which is less stable than the peptide LLM,[2] is considered too. These different sequences are studied using an all-atom model with a simplified interaction potential. An earlier version of this model was tested[9] on the same -hairpin and an -helix, the designed so-called F.[10, 11] The model was able to fold these two sequences and the folded population showed, in both cases, a temperature dependence comparable with experimental data. It should be pointed out that different sequences are studied using exactly the same parameters; the interaction potential is, like that of Kussell et al.[12] but unlike many other simplified potentials for protein folding, entirely sequence-based. This is of importance even if only one sequence is studied, because it ensures that the formation and breaking of non-native bonds is not a neglected part of the dynamics.
2 Materials and Methods
The model we study is a revised version of an earlier model.[9] It contains all atoms of the polypeptide chain, including hydrogens, but no explicit water molecules. All bond lengths, bond angles and peptide torsion angles () are held fixed, so each amino acid has the Ramachandran torsion angles , and a number of side-chain torsion angles as its degrees of freedom (for Pro, is held fixed at ). All bond lengths and bond angles are the same as in the original model.[9]
The potential function
| (1) |
is composed of four terms. The remaining part of this section describes these different terms, with emphasis on what is new compared with the earlier model. Energy parameters are quoted in dimensionless units. To set the energy scale of the model, we use the midpoint temperature for the -hairpin as determined by Muñoz et al.,[13] K, which corresponds to in the model.
The first term in Eq. 1, , represents excluded-volume effects and has the form
| (2) |
where and , 1.75, 1.55, 1.42 and 1.00 Å for S, C, N, O and H atoms, respectively. The role of the parameter is to reduce the repulsion between non-local pairs; for all pairs connected by three covalent bonds and otherwise. The reason for using for non-local pairs is partly computational efficiency, and partly the restricted flexibility of chains with only torsional degrees of freedom. To speed up the calculations, the sum in Eq. 2 is evaluated using a cutoff of Å.
The second interaction term, , is new compared with the earlier model. By introducing this term and modifying for C and N, we slightly adjusted the shape of the Ramachandran , distribution. is a local electrostatic energy given by
| (3) |
where the outer sum runs over all non-Pro amino acids along the chain, and the inner sum represents the interaction between the partial charges of the backbone NH and C′O groups within one amino acid (the sum has four terms: NC′, NO, HC′ and HO). The partial charges are for H and N and for C′ and O.[14] We put , which corresponds to a dielectric constant of if . The factor reduces the interaction strength for the two end amino acids and Gly, which can be viewed as a simple form of context dependence; for end amino acids, for Gly, and otherwise. A similar factor is used for (see below).
The third term in Eq. 1, , is an effective attraction between hydrophobic side chains that are not nearest or next-nearest neighbors along the chain. It has the pairwise additive form
| (4) |
where is a measure of the degree of contact between side chains and , and sets the energy that a pair in contact gets. The contact measure is a number between 0 and 1, defined as before.[9] The interaction matrix is given in Table I and differs from that used in our earlier study, which was based on the Miyazawa-Jernigan contact energies.[15] With an all-atom representation, this cannot be expected to be a good choice for more general sequences, since the Miyazawa-Jernigan contact energies were derived using a different, reduced chain representation.[15] The new matrix has a simplified structure in that the hydrophobic amino acids are grouped into three classes (see Table I). The values are taken to be large for the aromatic class (Phe, Trp, Tyr), which in part is an attempt to compensate for the fact that it is relatively difficult for these large side chains with few degrees of freedom to make proper contacts.
| I | II | III | ||
|---|---|---|---|---|
| I | Ala | 0.0 | 0.1 | 0.1 |
| II | Ile, Leu, Met, Val | 0.9 | 2.8 | |
| III | Phe, Trp, Tyr | 3.2 |
The last term of the potential, the hydrogen-bond energy , is given by
| (5) |
where the two terms represent backbone-backbone interactions and interactions between the backbone and charged side chains, respectively. The second term in Eq. 5 does not include any side chain-side chain interactions, as it did in our earlier study. Apart from that, the only difference compared with the earlier model is the factor , which like in Eq. 3 can be seen as a simple form of context dependence. We put if any of the two amino acids involved is an end amino acid, if any of them is a Gly, and otherwise. The constants and as well as the functions and are exactly the same as before.[9]
To study the thermodynamic behavior of this model, we use simulated tempering,[16, 17] in which the temperature is a dynamical variable. Details on our implementation of this method can be found elsewhere.[18] For a review of simulated tempering and other generalized-ensemble techniques for protein folding, see Hansmann and Okamoto.[19] Eight different temperatures are studied, ranging from 284 K to 371 K. For the backbone degrees of freedom, we use three different elementary moves: first, the pivot move[20] in which a single torsion angle is turned; second, a semi-local method[21] that works with up to eight adjacent torsion angles, which are turned in a coordinated way; and third, a symmetry-based update of three randomly chosen backbone torsion angles.[9] For the side-chain degrees of freedom, we use simple Metropolis updates of individual angles.
For each peptide, eight independent Monte Carlo runs were performed, starting from random conformations. Each run required a few days on a standard desktop computer, and contained several folding/unfolding events. The similarity between the results from the different runs strongly suggest that the simulations did map out all relevant free-energy minima of the model. All statistical errors quoted are 1 errors obtained from the variance between the runs. The fits of data discussed in the next section were carried out by using a Levenberg-Marquardt procedure.[22]
For a given protein structure, there generally exist alternative structures with similar secondary-structure content but different overall topologies. This holds true even for a small -hairpin, for which a flip of the side chains gives rise to a topologically distinct structure. To make models discriminate between different topologies is a delicate task. To assess whether or not a model is able to do that, it is necessary to make a suitable choice of observables. In our calculations, we monitor two variables that can be used for this purpose: first, the root-mean-square deviation (rmsd) from the folded structure, , calculated over all non-H atoms (a backbone rmsd is much less informative); and second, the number of native backbone-backbone hydrogen bonds, . Figure 1 illustrates which hydrogen bonds we take to be present in the native states of the peptides studied.


In our calculations, a hydrogen bond is considered formed if the energy is less than (see Eq. 5).
Using the original model, we studied the -helical F peptide and a -hairpin.[9] Here, we study the same -hairpin and two three-stranded -sheet peptides, LLM and Betanova. Before turning to these results, it should be pointed out that the F sequence still makes an -helix in the revised model, as can be seen from the free energy in Fig. 2. has a pronounced, dominating minimum at –3.5 Å, which corresponds to -helix. In addition, there are weakly populated minima corresponding to -sheet structures at Å and Å.
3 Results and Discussion
3.1 -Hairpin
Using the model described in the previous section, we first study the 16-amino acid C-terminal -hairpin from the protein G B1 domain. An important quantity monitored in our earlier study of this peptide[9] was the hydrophobicity energy . This variable should be strongly correlated with Trp fluorescence, which Muñoz et al. [13] used to characterize the melting behavior of this peptide. The temperature dependence of was found to be in reasonable agreement with the data of Muñoz et al. Several other groups have performed atomic simulations of the same -hairpin, with[24, 25, 26, 27, 28] or without[12, 28, 29, 30] explicit water. In contrast to ours, most models seem to require further calibration in order not to show a temperature dependence much weaker than that of experimental data.
Figure 3a shows the temperature dependence of in the revised model.


The line is a fit of the data to a simple (first-order) two-state expression. The parameters of the fit are the midpoint temperature , the energy difference , and two baselines. We use the parameter to set the energy scale of the model; this parameter is taken as K as determined by Muñoz et al.[13] For the energy difference, we then obtain kcal/mol. These values of the two-state parameters and correspond to a native population of 74% at K, which agrees well with the result of Muñoz et al., 72% at K.[13] The NMR analysis of Blanco et al.[23] gave, by contrast, a lower native population, 42% at K. A possible explanation of this discrepancy would be that this peptide does not show a clear two-state behavior; the apparent native population may then very well depend on which quantity is studied. At first glance, this explanation may seem unlikely, given that the temperature dependence of the Trp fluorescence data to a good approximation showed two-state character.[13] Let us therefore stress that, despite that the two-state fit in Fig. 3a looks quite good, this sequence does not show ideal two-state behavior in our model. This can be seen, for example, from the energy distribution, which lacks a clear bimodal shape. This was shown in our earlier study,[9] and holds true in the revised model as well. Similar results have also been obtained in simulations of a designed, fast-folding three-helix-bundle protein.[31]
In Fig. 3b we show the temperature dependence of the number of native hydrogen bonds, , which we expect to be more strongly correlated than with the NMR measurements of Blanco et al. For , a two-state fit is not meaningful; for that, further data at lower temperatures would be needed. On the other hand, the quantity can be used as a direct measure of nativeness. Based on inspection of many examples, we use as a criterion for nativeness that at most two of the native hydrogen bonds should be missing, which can be used for the two other peptides too (see below). For the -hairpin with seven native hydrogen bonds (see Fig. 1a), this criterion () gives a native population of 39% at K. This value is close to the estimate of Blanco et al.,[23] 42% at K. Due to uncertainties about the precise definitions of nativeness and of when a hydrogen bond is formed, this agreement could be somewhat accidental. There is no doubt, however, that the native population obtained using is significantly lower than that obtained above using . Figure 4 shows the probability distributions of at K and K. The number of native hydrogen bonds is seen to rapidly decrease with increasing , as it should.

The two-state parameter extracted from the data is somewhat smaller here, kcal/mol, than it was in our earlier study, kcal/mol.[9] The reason for this is not so much that the model has changed, but rather that the fits were done in different ways. In our previous study, was held fixed at the specific heat maximum. Here, following the analysis of Muñoz et al. more closely, we take to be a parameter of the fit. The fitted value of turns out to lie slightly below (1–2%) the specific heat maximum. Our new analysis improves the agreement with the result of Muñoz et al., which was kcal/mol.[13]
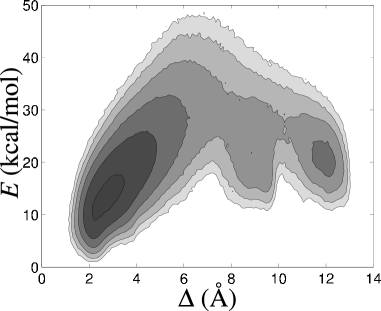
Although the precise shape of the structures with lowest energy is sensitive to the details of the model, it is also interesting to make an rmsd-based comparison with experimental data. For this purpose, we use the NMR structure for the full protein G B1 domain (PDB code 1GB1, first model),[32] as the NMR restraints for the isolated -hairpin were insufficient to determine a unique structure. Figure 5a shows the free energy calculated as a function of rmsd, , and energy, , at K.
Three distinct, highly populated minima can be seen. The two minima with lowest are found at Å and Å, respectively. Both these correspond to -hairpin structures with a high . That is high implies, in particular, that the topology of the -hairpin is the native one. The main difference between these two minima lies in the shape of the turn. The third minimum, at Å, is somewhat higher in than the first two. This minimum is also dominated by -hairpin structures with the native topology and many hydrogen bonds, but the two strands tend to be out of register with each other, so is low. Largely, it is the existence of this third minimum that makes the apparent native population depend on which of the observables and we use. Finally, there are also two weakly populated free-energy minima corresponding to -sheet structures with the non-native topology ( Å) and -helix (–10 Å), respectively.
3.2 Three-Stranded -Sheets
The de novo design of the 20-amino acid three-stranded antiparallel -sheet peptide Betanova was reported in 1998.[1] Recently, mutants of this peptide with higher stability were created by López de la Paz et al.[2] Among the most stable mutants found was the triple mutant LLM (Val5Leu, Asn12Leu, Thr17Met). The peptide LLM and the original Betanova were estimated[2] to have native populations of 36% and 9%, respectively, at K, based on NMR data. Melting curves have, as far as we know, not been reported for these peptides.
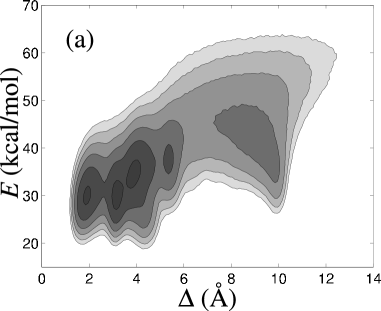
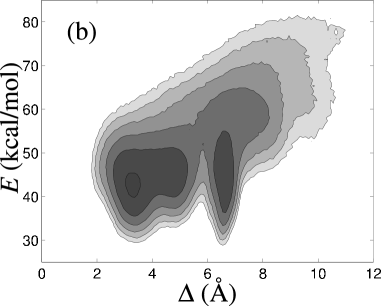
Our simulations of LLM show first of all that this sequence does make a three-stranded antiparallel -sheet in this model. This can be seen from Fig. 5b, which shows the free energy at K. The free energy has a broad minimum at –5 Å, corresponding to -sheet structures with the native topology and a high . The shape of the -sheet varies within the minimum. At Å, where the free energy is lowest, the -sheet has a bent shape, which enables the chain to make strong hydrophobic contacts. At Å, the -sheet tends to be much flatter, which is hydrophobically disfavored but makes it possible for the chain to form more perfect hydrogen bonds. There is also a free-energy minimum at Å, which corresponds to three-stranded antiparallel -sheet structures with the non-native topology. However, the native topology is the thermodynamically favored one. Note that the native and non-native topologies exhibit non-overlapping sets of backbone-backbone hydrogen bonds, so is low at the Å minimum.
The main reason why the model favors the native topology over the non-native one lies in the side-chain orientations for the hydrophobic pairs Trp3-Leu12 and Leu5-Tyr10. The Cα-Cβ vectors of these pairs point inwards in the non-native topology, which makes it difficult to achieve proper contacts between the side chains. This is much easier to accomplish in the native topology, where the Cα-Cβ vectors point outwards. Interestingly, the situation is similar for the -hairpin above.[9] The -hairpin also has two pairs of hydrophobic side chains that are ‘bow-legged’ in the native topology and ‘knock-kneed’ in the non-native one.
Next we estimate the native population for LLM. As we want to compare with the NMR-based results of López de la Paz et al., we consider rather than . Figure 6a shows the distribution at K. In addition to the native and non-native peaks at high and low , respectively, this distribution exhibits a third peak at . The typical conformation at this peak contains only the first of the two native -turns (see Fig. 1b). The second -turn is less stable, as will be discussed below. Using the criterion that at most two native hydrogen bonds should be missing (), we obtain a native population of 38% at K for LLM, which agrees well with the result of López de la Paz et al.,[2] 36% at K. We also performed simulations of the original Betanova, and Fig. 6a shows the result for this sequence too. From this figure it is evident that Betanova is less stable than LLM. The probability that is 14% for Betanova at K, which means that this criterion gives a native population close to the NMR-based result of López de la Paz et al. [2] not only for LLM but also for Betanova.


That the model predicts LLM to be more stable than Betanova is not surprising because LLM has a more pronounced hydrophobic core. The agreement with experimental data is, nevertheless, remarkably good, especially since these calculations do not involve any adjustable parameter; the energy scale of the model is fixed using melting data for the -hairpin and is then left unchanged.
Figure 6b shows the frequencies of occurrence for the different native hydrogen bonds (see Fig. 1b) for LLM and Betanova. For Betanova, there is a clear difference between the hydrogen bonds involved in the first -turn (1–4) and those involved in the second -turn (5–8). The latter four occur infrequently, showing that the second -turn is quite unstable, which is in line with the conclusions of López de la Paz et al.[2] For LLM, the difference in stability between the two -turns is less pronounced. However, hydrogen bond 7, which connects Met17 to Tyr10 (see Fig. 1b), is quite unstable. The reason for this is that the side chain of Met17 can make better contacts with other hydrophobic side chains if the strand is slightly bent. This bend makes it difficult for hydrogen bond 7 to form.
Finally, in Fig. 7 we show the temperature dependence of and for LLM. As in the -hairpin case, we find that a simple two-state fit provides a good description of the data for . The fitted values of the parameters and are K and kcal/mol, which means that the native population obtained from this fit is significantly higher than that obtained from the distribution (see Fig. 6a). So, the model predicts that the apparent native population depends on which observable is used for this sequence, too. We are not aware of any existing experimental data that support, or refute, this conclusion for LLM.


4 Conclusion
Using a novel all-atom model with a simplified sequence-based potential, we have investigated the equilibrium behaviors of three -sheet peptides. We determined native populations for these peptides in two ways, from the distribution of the number of native hydrogen bonds () and from the temperature dependence of the hydrophobicity energy (). These two estimates were compared with experimental results based on NMR and Trp fluorescence, respectively. This comparison is summarized in Table II. The agreement with experimental data is good, which in particular means that the model to a good approximation is able to reproduce the relative stabilities of these three peptides, as obtained from the NMR measurements. In line with the experimental results on the -hairpin, we find that the apparent native population depends on whether we use or . This reflects the fact that the melting transition is not a clear two-state transition in our model (for any of these three sequences). It is also worth noting that, despite that the two-state picture is an oversimplification, the temperature dependence of is quite well described by a simple two-state expression (see Figs. 3a and 7a). Computational studies of the -hairpin have also been performed by many other groups, but the temperature dependence obtained was typically too weak, as has been pointed out by Zhou et al. [27] Our model shows a temperature dependence which is in good agreement with experimental data.
| Model, 284 K | Experiment | ||||
|---|---|---|---|---|---|
| NMR | Trp fluorescence | ||||
| -hairpin | 39% | 74% | 42%, 278 K [23] | 72%, 284 K [13] | |
| LLM | 38% | 36%, 283 K [2] | |||
| Betanova | 14% | 9%, 283 K [2] | |||
Our study of these three different peptides was carried out using one and the same set of parameters. In addition, we showed that the F peptide makes an -helix for this choice of parameters. While these results are very encouraging, it is important to stress that we do not expect the model to be directly applicable to other sequences. However, by confronting the model with new sequences, we hope it will be possible to refine the potential, and thereby further extend its applicability. The present study was a first step in this direction, in which the model was improved by studying LLM and Betanova. To make the model able to fold these sequences, many changes were made, several of which were minor. The two perhaps most important changes were the replacement of the old hydrophobicity matrix (), and the introduction of a simple form of context dependence for the hydrogen bonds. Whether it will be possible to carry on this process to a point where the model correctly reproduces the thermodynamics of small proteins remains to be seen. One thing that probably will be necessary in order to achieve this goal is to include multibody effects in the hydrophobicity potential; the present pairwise additive potential is likely to become insufficient as the chains get larger. Computationally, there is room for extending the calculations to larger chains; the calculations presented here required about two weeks on a standard desktop computer for each peptide.
Acknowledgments: We thank Luis Serrano and Manuela López de la Paz for providing NMR data for LLM and Betanova. This work was in part supported by the Swedish Foundation for Strategic Research and the Swedish Research Council.
References
- [1] Kortemme T, Ramírez-Alvarado M, Serrano L. Design of a 20-amino acid, three-stranded -sheet protein. Science 1998; 281: 253–256.
- [2] López de la Paz M, Lacroix E, Ramírez-Alvarado M, Serrano L. Computer-aided design of -sheet peptides. J. Mol. Biol. 2001; 312: 229–246.
- [3] de Alba E, Santaro J, Rico M, Jiménez MA. De novo design of a monomeric three-stranded antiparallel -sheet. Protein Sci. 1999; 8: 854–865.
- [4] Bursulaya BD, Brooks CL III. Folding free energy surface of a three-stranded -sheet protein. J. Am. Chem. Soc. 1999; 121: 9947–9951.
- [5] Colombo C, Roccatano D, Mark AE. Folding and stability of the three-stranded -sheet peptide betanova: Insights from molecular dynamics simulations. Proteins 2002; 46: 380–392.
- [6] Cavalli A, Haberthür U, Paci E, Caflisch A. Fast protein folding on downhill energy landscape. Protein Sci. 2003; 12: 1801–1803.
- [7] Karanicolas J, Brooks CL III. The structural basis for biphasic kinetics in the folding of the WW domain from a formin-binding protein: Lessons for protein design? Proc. Natl. Acad. Sci. USA 2003; 100: 3954–3959.
- [8] Granakaran S, Nymeyer H, Portman J, Sanbonmatsu KY, García AE. Peptide folding simulations. Curr. Opin. Struct. Biol. 2003; 13: 168–174.
- [9] Irbäck A, Samuelsson B, Sjunnesson F, Wallin S. Thermodynamics of - and -structure formation in proteins. Biophys. J. 2003; 85: 1466–1473.
- [10] Lockhart DJ, Kim PS. Internal Stark effect measurement of the electric field at the amino terminus of an helix. Science 1992; 257: 947–951.
- [11] Lockhart DJ, Kim PS. Electrostatic screening of charge and dipole interactions with the helix backbone. Science 1993; 260: 198–202.
- [12] Kussell E, Shimada J, Shakhnovich EI. A structure-based method for derivation of all-atom potentials for protein folding. Proc. Natl. Acad. Sci. USA 2002; 99 :5343–5348.
- [13] Muñoz V, Thompson PA, Hofrichter J, Eaton WA. Folding dynamics and mechanism of -hairpin formation. Nature 1997; 390: 196–199.
- [14] Branden C, Tooze J. Introduction to Protein Structure. New York: Garland Publishing; 1991.
- [15] Miyazawa S, Jernigan RL. Residue-residue potentials with a favorable contact pair term and an unfavorable high packing density, for simulation and threading. J. Mol. Biol. 1996; 256: 623–644.
- [16] Lyubartsev AP, Martsinovski AA, Shevkunov SV, Vorontsov-Velyaminov PN. New approach to Monte Carlo calculation of the free energy: Method of expanded ensembles. J. Chem. Phys. 1992; 96: 1776–1783.
- [17] Marinari E, Parisi G. Simulated tempering: A new Monte Carlo scheme. Europhys. Lett. 1992; 19: 451–458.
- [18] Irbäck A, Potthast F. Studies of an off-lattice model for protein folding: Sequence dependence and improved sampling at finite temperature. J. Chem. Phys. 1995; 103: 10298–10305.
- [19] Hansmann UHE, Okamoto Y. New Monte Carlo algorithms for protein folding. Curr. Opin. Struct. Biol. 1999; 9: 177–183.
- [20] Lal M. Monte Carlo computer simulation of chain molecules. I. Mol. Phys. 1969; 17: 57–64.
- [21] Favrin G, Irbäck A, Sjunnesson F. Monte Carlo update for chain molecules: Biased Gaussian steps in torsional space. J. Chem. Phys. 2001; 114: 8154–8158.
- [22] Press WH, Flannery BP, Teukolsky SA, Vetterling WT. Numerical Recipes in C: The Art of Scientific Computing. Cambridge: Cambridge University Press; 1992.
- [23] Blanco FJ, Rivas G, Serrano L. A short linear peptide that folds into a native stable -hairpin in aqueous solution. Nat. Struct. Biol. 1994; 1: 584–590.
- [24] Roccatano D, Amadei A, Di Nola A, Berendsen HJC. A molecular dynamics study of the 41–56 -hairpin from B1 domain of protein G. Protein Sci. 1999; 8: 2130–2143.
- [25] Pande VS, Rokhsar DS. Molecular dynamics simulations of unfolding and refolding of a -hairpin fragment from protein G. Proc. Natl. Acad. Sci. USA 1999; 96: 9062–9067.
- [26] García AE, Sanbonmatsu KY. Exploring the energy landscape of a hairpin in explicit solvent. Proteins 2001; 42: 345–354.
- [27] Zhou R, Berne BJ, Germain R. The free energy landscape for hairpin folding in explicit water. Proc. Natl. Acad. Sci. USA 2001; 98: 14931–14936.
- [28] Zhou R. Free energy landscape of protein folding in water: Explicit vs. implicit solvent. Proteins 2003; 53: 148–161.
- [29] Dinner AR, Lazaridis T, Karplus M. Understanding -hairpin formation. Proc. Natl. Acad. Sci. USA 1999; 96: 9068–9073.
- [30] Zagrovic B, Sorin EJ, Pande V. -hairpin folding simulations in atomistic detail using an implicit solvent model. J. Mol. Biol. 2001; 313: 151–169.
- [31] Favrin G, Irbäck A, Samuelsson B, Wallin S. Two-state folding over a weak free-energy barrier. Biophys. J. 2003; 85: 1457–1465.
- [32] Gronenborn, AM, Filpula DR, Essig NZ, Achari A, Whitlow M, Wingfield PT, Clore GM. A novel, highly stable fold of the immunoglobulin-binding domain of streptococcal protein G. Science 1991; 253: 657–661.