ul. Przybyszewskiego 63/77, PL-54148 Wroclaw, Poland
11email: cebrat@microb.uni.wroc.pl
22institutetext: Interdisciplinary Center for Computational and Mathematical Modeling,
Warsaw University, PL-02-106 Warsaw, Poland 33institutetext: Institute for Theoretical Physics, Cologne University, D-50923 Köln, Euroland
Genetic Paralog Analysis and Simulations
Abstract
Using Monte Carlo methods, we simulated the effects of bias in generation and elimination of paralogs on the size distribution of paralog groups. It was found that the function describing the decay of the number of paralog groups with their size depends on the ratio between the probability of duplications of genes and their deletions, which corresponds to different selection pressures on the genome size. Slightly different slopes of curves describing the decay of the number of paralog groups with their size were also observed when the threshold of homology between paralogous sequences was changed.
1 Introduction
It is widely accepted that evolution is driven by two random processes - mutations and recombinations and a directional process - selection. Recombination not only re-shuffles genes inside genomes or between genomes but it is also responsible for amplification or elimination of sequences. Duplication of complete coding sequences produces additional copies of genes called paralogs. Thus, paralogous genes are homologous sequences arisen through gene duplication and parallel evolution in one genome. Paralogs can also appear by duplication of large fragments of chromosomes or even by fusion of different genomes (allopolyploidization). Before the fusion, corresponding sequences in the two genomes which had a common ancestor in the past are called orthologs [1]. Since it would be very difficult to reproduce their real history, when they appear in the genome of one organism they are recognized as paralogs. Paralogs are a source of simple redundancy of information, making the genome more stable and resistant to mutational effect by complementing the function of one copy when the other is damaged by mutation [2] or by reinforcing the function of the amplified gene. Most importantly, gene duplication generates a sequence with a defined function but released from the selection pressure. Redefinition of the duplicated gene function may ameliorate the biological potential of the individual. Taking under consideration all the profits brought by paralogs one can ask why the number of paralogs seems to be limited. First of all, a higher number of gene copies, frequently causing a higher level of products does not mean a more concerted expression of the gene function. The best example - the Down syndrome - is caused by redundant information. Second, limitation comes also from the cost of replication and translation of information, which leads to selection pressure on the genome size. The genome size is the result of compromise between the trends for accumulating information and keeping the costs of replication in the reasonable limit. Nevertheless, the level of redundancy in genetic information is high, for example in a uni-cellular eukaryote organism - Saccharomyces cerevisiae (baker’s yeast) - probably no more than 20 % of genes fulfill essential functions and stay in unique copies. The function of the rest of genes can be complemented, probably mostly by paralogous sequences [3], [4].
According to the definition, all the genes in the genome which have a common ancestor belong to one paralog family or group. However, the genome analysis does not give us direct information about the descent of sequences from the common ancestor because we can only conclude about the common progenitor on the basis of homology between compared currently ”living” sequences. The level of homology could additionally indicate the time when the two sequences have diverged. Approximately, the number of mutations which have occurred in the diverging sequences grows with time linearly, though it may depend on the topological character of the duplication itself (i.e. duplication with or without inversion)[7]. Furthermore, the fraction of positions in which the two sequences differ does not grow linearly because of multiple substitutions (substitutions which have occurred in the same position several times) and reversions whose probability grows in time. Thus, the level of homology is not an exact measure of divergence time (branching time). At large time distances the homology between two paralogs could be too low to recognise properly whether the observed homology is accidental or the compared sequences actually descend from one progenitor sequence. That is why a threshold of homology is assumed - if the homology level is below the threshold, the compared sequences are considered as independently evolved. Since the threshold is arbitrary, and differs in different analyses, it is important to find whether the size distribution of paralog families depends on the cutoff level of homology.
In all analyzed genomes the distribution of paralog families follows a specific rule. Some authors claim an exponential function [5], others a power law ruling the frequency of the occurrence of the folds or protein families [6], [8], [9]. The latter authors assumed a limited number of the initial sequences evolving into the full genome of the contemporary organism. In our simulations we have assumed that the evolution of the contemporary genomes has started with all the genes indispensable for survival of the individuals and these initial genes were independent progenitors of all paralog families. The organisation of these genes in higher hierarchy (families or folds) was neglected. We have analysed how the size distribution of paralog families depends on the selection pressure, on genome size and on the arbitrarily accepted threshold of homology deciding about the grouping of the sequences into paralog families. The selection pressure is an objective force influencing the genome evolution while the paralog identification errors are connected with our ignorance, rather. In our simulations we used two different ways for measuring the distance between paralogs: the first one was somewhat absolute because it measured the real time of duplication and the second one corresponded to the homology analysis - the Hamming distance between two sequences (bit-strings) was measured.
2 Experimental Distributions
Analysis of the first completely sequenced genome demonstrated that distributions of sizes for paralog families indicate a high level of gene duplication [10]. Initial comparison, of bacterial, archeal and eukaryotic genomes has shown that the number of sequences in protein families vs. corresponding family sizes displays power law distributions [8,11].
In contrast, Slonimski et al. [5] in an one page note, reported that for protein families of to members, the clusters of contain half the number of proteins observed in clusters of , independently of the microbial genome size. Their methodology [12], [13] used Smith-Waterman scores , the Z-significance values, and connective-clusters in which a given sequence had similarity of with one or more other sequences. The analysis have been performed on yeast and 4 microbial genomes.
Yanai et al. [9] have compared paralog distributions for 20 genomes, using BLAST and E-significance values ranging from to as large as . They report linear fits on log-log scale for all genomes, with somewhat noisy behaviour for larger families. Qian et al. [14] have linked the power law distribution of gene families in genomes, with the distribution of structural motifs and protein folds, all three displaying identical slope on log-log plots. Their analyses involved again 20 microbial genomes, and also inter-genome comparisons within analogous functional and structural families.
Unger et al. [15] compared orthologous gene distributions in three large curated databases: COG, ProtoMap, and Predom (28031, 81286 and 278584 sequences respectively), and also performed partial analysis of a human genome. They again observed a power law behaviour relating the number of sequences in structural and functional families of a given size , by , where - the slope of linear fits on log-log plots. Additionally they have linked the slopes for small families, and those for large families by , where and stand for the 50 smallest, and the 500 largest families, after ranking them by size.
Nimwegen [16] has observed power laws, comparing the number of genes in functional categories vs. total number of genes in a genome, with exponents varying both between bacterial, archeal and eukaryotic genomes, and especially between functional categories: from 0.13 for the protein synthesis in bacteria, to as high as 3.36 for the defense response in eukaryotes.
3 Current Work
The [12, 13] data of all intragenomic pairwise alignments for 61 complete genomes [18] have been used. In no case an exponential decay for a distribution of paralogous family sizes was found, independently of the cut-off threshold of the used as a similarity measure. As the depends much on the length of compared sequences [12, 13], here we use an amended similarity measure between sequences and , . For identical sequences , and it tends to zero with increasing dissimilarity.
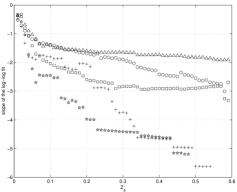
Figure 1a presents the slopes of the log-log fittings as a function of the cut-off values between 0.01 and 0.6 used, for several genomes. For , for all genomes there are only one or two huge super-clusters, and small fractions of singletons and doublets (sometimes also triplets). Clearly such a small cut-off is too low to distinguish anything of interest. For high values of , but obviously depending much on the genome size, most sequences are similar only to themselves, and there are mostly singletons, with few still remaining doublets/triplets. At the less stringent similarity cut-off there are regions of gradual change, interspersed by sharp changes in behaviour - corresponding obviously to the splitting events, when clusters are broken, and a possible relationship between homology and function within family/cluster is disrupted. Somewhere in between these two extremes there is a small region of usefulness, when the slope of the log-log fits seems to depend more or less linearly on the cut-off value. Tentatively it might be attributed to a range of 0.04 - 0.1, as for most genomes analysed, we can see a relative plateau of the log-log slope changes with increasing .
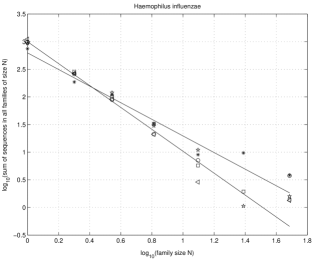
Moreover, as can be seen in Fig. 1a, any comparisons between genomes must depend to a high degree on the cut-off value of the similarity measure actually used. For example, the data of Brenner et al. [10] for would suggest the slope of the log-log plot equal –1.50, which would imply, if compared to the Fig. 1a, the in between of 0.02 and 0.04, clearly in a twilight zone before the supposedly useful region of linear dependence of the slope on . However, the last point (Fig. 2, circles) changes the slope of the fit significantly, the slope after its exclusion equals –1.98. The corresponding analysis using reveals (Fig. 2, stars , squares , triangles ) that best agreement between ref. 10 and the current work is at , and that in both cases power law approximation underestimates big-sized families (rightmost points, Fig. 2), especially at higher . Finally, the results of cut-off , used by Slonimski et al. [5], [12] (Fig. 2, pentagrams), again agree with both Brenner’s and current results.
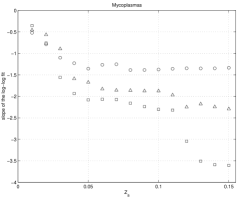
The often emphassized dependence of the fitted log-log slopes on the genome size can be observed only as a general trend, with many exceptions. Metanococcus janaschii and Haemophilus influenzae are of almost identical size of about 1700 sequences, but their behaviour is strikingly different, with H. influenzae displaying the quickest change of slopes with increasing of all genomes analysed. Also, H. influenzae large clusters are breaking down to singletons much faster (e.g. the rightmost crosses of Haemophilus in Fig. 2, correspond to the bipartite composition of vast majority of singletons, and a very small remainder of what was before one or two big families). Sulfolobus solfataricus - at approximately one tenth the genome size of Arabidopsis thaliana - shows the most shallow dependence of slopes on of all genomes under study, comparable to that of Arabidopsis. Even for the smallest genomes (Fig. 1b) of Mycoplasma genitalium (486 genes), Mycoplasma pneumoniae (687 genes), and Mycoplasma pulmonis (778 genes), Fig. 1b (squares, triangles, and circles respectively), which because of their taxonomical proximity can be compared directly relatively easy, the size dependence of the power law exponent is rather perturbed.


4 Simulations
The results of earlier modeling efforts can be found in Refs. 2,9,11,14-17,19. In our simulations we return to the problem emphasized in the Introduction, the number of paralogs for one given function or gene. Thus, in contrast to what was described in preceding sections, we assume to know for every part of the genome its function. In a simulation that is easy, since we can follow the whole evolution since the beginning; for real genomes, such knowledge in general still lies in the future. Our model is a simplification of our earlier one [2], which was shown [19] to give reasonable ageing results.
The simulations start with bit-strings of length each, which are zero everywhere. Then at each iteration each bit-string with mutation probability selects randomly one of its bits and flips it. Before that, also at every time step, for each family (offspring of one ancestor) either the last bit-string is deleted (with probability ) or a randomly selected bit-string is duplicated (with probability ) and then becomes the last; the positive bias keeps the number of copies (“paralogs”) for each of the original bit-strings limited. Also, the number is not allowed to become negative. Thus at any time we have for each of the ancestors a family consisting of the first bit-string and possibly additional copies or paralogs, amounting to bit-strings in total for one ancestor (=gene = function).
The Hamming distance (= number of bits different in a bit-by-bit comparison of two bit-strings) was calculated for each paralog with all other bit-strings in the same family at the same time, giving Hamming distances.
The simulations mostly used for iterations and averaged over 64000 samples. Simulations for barely differed in the results when a comparison was possible. The average number of paralogs was nearly 3, i.e. we had nearly two additional bit-strings (plus the first one) for each ancestor. Semilogarithmic plots, Fig. 3, of the number of paralog pairs for one ancestor with Hamming distance not exceeding different bits typically gave straight lines with slopes only slightly depending on . was taken as 0,1,2,4,8,16,32, and 64. For large the curves nearly overlap. For clarity we divided for our figure the number of pairs by the normalizing factor and thus for get the total number of families.
The overall distributions , lines in Fig. 3, decay exponentially, proportional to , in the stationary state achieved after dozens of iterations for , even when the Hamming distances still grow. This formula follows from a detailed balance condition that as many families move on average from size to size as move in the opposite direction from size to size . Thus the fraction of families with only a single bit-string is in this geometric series.
We define the creation of a new paralog as a branching event and store this time. At the end of the simulation we determine for each pair within each family the last event they branched away from each other; the time between this last event and the last iteration of the simulation is the branching time. Within each family the branching times fluctuate strongly but their average value for one given Hamming distance increases roughly linearly with that Hamming distance, until for large Hamming distances the statistics becomes poor, Fig. 4. For longer times (500 and 1000 iterations) the linearity improves.
The above model follows ref.2 except that no selection of the fittest and similar complications are included now. Each of the ancestors is interpreted as one function (or gene) in the whole organism. The bit-string for this ancestor then records important mutations at different places within this gene. The paralogs formed in the simulation from this ancestor all refer to this one function. The first bit-string undergoes mutations just as its paralogs and has the same properties except that it can never be removed. It makes no sense to compare bit-strings for different functions; 00101001 means something entirely different for the function “brain” than for the function “hair”. The bits of each bit-string correspond to possible alleles for one function, not to base pairs.
The initial ancestors can also be interpreted as different samples simulated for the same function; more generally, they could be different genomes simulated for a genome of functions.
5 Summary
We presented here two different sets of plots: In the experimental section we found power-law decay for the number of paralogs found by looking through the whole genome. In the simulation section we found exponential decays for the number of paralogs belonging to one known function. The latter exponential decay agrees nicely with simple arguments based on detailed balance; the slopes in these semilogarithmic plots (Fig.3) are determined by our bias in favour of removal instead of addition of a paralog, and the slopes barely depend on the cut-off parameter for the Hamming distance. This agreement of theory with simulation also makes clear that our results would be quite different if the bias would not be the same for all functions.
Acknowledgements
DS thanks the Julich supercomputer center for time on their Cray-T3E and M. Dudek for help with LNCS formats. JPR was partially supported from the 115/E-343/S/ICM/853/2003 and 115/E-343/BW/ICM/1624/2003 grants.
References
[1] Fitch WM: Distinguishing homologous from analogous proteins, Syst. Zool. 19 (1970) 99-113
[2] Cebrat S, Stauffer D: Monte Carlo simulation of genome viability with paralog replacement. J.Appl.Genet. 43 (2002) 391-395
[3] MIPS 2002 Database, http://mips.gsf.de/proj/yeast/.
[4] Mackiewicz P, Kowalczuk M, Mackiewicz D, Nowicka A, Dudkiewicz M, Laszkiewicz A, Dudek MR, Cebrat S: How many protein-coding genes are there in the Saccharomyces cerevisiae genome? Yeast 19 (2002) 619-629
[5] Slonimski PP, Mosse MO, Golik P, Henaut A, Risler JL, Comet JP, Aude JC, Wozniak A, Glemet E, Codani JJ: The first laws of genomics. Microb. Comp. Genomics 3 (1998) 46.
[6] Koonin EV, Galperin MY: Sequence - Evolution - Function, Computational approaches in Comparative Genomics (2003), Kluwer Academic Publishers
[7] Mackiewicz P, Mackiewicz D, Kowalczuk M, Dudkiewicz M, Dudek MR, Cebrat S: High divergence rate of sequences located on different DNA strands in closely related bacterial genomes. J. Appl. Genet. 44 (2003) 561-584
[8] Gerstein M, A structural census of genomes: Comparing bacterial, eukaryotic, and archaeal genomes in terms of protein structure: J.Mol.Biol., 274 (1997) 562-574
[9] Yanai I, Camacho CJ, DeLisi C: Predictions of gene family distributions in microbial genomes: Evolution by gene duplication and modification. Phys. Rev. Lett., 85 (2000) 2641-2644
[10] Brenner SE, Hubbard T, Murzin A, Chotia C: Gene duplications in Haemophilus influenzae. Nature, 378 (1995) 140
[11] Huynen MA, van Nimwegen E: The frequency distribution of gene family sizes in complete genomes. Mol.Biol.Evol., 15 (1998) 583-589
[12] Codani JJ, Comet JP, Aude JC, Glemet E, Wozniak A, Risler JL, Henaut A, Slonimski PP: Automatic analysis of large-scale pairwise alignments of protein sequences. Methods Microbiol., 28 (1999) 229-244
[13] Comet JP, Aude JC, Glemet E, Risler JL, Henaut A, Slonimski PP, Codani JJ: Significance of Z-value statistics of Smith-Waterman scores for protein alignments. Comput.Chem., 23 (1999) 317-331
[14] Qian J, Luscombe NM, Gerstein M: Protein family and fold occurrence in genomes: Power-law behaviour and evolutionary model. J.Mol.Biol. 313 (2001) 673-681
[15] Unger R, Uliel S, Havlin S: Scaling law in sizes of protein sequence families: From super-families to orphan genes. Proteins 51 (2003) 569-576
[16] van Nimwegen E: Scaling laws in the functional content of genomes. Trends Genet. 19 (2003) 479-484
[17] Koonin EV, Wolf Yi, Karev GP: The structure of the protein universe and genome evolution, Nature, 420 (2002) 218-223
[18] TERAPROT project (CEA, Gene-It, Infobiogen), June 2002
[19] Alle P: Simulation of gene duplication in the Penna bit-string model of biological ageing. Master’s thesis, Cologne University 2003.