Failed “nonaccelerating” models of prokaryote gene regulatory networks
Abstract
Much current network analysis is predicated on the assumption that important biological networks will either possess scale free or exponential statistics which are independent of network size allowing unconstrained network growth over time. In this paper, we demonstrate that such network growth models are unable to explain recent comparative genomics results on the growth of prokaryote regulatory gene networks as a function of gene number. This failure largely results as prokaryote regulatory gene networks are “accelerating” and have total link numbers growing faster than linearly with network size and so can exhibit transitions from stationary to nonstationary statistics and from random to scale-free to regular statistics at particular critical network sizes. In the limit, these networks can undergo transitions so marked as to constrain network sizes to be below some critical value. This is of interest as the regulatory gene networks of single celled prokaryotes are indeed characterized by an accelerating quadratic growth with gene count and are size constrained to be less than about 10,000 genes encoded in DNA sequence of less than about 10 megabases. We develop two “nonaccelerating” network models of prokaryote regulatory gene networks in an endeavor to match observation and demonstrate that these approaches fail to reproduce observed statistics.
I Introduction
The difficulty of developing fully scalable technologies which can be equally applied to both very small and very large systems explains much of the current fascination with network analysis. This field examines how growing networks can display stationary (size independent) scale free or exponential statistics which are unchanging over vast size ranges, and this field will naturally focus on the very large and obvious networks possessing readily obtainable statistics such as the Internet, the World Wide Web and movie databases. However, there is an entire class of networks equally important to human society, technology and biology which possess nonstationary (size dependent) connectivity statistics and which are thereby forced to undergo structural transitions as they grow sometimes so severe as to limit growth entirely—for a review see Gagen_03_accel_survey . The resulting limited size of these networks makes them less obvious but does not decrease their relevance.
In particular, prokaryote gene regulatory networks exploiting homology based (sequence specific) interactions will display nonstationary or “accelerating” statistics where the link number per node grows linearly with network size (so total link number grows quadratically with network size), so these networks will be inherently constrained to have sizes less than about 20,000 genes Croft_03_unpub . In fact, all prokaryotic gene numbers and genomes are indeed of restricted size (less than about 10,000 genes with genomes of between 0.5 and 10 megabases Casjens_98_33 ), in contrast to the genomes of multicellular eukaryotes (with for humans, about 30,000 genes and a genome of about 3 gigabases Int_Human_genome_01_86 ; Venter_01_13 ).
The rapidly expanding field of network analysis, reviewed in Dorogovtsev_02_10 ; Albert_02_47 , has provided examples of networks exhibiting “accelerating” network growth where link number grows faster than linearly with network size Dorogovtsev_01_025101 ; Sen_0310513 . For instance, the Internet Faloutsos_99_25 appears to grow by adding links more quickly than sites though the relative change over time is small and the Internet appears to remain scale free and well characterized by stationary statistics Vasquez_02_066130 . Similarly, the number of links per substrate in the metabolic networks of organisms appears to increase linearly with substrate number Jeong_00_65 , the average number of links per scientist in collaboration networks increases linearly over time Dorogovtsev_00_33 ; Vasquez_00_0006132 ; Barabasi_01_0104162 ; Barabasi_02_590 ; Vasquez_03_056104 , and languages appear to evolve via accelerated growth Dorogovtsev_01_2603 . Even social networks take on their small world characteristics only when the network is large enough—in small towns everyone knows everyone else so social networks are accelerating and exhibit a transition to small world statistics only as individual nodes saturate their connectivity limits Watts_99_493 . Accelerating networks are more prevalent and important in society and in biology than is commonly realized Gagen_03_accel_survey .
A “probabilistic” accelerating model of prokaryote regulatory gene networks has been developed in Ref. Gagen_0312021 . This involved the use of probabilistic links to allow arbitrarily rapid acceleration rates, two distinct classes of nodes where “regulators” can source outbound regulatory links to regulate other nodes (both regulators and non-regulators) while “non-regulators” cannot source outbound links, directed links from regulators to regulated nodes, and distinct connectivity distributions describing the long-tailed and scale-free distribution of outbound link number per regulator and the compact and exponential distribution of the inbound link number per node. The resulting model satisfactorily matched observable parameters. However, this success is meaningless if similar results can be achieved via nonaccelerating network models. In this paper, we will show that the two simplest nonaccelerating network models fail to explain either the observed quadratic growth of regulator number with genome size or the detailed statistics pertaining to the E. coli genome.
In Section II we canvass the available literature to characterize the statistics of prokaryote gene regulatory networks. This then allows the construction of two nonaccelerating network models in Section III where we use the continuous approximation and simulations to analyze network statistics allowing comparison to observation.
II Overview of prokaryote gene networks
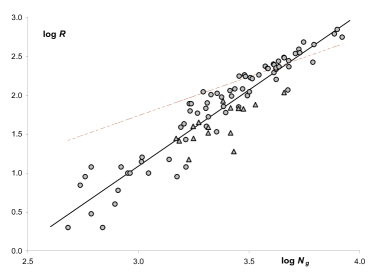
Ongoing genome projects are now providing sufficient data to usefully constrain analysis of the gene regulatory networks of the simpler organisms. Ref. vanNimwegen_03_479 first noted quadratic growth in the class of transcriptional regulators () with the number of genes in bacteria with the observed results
| (1) |
Here, the top two lines refer to different classes of regulators while the bottom two lines are the results of a crosschecking analysis of two alternate databases, and quoted intervals reflect 99% confidence limits vanNimwegen_03_479 . Ref. Croft_03_unpub analyzed of 89 bacterial and archeael genomes to determine the relations
| (2) |
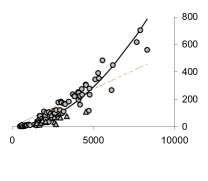
In all cases, the limits reflect 95% confidence levels, and for completeness, the data is shown in Fig. 1. The observed quadratic growth implies an ever growing regulatory overhead so there will eventually come a point where continued genome growth requires the number of new regulators to exceed the number of nonregulatory nodes, and based on this, Ref. Croft_03_unpub predicted an upper size limit of about 20,000 genes, within a factor of two of the observed ceiling. A number of other papers have noted the faster than linear growth of regulator number with genome size. In particular, it was noted that larger genomes harboured more transcription factors per gene than smaller ones Cases_03_248 , and that regulators form an increasing proportion of all genes as genome size increases Stover_00_959 ; Bentley_02_141 .
Prokaryotes typically group their DNA encoded genes in operons, co-regulated functional modules of average size 1.70 genes each in E. coli which value we treat as typical though in reality, operon size decreases slightly with genome size Cherry_03_40 . E. coli regulatory proteins affect an average of about 5 operons with this distribution being long tailed Shen_Orr_02_64 so the majority of regulators affect only one operon though some regulators (CRP) can affect up to 71 operons or 133 genes Thieffry_98_43 . More recent estimates show this transcription factor—CRP, a global sensor of food levels in the environment—regulating up to 197 genes directly and a further 113 genes indirectly via 18 other transcription factors MandanBabu_03_1234 . (To observe the long tailed distribution, see Fig. 2 of Ref. Thieffry_98_43 and Fig. 4 of Ref. MandanBabu_03_1234 .)
The number of inputs taken by an operon is characterized by a compact exponential distribution with a rapidly decaying tail so the majority of regulated operons are controlled by a single regulator while very few regulated operons are controlled by four, five, six or seven regulators Thieffry_98_43 ; Shen_Orr_02_64 ; MandanBabu_03_1234 . The average number of inputs in E. coli is about 1.4 Shen_Orr_02_64 , 1.5 Thieffry_98_43 , or 1.6. MandanBabu_03_1234 . In addition, 31.4% of E. coli transcription factors regulate other transcription factors MandanBabu_03_1234 , while 37.7% of non-autoregulatory cascades in E. coli are of length two, 52.5% are three-level cascades, and 9.8% are four-level cascades MandanBabu_03_1234 .
III Nonaccelerating prokaryote network models
We extend the gene network model of Refs. Thieffry_98_43 ; Gagen_0312021 to construct two nonaccelerating network models of prokaryote regulatory gene networks. Prokaryotes typically pack their genes into a lesser number of co-regulated operons where we assume that operons contain exactly genes. Of the existing operons, are regulated operons and are unregulated operons. Of the total number of operons, there are regulatory operons whose regulatory interactions are directed links from regulatory operons to regulated operons. Under the assumption that there is only one regulatory gene per regulatory operon, the observed linear relation of Eq. 2 becomes
| (3) |
In nonaccelerating network models, the number of links per regulator is constant so consequently, the total number of links must increase linearly with network size, giving
| (4) |
Here, the value for will be approximately , but the exact relation must be derived from the details of the implemented model.
Following Ref. Gagen_0312021 , each regulatory link between nodes is directed, and characterized by two distinct distributions describing respectively the placement of the heads and tails of each link. Only a relatively few nodes are regulatory, and of these, the number of outbound link tails per regulatory node are described by a size dependent long-tailed distribution with average about . Such a long-tailed distribution requires that link tails be preferentially attached to an existing regulatory operon, and this requirement places restrictions on the gene duplication processes assumed by the model—see Ref. Gagen_0312021 for details. In contrast to the relatively small number of regulatory nodes, all nodes can themselves be multiply regulated by inbound links. Further, the many used and unused promotor region binding sites broadly sample the space of possible binding sites so only a small fraction of nodes will be regulated by any one regulator. As a result, the number of inbound link heads per node is described by a size dependent exponential distribution with a low average of as typically results from the random or non-preferential attachment of inbound links to operon promotor sequences.
We suppose that the operon network grows by the sequential addition of numbered nodes for , and that at network size , node () has outbound tails and inbound heads. We do not model the many trials of potential genes over many generations and merely include fixated genes in our count—that is, drifting sequence is not counted as part of the fixated genome. This further implies the sequence of established nodes is under severe selective constraint and unable to drift so consequently new links cannot be added between existing nodes.
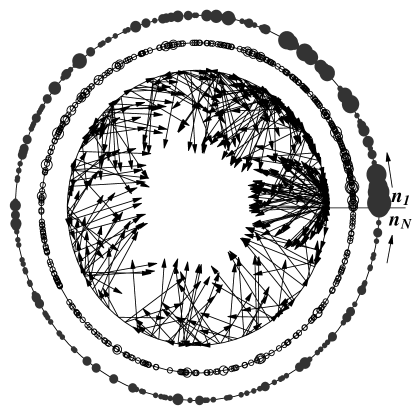
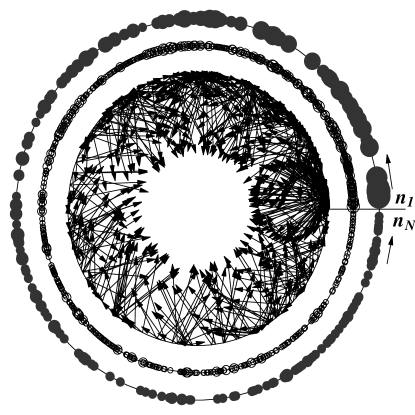
For clarity, Fig. 2 preempts later calculations (from the one-parameter model) and depicts a statistically generated version of an E. coli genome where nodes are placed sequentially counterclockwise in a circle (for convenience only). Alternative genome models may be distinguished by the age distribution of regulators, regulated operons and their link numbers, and these are indicated in this figure. In particular, Fig. 2 shows a highly nonuniform distribution of both regulators and outbound link numbers and of regulated operons and inbound link numbers with gene age. (These age-independent distributions are in marked contrast to those generated by accelerating models of regulatory gene networks Gagen_0312021 .)
A substantial proportion of the gene regulation network of prokaryotes is enacted via homology dependent interactions as when sequence specified protein transcription factors bind to specific promoter sequences. Naturally then, regulators will form more links in larger genomes than in smaller genomes Croft_03_unpub ; Gagen_0312021 . Such interactions lead immediately to accelerating models of gene regulatory networks Gagen_0312021 , making it difficult to propose plausible physical mechanisms restricting regulators to form the same probable number of initial links independent of genome size and thereby implement a nonaccelerating model. However, the purpose of this paper is to fully evaluate nonaccelerating gene regulatory network models, and we here presume that such physical mechanisms exist (without detailing them).
III.1 One-parameter model
For our first model, we assume that on entry into the genome, each new node can form a total of up to outbound regulatory links with all the nodes with each individual link forming with probability , and, provided that sufficient regulators already exist, up to a total of inbound regulatory links each with probability from some subset of the existing regulators chosen according to preferential attachment. (For consistency, the probable number of inbound distinct regulatory links to node () must be less than the probable number of existing regulators (), satisfied when genomes have size .) Hence, the respective probabilities that the initial number of heads or the initial number of tails for node is
| (5) |
with the proviso that all the inbound links can only be added to node if there is a sufficient number of regulators among the nodes . The average number of inbound and outbound links is identical, independent of network size. The addition of node and its links will increase the probable number of heads attached to earlier nodes for so , while the probable number of tails outbound from node increases if and only if that node is regulatory with .
The average number of links in a network of size nodes is then
| (6) |
taking account of both heads and tails. Under the assumption that regulators can only be created on entry to the genome Gagen_0312021 , the distribution of regulators at any time is specified by the distribution for so the probability that node is a regulator is . For a network of nodes, the predicted total number of regulators is then
| (7) | |||||
The bottom line shows the expected behaviour for the number of regulators in the respective limits giving , and giving . Comparison to the observed Eq. 3 provides the noted constraint which reduces the number of free variables by one to justify this as a one-parameter model. Combining Eqs. 3, 6 and 7, and noting that is integral gives
| (8) |
which establishes the infinite number of possible modelling choices
| (9) | |||||
The values of the link formation probability over this range of values suggest overly short average promotor binding site lengths of between bases. These values are unreasonably low though we are restricted from exploring arbitrarily large values for by our desire to develop a nonaccelerating network model—obtaining a promotor sequence length of about 6 requires , and such large values effectively implement an accelerating network model as every regulator can effectively explore links to every operon in even large genomes. For modelling purposes, we set and to give
| (10) |
This high link formation rate leads to the heavy density of regulators and regulated operons in Fig. 2. The average number of links per regulator using Eqs. 7 and 10 is then approximately , a constant for all genomes which is reasonably close to the observed value of for E. coli Shen_Orr_02_64 .
III.1.1 Random distribution of regulated operons—I
The distribution of link heads for all nodes (with possession of a link head designating a regulated node), can be straightforwardly calculated under the assumption that the new tails added with node are randomly distributed across the existing nodes so on average, each existing node receives additional inbound links. The continuous approximation Barabasi_99_17 ; Barabasi_99_50 ; Dorogovtsev_01_056125 for links randomly distributed over existing nodes determines the number of inbound head links for node according to
| (11) |
This can be integrated with initial conditions at time and final conditions at time to give
| (12) |
The number of inbound regulatory links per node is then dependent on the age of each node. Integration of these link numbers over all node numbers gives the required total number of links as in Eq. 6. This distribution suggests that the oldest node for the E. coli genome with nodes will possess an average of inbound regulatory links while the most recent node will possess an average of inbound regulatory links—see the age dependent distributions of Fig. 2.
The very useful continuum approach is not entirely accurate when applied to these nonaccelerating networks, and it is necessary to check later results using fuller derivations of the underlying joint probability distributions. In particular, the probability that by time , node has received an initial inbound links each with probability , and subsequently received inbound links from itself each with probability , as well as inbound links from node each with probability , and so on until it receives inbound links from node each with probability , is
| (13) | |||||
The average number of inbound links for node is then
| (14) | |||||
as found by the continuum approach. (Later results will not match so closely.)
The number of links per node is monotonically decreasing with node number as even though all nodes receive the same number of initial links on average, earlier nodes have a longer time to accumulate more links than later nodes. This distribution contains information about both node connectivity and node age and so approximates genome statistics (simulated or observed) when all this information is available. However, it is usually the case that node age information is unavailable necessitating calculation of connectivity distributions that are not conditioned on node age. This effectively requires binning together all nodes irrespective of their age to obtain a final link distribution. We can use the continuum approach for monotonically decreasing link numbers with node age Barabasi_99_17 ; Barabasi_99_50 ; Dorogovtsev_01_056125 to discard the often unknown age information via
| (15) | |||||
where is the solution of the equation . For our case with the constraint , the final distribution of link heads absent age information is
| (16) |
showing an exponentially rapid decrease in the number of probable links. As every node initially receives a minimum of links, this distribution is normalized, , and has average . The expected proportion of nodes possessing inbound links is then obtained by integrating the continuous distribution of Eq. 16 over appropriate ranges or to obtain
| (17) |
Consequently, the distribution of inbound link numbers for regulated nodes (i.e. those with ) is , or
| (18) |
which again is normalized to unity.
These distributions for the number of inbound link heads per node and per regulated node permit the calculation of the number of unregulated operons via either (from Eq. 13) or (from Eq. 17). Thus, the total number of unregulated nodes is respectively
| (19) |
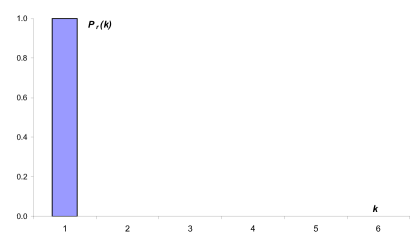
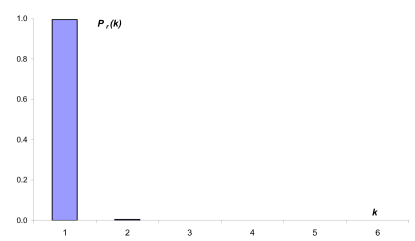
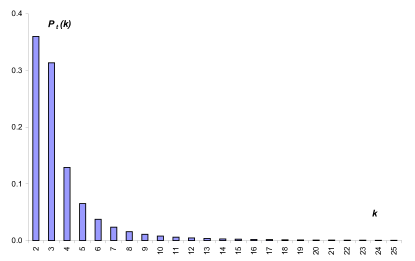
The top line here shows the expected behaviour with giving and giving as required. The second line derived using the continuum approximation fails to exhibit the desired dependency on link number as demonstrating that care must be taken in using this approach. Using the more accurate top line, the number of regulated nodes is then approximately , so in turn, the number of inbound links per regulated node is . A direct calculation of the average number of inbound links for regulated operons using the distribution of Eq. 18 gives , close to the value of or 1.6 observed in E. coli Thieffry_98_43 ; Shen_Orr_02_64 ; MandanBabu_03_1234 . In addition, the average number of inbound regulatory links per operon (for all operons) is . The predicted distribution of inbound links for regulated operons (Eq. 18) can be compared to that observed in the E. coli network of size operons Cherry_03_40 , and is shown in Fig. 3. The overly rapid decay of the calculated distribution poorly approximates the compact exponential distribution observed for E. coli shown in Fig. 2(d) of Ref. Cherry_03_40 and of Fig. 5 of Ref. MandanBabu_03_1234 leading to an underestimation of the numbers of regulated operons with 2 or more inputs—essentially no regulators are predicted to have 2 or more inputs for genomes of size operons.
III.1.2 Scale-free distribution of regulator operons—I
At time , the inbound links associated with node have their tails preferentially attached to existing regulatory nodes with probability proportional to the number of existing regulatory links for that node at time , i.e. . Using the continuous approximation Barabasi_99_17 ; Barabasi_99_50 ; Dorogovtsev_01_056125 , the rate of growth in outbound link number for node is then approximately
| (20) |
The denominator here is a probability weighting to ensure normalization and is the total number of outbound links for all nodes at network size . Following Dorogovtsev_02_10 , we can evaluate the denominator using the identity
| (21) |
This can be evaluated using Eq. 20 noting giving
| (22) |
which can be integrated determining the denominator of Eq. 20 to be
| (23) |
This is in agreement with Eq. 6. Substituting this value into Eq. 20 gives
| (24) |
Finally, this can be integrated with initial conditions at time and final conditions at time to give
| (25) |
Because we are now considering outbound links, we must take account of our use of two classes of distinguishable nodes, regulators and non-regulators, by allowing for the known distribution of regulators with node number over the genome. The average link number per node at node (Eq. 25) equates to the product of the average number of link tails per regulator at node , denoted , and the average number of regulators per node at node , denoted . This latter density is by Eq. 7, so by definition, we have
| (26) |
giving
| (27) |
Again we find a monotonically decreasing number of links per regulator with node number or age so older nodes are more heavily connected—see Fig. 2. Our treatment here effectively duplicates previous results for networks adding a constant deterministic number of links per node Albert_02_47 .
As usual, we again use the continuum approach for monotonically decreasing link numbers with node age (Eq. 15 and noting ) Barabasi_99_17 ; Barabasi_99_50 ; Dorogovtsev_01_056125 to discard the often unknown age information in the distribution to obtain the outbound link distribution
| (28) |
which is normalized over the range , as . In turn, the expected proportion of regulators possessing links is then obtained by integrating the continuous distribution of Eq. 28 over appropriate ranges or to obtain
| (29) |
As required, this is normalized to unity. The average number of outbound links per regulator is, using the continuous distribution , and numerically calculated to be using the distribution (complementing previous estimates following Eq. 10) each of which compares well to the observed value of 5 in E. coli Shen_Orr_02_64 .
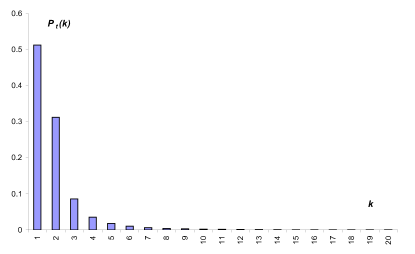
However, the very rapid (cubic) decrease in probable link numbers means that these distributions have difficulty in reproducing the distributions observed in E. coli. The expected outbound link distribution appears in Fig. 4 showing a long-tailed and scale free distribution with probabilities scaling roughly as . The distribution shows that a full 51% of regulators have only one link, while 83% have two or fewer links, and 91% have three or fewer links. In particular, the expected number of regulators with links is with the number of regulators obtained from Eq. 7 (or from observation). For E. coli with operons Cherry_03_40 , this predicts the probable existence of only one E. coli regulator possessing link numbers in the range between links. This poorly approximates the connectivity of E. coli where many regulators regulate more than 20 operons including the global food sensor CRP which regulates up to 197 genes directly MandanBabu_03_1234 . In fact, Eq. 27 with predicts that the most heavily connected node in E. coli has only about downstream links.
III.1.3 Cascades and regulatory islands—I
Nonaccelerating networks have stationary statistics which are independent of network size. In particular, the proportion of the network present in islands of nodes of various sizes connected by regulatory links is independent of genome size. As prokaryote regulatory networks likely consist of functionally distinct regulated modules Thieffry_98_43 ; Hartwell_99_c4 with a marked absence of regulatory cycles (at least in E. coli Thieffry_98_43 ; Shen_Orr_02_64 ; MandanBabu_03_1234 ), any network model must be able to adequately reproduce the statistics of regulatory islands and cascades.
The proportion of transcription factors which control downstream regulators is
| (30) | |||||
Here, the first fraction on the RHS normalizes the proportion in terms of the number of regulators (Eq. 7), the first term in the summation is the probability that node is a regulator, the second term is the average number of regulatory outbound links for this regulatory node at network size (Eq. 27), and the third term approximates the probability that these nodes link to one of the existing regulators under random attachment. (If the very first and very last terms are dropped, the remaining summation over all nodes of the probability that is regulatory with the stated number of links equates to the total number of links in the network . This is the more accurate version of the calculation leading to Eq. 27.) Hence, the proportion of regulators which control transcription factors is independent of network size and equals 19.6%. This ratio compares reasonably well with that observed in E. coli where Ref. MandanBabu_03_1234 noted 31.4% regulate other transcription factors.
As the proportion of regulators of transcription factors rises, the probable length of regulatory cascades increases. In fact, the proportion of regulators taking part in a regulatory cascade of length is
| (31) |
This equation can be obtained from a tree of all binary pathways which at each branching point either terminate with probability or cascade with probability . As such, the probable cascade length is negligible when the proportion of regulators controlling regulators is small but can become large as itself increases. The calculated lengths of regulatory cascades can be compared to those in E. coli where 37.7% are of length two, 52.5% are three-level cascades, and 9.8% are four-level cascades MandanBabu_03_1234 . As one-level or autoregulatory interactions are not included in this observation, the predicted proportions for E. coli are with giving 80% two-level cascades, 16% three-level cascades, 3% four-level cascades, 1% five-level cascades, and so on. It is seen that the theoretical predictions overestimate the proportion of two-level cascades and underestimate the number of three-level cascades probably because of selection pressures not included in the model, while other calculated values closely approximate those observed.
We note that this model is entirely unable to explain the high proportion of autoregulation observed in E. coli with various estimates that 28.1% Rosenfeld_02_785 , 50% Shen_Orr_02_64 and 46.9% Thieffry_98_43 of regulators are autoregulatory. The predicted proportion of autoregulators is approximated by replacing the very last fraction () in Eq. 30 by the term giving the probability that a self-directed link is formed, leading to the expected autoregulatory proportion for E. coli. This failure likely reflects the action of selection processes promoting spatial rearrangements of entire regulons on the genome and the internal shuffling of genes and promotor units. Such reorganizations of duplicated gene regions (presumably shuffling genes and promotor regions) have been common in E. coli allowing for instance, spatial regulatory motifs whereby the promotors of colocated (overlapping) and often co-functional operons transcribed in opposing directions can interfere Warren_03_0310029 .
We now turn to consider the size of the largest connected island in growing prokaryote gene networks featuring directed links whose tails are preferentially attached to regulators and whose heads are randomly distributed over all existing nodes. For simplicity, we define an island to consist of all nodes which are linked regardless of the orientation of all links and so effectively treat links as being undirected. This is because a regulator can potentially perturb every node downstream to it including those nodes downstream of other regulators and so can modify the regulatory effects of other regulators—essentially, if the downstream effects of different regulators eventually intersect, we count these regulators in the same island. (Other definitions of islands could be used.)
The growth of the largest island can be both directly simulated and calculated under the continuum approximation Gagen_0312021 (though this simple approach is indicative only and is quite sensitive to for instance, the assumed average size of external islands). The dominant (but not sole) mechanism by which island can grow is for the newly added node to either (a) be a regulator (with probability ) and establish an outbound regulatory link to some existing node in (with probability ) while at the same time accepting a regulatory link (with probability ) from a node in a different island (with probability ), or (b) accept an inbound regulatory link (with probability ) from a regulator in island (with probability ) while establishing a regulatory link (with probability ) to some node in a different island (with probability ). (Here, we assume that regulators are uniformly distributed over islands and the number of links within an island scales with the size of the island to crudely model preferential attachment.) The result is that island grows by the size of the second island . Altogether, the rate of growth in the size of island is then
| (32) |
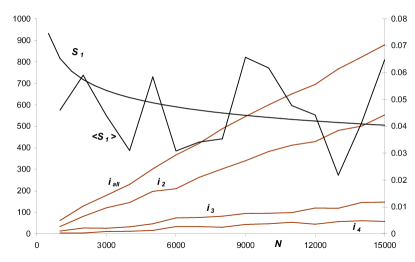
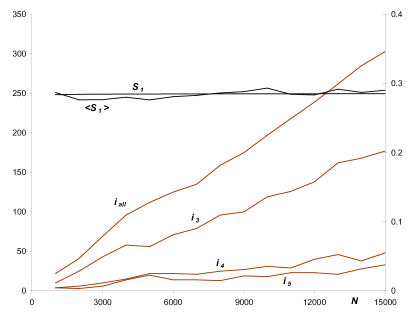
For initial conditions, we assume that a first link appears when the genome has nodes (). A consistent solution for this equation appears with island size growing linearly with genome size, , with under the assumption that sufficient small islands are created to ensure remains a constant. Simulations show the average size of outside islands to be very closely over a large range of genome sizes, though a reasonable match between theory and simulation requires setting . This is reasonable given the approximations made. Fig. 5 shows the number of all discrete islands as well as the number of islands containing two, three and four components, and the predicted and simulated sizes of the largest island expressed as a proportion of the total genome size with a close match between theory and simulation. This figure suggests that the E. coli genome of operons should possess a giant component containing about 4% of all nodes or about 100 operons. This can be compared to the observed figure where about 300 operons of the examined regulatory and regulated operons (but not including unregulated and nonregulatory operons) can be loosely grouped into 3-6 “dense overlapping regulons” or DORS of about 50 operons each while the remaining operons appeared as disjoint systems with most containing 1-3 operons but some containing up to 25 operons Shen_Orr_02_64 . The constant proportion of the genome taken up by the largest island, and the constantly growing number of discrete islands means that this network architecture suffers no maximum size limit. As a result, this approach is unable to explain the upper size limit observed in the evolutionary record.
III.2 Two-parameter nonaccelerating prokaryote network model
The above one-parameter model combined the probability of forming a link and the maximum number of links to give the probable number of regulators formed . A two-parameter nonaccelerating model can be constructed by delinking these variables so that the probability of being a regulator is given directly by leaving the number of links established as a free parameter. This gives the number of regulators as . We assume that every regulator gains exactly outbound links on entry to the genome which are randomly distributed as inbound link heads over all existing nodes. The average number of initial outbound links per regulator is then while the average number of outbound links per node is . These outbound link tails must be balanced by uniformly distributed inbound link heads so consequently, we assume that all nodes on entry to the genome receive inbound regulatory links distributed according to
| (33) |
giving the required average of inbound links per node of . The average number of links is taking account of both heads and tails. Hence, the number of outbound links per regulator is , so setting allows a close fit between this model and the value of observed in E. coli. This sets giving the number of inbound links per node as . The values of the link formation probability suggest an overly short average promotor binding site length of bases.
III.2.1 Random distribution of regulated operons—II
With respect to the distribution of inbound regulatory links, the two-parameter model does not differ in any material respect from the earlier one-parameter model as in both cases links are uniformly distributed over all nodes. However, the link formation probability differs in each approach, so all of the results of Eqs. 11 to 19 can be used with the changes , , and .
Consequently, the distribution of inbound regulatory heads over all nodes is
| (34) |
again monotonically decreasing with node age. This distribution suggests that the oldest node for the E. coli genome with nodes will possess inbound regulatory links while the most recent node will possess inbound regulatory links—see the age dependent distributions of Fig. 6.
Following the previous derivation, the distribution of inbound link numbers for regulated nodes (i.e. those with ) is
| (35) |
which again is normalized to unity. As previously, the number of regulated nodes is approximately , so in turn, the number of inbound links per regulated node is . A direct calculation of the average number of inbound links for regulated operons using the distribution of Eq. 35 gives , close to the value of or 1.6 observed in E. coli Thieffry_98_43 ; Shen_Orr_02_64 ; MandanBabu_03_1234 . The predicted distribution of inbound links for regulated operons (Eq. 35) can be compared to that observed in the E. coli network of size operons Cherry_03_40 , and is shown in Fig. 7. Again, the overly rapid decay of the calculated distribution poorly approximates the compact exponential distribution observed for E. coli shown in Fig. 2(d) of Ref. Cherry_03_40 and of Fig. 5 of Ref. MandanBabu_03_1234 leading to an underestimation of the numbers of regulated operons with 3 or more inputs—essentially no regulators are predicted to have 3 or more inputs for genomes of size operons.
III.2.2 Scale-free distribution of regulator operons—II
As previously, the rate of growth in outbound link number for node is approximately
| (36) |
Here, the denominator on the right hand side is the expected number of existing links in a network of size nodes. Noting initial conditions , and , we have
| (37) |
As previously, this is the density of outbound regulatory links per node which equates to the density of outbound regulatory links per regulator times the density of regulators per node. As this latter density is uniform over the genome and equal to , then the density of outbound links per regulator is
| (38) |
Again, this distribution is monotonically decreasing with node age so older nodes are more heavily connected—see Fig. 6. With the additional degree of freedom offered by the independent parameter , this distribution shows the most heavily connected regulators having around 100 links in E. coli (with , , and ).
The often unknown age information in the distribution can be discarded using the continuum approach (noting ) to obtain the outbound link distribution
| (39) |
which is normalized over the range as . In turn, the expected proportion of regulators possessing links is then obtained by integrating the continuous distribution of Eq. 39 over appropriate ranges or to obtain
| (40) |
Here, as the choice means that the minimum number of links that a regulator can possess is two. As required, this is normalized to unity. The average number of outbound links per regulator is, using the continuous distribution , and numerically calculated to be using the distribution each of which compares well to the observed value of 5 in E. coli Shen_Orr_02_64 .
Again, the very rapid (cubic) decrease in probable link numbers means that these distributions have difficulty in reproducing the distributions observed in E. coli Cherry_03_40 ; MandanBabu_03_1234 . The expected outbound link distribution appears in Fig. 8 showing that 36% of regulators have two links, while 67% have three or fewer links, and 80% have four or fewer links. In particular, the expected number of regulators with links is with . For E. coli with operons Cherry_03_40 , this predicts the probable existence of only one E. coli regulator possessing link numbers in each of the respective ranges between links and in the range links. This poorly approximates the connectivity of E. coli where many regulators regulate more than 20 operons including the global food sensor CRP which regulates up to 197 genes directly MandanBabu_03_1234 .
| 3,000 | 6,000 | 9,000 | 12,000 | 15,000 | |
|---|---|---|---|---|---|
| 1 | 0.061 (85) | 0.011 (346) | 0.019 (531) | 0.016 (706) | 0.013 (888) |
| 2 | 0.277 (69) | 0.281 (125) | 0.288 (175) | 0.283 (239) | 0.290 (303) |
| 3 | 0.447 (21) | 0.436 (32) | 0.448 (41) | 0.453 (52) | 0.450 (67) |
| 4 | 0.554 (4) | 0.542 (4) | 0.549 (7) | 0.550 (9) | 0.548 (11) |
| 5 | 0.622 (1) | 0.610 (2) | 0.618 (2) | 0.620 (1) | 0.619 (2) |
III.2.3 Cascades and regulatory islands—II
The proportion of transcription factors which control downstream regulators is
| (41) | |||||
Here, the derivation follows that of Eq. 30. Again, the proportion of regulators which control transcription factors is independent of network size and equals 37.4%, which compares well with the 31.4% observed in E. coli MandanBabu_03_1234 .
As previously, the proportion of regulators taking part in a regulatory cascade of length is with giving 63% two-level cascades, 23% three-level cascades, 9% four-level cascades, 3% five-level cascades, 1% six-level cascades, and so on. As previously, these ratios overestimate the proportion of two-level cascades and under-estimate the proportion of higher level cascades in E. coli with 37.7% two-level cascades, 52.5% three-level cascades, 9.8% four-level cascades MandanBabu_03_1234 .
The size of the largest connected island is again expected to occupy a constant proportion of the genome regardless of size. An equivalent derivation to that of Eq. 32 gives the rate of growth in the size of island as
| (42) |
For initial conditions, we assume that a first link appears when the genome has nodes giving as the choice ensures there are no two member islands. As previously, a consistent solution exists with island size growing linearly with genome size () with under the assumption that sufficient small islands are created to ensure remains a constant. Simulations show the average size of outside islands to be very closely over a large range of genome sizes, while a reasonable match between theory and simulation requires setting , which is reasonable given the approximations made. Fig. 9 shows the number of all discrete islands as well as the number of islands containing three, four, and five components, and the predicted and simulated sizes of the largest island expressed as a proportion of the total genome size with a close match between theory and simulation. This figure suggests that the E. coli genome of operons should possess a giant component containing about 30% of all nodes or about 460 operons which overestimates that observed Shen_Orr_02_64 . Again, the constant proportion of the genome taken up by the largest island, and the constantly growing number of discrete islands means that this network architecture suffers no maximum size limit. As a result, this approach is unable to explain the upper size limit observed in the evolutionary record.
The two-parameter model has been developed with the setting to best match the observed number of links per regulator. However, a setting provides at least as good a match, and it is possible that choosing alternate settings for the initial number of links per regulator () and per node () might improve the fit to the data. Table 1 shows the relative size of the largest island and the total number of islands for simulated genomes of different size and for different choices of It is clear that choices overestimates the size of the largest regulatory islands while the choice gives a poor fit to the observed number of regulatory links per regulator.
IV Conclusion
In this paper, we developed two probabilistic nonaccelerating network models for the growth of prokaryote regulatory gene networks. These models complement the accelerating network model presented in Ref. Gagen_0312021 allowing a comparison of these alternate approaches.
Each of the nonaccelerating models presented here faces considerable difficulties in providing a plausible physical mechanism justifying a nonaccelerating regulatory model, and fails to consider any additional steric or logical limitations on combinatoric control at any given promotor. Further, these approaches are unable to explain the observed quadratic growth in prokaryote regulator number with increasing genome size displayed in Fig. 1. This mismatch between predicted and observed numbers of regulators is also reflected in the overly short expected promotor sequence lengths in each model. Further, the linear growth in regulator number with genome size effectively means that these networks are becoming relatively more and more sparsely connected with growth—the desired maximum number of possible links grows as so the relative density of links goes as as becomes large. This decrease in relative connection density means that nonaccelerating networks suffer their own inherent size constraints as complex networks operate poorly when sparsely connected.
We further compared each model to observed results for E. coli, and achieved reasonable matches for the average connectivity of the long tailed distribution of outgoing regulatory links (approximately 5) and the average of the exponential distribution of incoming regulatory links (approximately 1.5). However, the distributions themselves were either overly lightly connected (model one) or decayed overly rapidly leading to a distinct under-representation of highly connected nodes compared to the E. coli distributions (models one and two). Each of the nonaccelerating models was able to reasonably match the observed proportion of regulators controlling regulators (approximately 31.4%) and in turn, the probable length of regulatory cascades. Lastly, the first of the nonaccelerating models was able to roughly reproduce E. coli statistics on the numbers of discrete regulatory islands, though the second model overestimated the size of the largest discrete regulatory island. Because of the size independent statistics of these nonaccelerating models, neither approach displays structural transitions at any critical network size and thus face difficulties in explaining the prokaryote size and complexity limitations evident in the evolutionary record.
Our approach in this paper (and in Ref. Gagen_0312021 ) is unable to explain the high proportion of autoregulation observed in E. coli Shen_Orr_02_64 and this failure likely points to selection for genome reorganizations leading to spatial arrangements of operons allowing joint regulation Warren_03_0310029 which is not included in this model. Further, this approach does not include selection pressures ensuring that similarly regulated islands or modules share common functionality Shen_Orr_02_64 , or other regulatory mechanisms influencing both the transcription and translation of transcription factors including micro-RNAs and other chemical mechanisms and mediators (see for instance Vogel_03_6435 ).
The accelerating and nonaccelerating models of prokaryote gene networks differ most markedly in their predictions for the age dependency of the distribution of inbound and outbound regulatory links. It would be interesting to obtain information on the correlation (if any) between age and link number for different prokaryotes to properly distinguish these approaches.
We conclude that viable models of prokaryote regulatory gene networks are likely to be accelerating in nature. This is important as much current network analysis is predicated on the assumption that only nonaccelerating networks are relevant to society or biology due to their unconstrained sizes and constant statistics. However, such assumptions make it very difficult to explain the size limitations displayed by prokaryotic gene networks in the evolutionary record. Subsequently, it is likely that viable models of eukaryotic regulatory networks will be accelerating and will incorporate computationally complex technologies Mattick_01_1611 ; Mattick_01_986 ; Mattick_03_930 .
References
- (1) M. J. Gagen and J. S. Mattick. Inherent limitations of “accelerating” networks in biology and society. In Preparation, 2003.
- (2) L. J. Croft, M. J. Lercher, M. J. Gagen, and John S. Mattick. Is prokaryotic complexity limited by accelerated growth in regulatory overhead? arXive:q-bio.MN/0311021. See http://arxiv.org/abs/q-bio.MN/0311021, 2003.
- (3) S. Casjens. The diverse and dynamic structure of bacterial genomes. Annual Review of Genetics, 32:339–377, 1998.
- (4) International Human Genome Sequencing Consortium. Initial sequencing and analysis of the human genome. Nature, 409(6822):860–921, 2001.
- (5) J. C. Venter, et al. The sequence of the human genome. Science, 291(5507):1304–1351, 2001.
- (6) S. N. Dorogovtsev and J. F. F. Mendes. Evolution of networks. Advances in Physics, 51(4):1079–1187, 2002.
- (7) R. Albert and A. L. Barabási. Statistical mechanics of complex networks. Reviews of Modern Physics, 74:47–97, 2002.
- (8) S. N. Dorogovtsev and J. F. F. Mendes. Effect of the accelerating growth of communications networks on their structure. Physical Review E, 63:025101(R), 2001.
- (9) P. Sen. Accelerated growth in outgoing links in evolving networks: Deterministic vs stochastic picture. 2003. arXive:cond-mat/0310513. See http://arxiv.org/abs/cond-mat/0310513.
- (10) M. Faloutsos, P. Faloutsos, and C. Faloutsos. Power-law relationships of the Internet topology. In L. Chapin, J. P. G. Sterbenz, G. Parulkar, and J. S. Turner, editors, Proceedings of the Conference on Applications, Technologies, Architectures, and Protocols for Computer Communication, pages 251–262, New York, 1999. ACM Press.
- (11) A. Vásquez. Large-scale properties and dynamical properties of the Internet. Physical Review E, 65(5):066130, 2002.
- (12) H. Jeong, B. Tombor, R. Albert, Z. N. Oltvai, and A.-L. Barabási. The large-scale organization of metabolic networks. Nature, 407:651–654, 2000.
- (13) S. N. Dorogovtsev and J. F. F. Mendes. Scaling behaviour of developing and decaying networks. Europhysics Letters, 52(1):33–39, 2000.
- (14) A. Vásquez. Knowing a network by walking on it: Emergence of scaling. Eprint cond-mat/0006132, 2000.
- (15) A. L. Barabási, H. Jeong, Z. Néda, E. Ravasz, A. Schubert, and T. Vicsek. Evolution of the social network of scientific collaborations. Eprint cond-mat/0104162, 2001.
- (16) A. L. Barabási, H. Jeong, Z. Néda, E. Ravasz, A. Schubert, and T. Vicsek. Evolution of the social network of scientific collaborations. Physica A, 311:590–614, 2002.
- (17) A. Vásquez. Growing network with local rules: Preferential attachment, clustering hierarchy, and degree correlations. Physical Review E, 67(5):056104, 2003.
- (18) S. N. Dorogovtsev and J. F. F. Mendes. Language as an evolving word web. Proceedings of the Royal Society of London B, 260:2603–2606, 2001.
- (19) D. J. Watts. Networks, dynamics, and the Small-World phenomenon. American Journal of Sociology, 105(2):493–527, 1999.
- (20) M. J. Gagen and J. S. Mattick. Inherent size constraints on prokaryote gene networks due to “accelerating” growth. 2003. arXive:q-bio.MN/0312021. See http://arxiv.org/abs/q-bio.MN/0312021.
- (21) E. van Nimwegen. Scaling laws in the functional content of genomes. Trends in Genetics, 19(9):479–484, 2003.
- (22) I. Cases, V. de Lorenzo, and C. A. Ouzounis. Transcription regulation and environmental adaptation in bacteria. Trends in Microbiology, 11(6):248–253, 2003.
- (23) C. K. Stover, et al. Complete genome sequence of Pseudomonas aeruginosa PAO1, an opportunistic pathogen. Nature, 406(6799):959–964, 2000.
- (24) S. D. Bentley, et al. Complete genome sequence of the model actinomycete Streptomyces coelicolor A3(2). Nature, 417(6885):141–147, 2002.
- (25) J. L. Cherry. Genome size and operon content. Journal of Theoretical Biology, 221:401–410, 2003.
- (26) S. S. Shen-Orr, R. Milo, S. Mangan, and U. Alon. Network motifs in the transcriptional regulation network of Escherichia coli. Nature Genetics, 31:64–68, 2002.
- (27) D. Thieffry. From specific gene regulation to genomic networks: A global analysis of transcriptional regulation in Escherichia coli. BioEssays, 20(5):433–440, 1998.
- (28) M. Madan Babu and S. A. Teichmann. Evolution of transcription factors and the gene regulatory network in Escherichia coli. Nucleic Acids Research, 31(4):1234–1244, 2003.
- (29) A. L. Barabási, R. Albert, and H. Jeong. Mean-field theory for scale-free random networks. Physica A, 272(1-2):173–187, 1999.
- (30) A. L. Barabási and R. Albert. Emergence of scaling in random networks. Science, 286:509–512, 1999.
- (31) S. N. Dorogovtsev and J. F. F. Mendes. Scaling properties of scale-free evolving networks: Continuous approach. Physical Review E, 63:056125, 2001.
- (32) L. H. Hartwell, J. J. Hopfield, S. Leibler, and A. W. Murray. From molecular to modular cell biology. Nature, 402 (Supp):C47–C52, 1999.
- (33) N. Rosenfeld, M. B. Elowitz, and U. Alon. Negative autoregulation speeds the response times of transcription networks. Journal of Molecular Biology, 323:785–793, 2002.
- (34) P. B. Warren and P. R. ten Wolde. Statistical analysis of the spatial distribution of operons in the transcriptional regulation network of Escherichia coli. q-bio.MN/0310029 (http://arxiv.org/abs/q-bio.MN/0310029), 2003.
- (35) J. Vogel, V. Bartels, T. H. Tang, G. Churakov, J. G. Slagter-Jäger, A. Hüttenhofer, and E. G. H. Wagner. RNomics in Escherichia coli detects new sRNA species and indicates parallel transcriptional output in bacteria. Nucleic Acids Research, 31(22):6435–6443, 2003.
- (36) J. S. Mattick. Challenging the dogma: The hidden layer of non-protein-coding RNAs in complex organisms. BioEssays, 25:930–939, 2003.
- (37) J. S. Mattick and M. J. Gagen. The evolution of controlled multitasked gene networks: The role of introns and other noncoding RNAs in the development of complex organisms. Molecular Biology and Evolution, 18(9):1611–1630, 2001.
- (38) J. S. Mattick. Non-coding RNAs: The architects of eukaryotic complexity. EMBO Reports, 2(11):986–991, 2001.