Inherent size constraints on prokaryote gene networks due to “accelerating” growth
Abstract
Networks exhibiting “accelerating” growth have total link numbers growing faster than linearly with network size and can exhibit transitions from stationary to nonstationary statistics and from random to scale-free to regular statistics at particular critical network sizes. However, if for any reason the network cannot tolerate such gross structural changes then accelerating networks are constrained to have sizes below some critical value. This is of interest as the regulatory gene networks of single celled prokaryotes are characterized by an accelerating quadratic growth and are size constrained to be less than about 10,000 genes encoded in DNA sequence of less than about 10 megabases. This paper presents a probabilistic accelerating network model for prokaryotic gene regulation which closely matches observed statistics by employing two classes of network nodes (regulatory and non-regulatory) and directed links whose inbound heads are exponentially distributed over all nodes and whose outbound tails are preferentially attached to regulatory nodes and described by a scale free distribution. This model explains the observed quadratic growth in regulator number with gene number and predicts an upper prokaryote size limit closely approximating the observed value.
I Introduction
The rapidly expanding field of network analysis, reviewed in Dorogovtsev_02_10 ; Albert_02_47 , has provided examples of networks exhibiting “accelerating” network growth, where link number grows faster than linearly with network size. For instance, the Internet Faloutsos_99_25 appears to grow by adding links more quickly than sites though the relative change over time is small and the Internet appears to remain scale free and well characterized by stationary statistics Vasquez_02_066130 . Similarly, the number of links per substrate in the metabolic networks of organisms appears to increase linearly with substrate number Jeong_00_65 , the average number of links per scientist in collaboration networks increases linearly over time Dorogovtsev_00_33 ; Vasquez_00_0006132 ; Barabasi_01_0104162 ; Barabasi_02_590 ; Vasquez_03_056104 , and languages appear to evolve via accelerated growth Dorogovtsev_01_2603 .
In the main, the chief focus of these studies has been on locating parameter regimes allowing accelerating networks to maintain scale free statistics and thereby to allow continued unconstrained growth. For example, an early study considered a growing network receiving new links for when the network size is at nodes, but restricted analysis to the case as “Obviously, cannot exceed 1 (the total number of links has to be smaller than since one may forbid multiple links).” and “The density of connections in real networks remains rather low all the time, so one may reasonably assume that is small.” Dorogovtsev_01_025101 . Equivalent limits were considered in Ref. Sen_0310513 . In such restricted parameter regimes networks could maintain scale free statistics, though this result carries the implicit but unexamined finding that alternate parameter regimes permit transitions from stationary to nonstationary statistics. This paper builds on these implicit findings.
Accelerating networks are more prevalent and important in society and in biology than is commonly realized—see the survey in Ref. Gagen_03_accel_survey . In fact, any network that requires functional integration and organization (where the activity of any given node is dependent on the state of the network or different subnetworks) is by definition an accelerating network, that is, as the network expands, the proportion of the network devoted to control and regulation expands disproportionately. This in turn means that all such networks, sooner or later, must be limited in their size and complexity, which limitations can only be breached by changing either the physical nature of the control architecture (a state transition) or by reducing the functional integration. In the latter case, where networks are hitting a complexity limit, further growth in network size will likely display structural transitions from randomly connected, to scale free statistics, to densely connected and perhaps finally to fully connected statistics. Should such networks be unable to successfully complete these transitions for any reason, then it is likely that network growth must cease entirely or that either a transition to a nonaccelerating structure is required to permit further growth or novel technologies must appear allowing the continuation of accelerated growth. Exemplar accelerating networks displaying such size limits or structural transitions include (a) all forms of economic markets where the latest price offered by any participant instantly affects all other participants, (b) industrial companies and sectors implementing a Just-In-Time business model where any worker can halt the entire production system, (c) error propagation networks linking an error source with all affected nodes as studied in software analysis and in models of the propagation of diseases, bushfires, cracks, and electricity grid failures, (d) in any dynamical system dependent on relative quantities so changes in one node instantly affects every other node such as relative transcription factor binding probabilities or relative evolutionary fitness, (e) in computer hardware and in cluster and grid supercomputer networks, and (f) in organizational networks Gagen_03_accel_survey . In fact, it is well understood that social networks only take on small world statistics when the network is large enough—in small towns everyone one knows everyone else so social networks are accelerating, and social networks make a transition to small world statistics only as individual nodes saturate their connectivity limits Watts_99_493 . Similar observations can be made about the scale free Internet and World Wide Web—when sufficiently small, these networks were likely accelerating until connectivity capacities saturated forcing a transition to scale free structures to permit further growth Gagen_03_accel_survey .
This paper develops an accelerating network model of prokaryotic (single celled) gene regulatory networks to investigate size and complexity limits inherent in the adoption of an accelerating architecture. Because our focus is on structural transitions, we explicitly do not need to restrict the degree of acceleration to low values of . Rather, we permit this parameter to take on any value including and ensure that the network is not saturated by making link formation probabilistic. The resulting novel “probabilistic” accelerating networks grow by adding on average new links with and otherwise arbitrary provided the probability of adding a link is suitably constrained so that total link number remains less than of order .
The gene regulatory model presented here is motivated by comparative genomics findings that the total number of regulatory proteins controlling gene expression (links) scales quadratically with the number of genes or operons (nodes) in prokaryotes vanNimwegen_03_479 ; Croft_03_unpub . This quadratic growth results as the number of links made by a regulator exploiting homology dependent (sequence specific) interactions scales proportionally to the number of randomly drifting promotor sequences or effectively, with gene number Croft_03_unpub . Hence, gene regulatory networks are inherently accelerating—the probable number of links per regulator increases linearly with node number with , so consequently, the total number of links scales quadratically as . In small and sparsely connected networks, most links come from different regulators suggesting that regulator number also scales quadratically with gene number, . Such an accelerating network would be characterized initially by sparse connectivity at low gene numbers and subsequently by denser connectivity at high gene numbers as networks attempt a transition to a densely connected regime. If the evolving networks can successfully make this transition, the evolutionary record will display a transition in network statistics for some critical network size . Conversely, if these networks, optimized by evolution in the sparse regime, are unable to make the transition to the densely connected regime, the evolutionary record would show a strict size limit at some critical network size. But this is exactly what is observed. All prokaryotic gene numbers and genomes are indeed of restricted size (less than about 10,000 genes with genomes of between 0.5 and 10 megabases Casjens_98_33 ), in contrast to the genomes of multicellular eukaryotes (with for humans, about 30,000 genes and a genome of about 3 gigabases Int_Human_genome_01_86 ; Venter_01_13 ). Ref. Croft_03_unpub predicted the size limit genes as continued genome growth requires the number of new regulators to exceed the number of nonregulatory nodes.
A satisfactory model of prokaryotic gene regulatory networks requires some novel features. As mentioned above, we introduce probabilistic link formation to allow rapid accelerated growth and correspondingly stricter size limits. (A different but related mechanism was introduced in Refs. Liu_02_036112 ; Goh_02_108701 which considered the effects of stochastic fluctuations in the number of added links with each additional node.) In addition, we employ directed links and partition nodes into two classes where “regulators” can source outbound regulatory links to regulate other nodes (both regulators and non-regulators), while “non-regulators” cannot source outbound links. (Ref. Cheng_02_066115 has previously considered networks of distinguishable nodes.) Further, experimental evidence presented below indicates that the distribution of inbound links is compact and exponential while the distribution of outbound links is long-tailed and likely scale-free. As a result, the heads and tails of our directed links are placed according to two distinct distributions. Altogether, these features allow the reproduction of the observed features of prokaryote gene regulatory networks and satisfactorily predicts the maximum prokaryotic gene count.
Our approach reproducing accelerating network statistics for growing prokaryote genomes complements and informs alternate networking approaches seeking to deduce or simulate the regulatory networks of particular organisms from gene perturbation and microarray experiments Wagner_01_1183 ; Bhan_02_1486 ; Lukashin_03_1909 .
In Section II we canvass the available literature to characterize the statistics of prokaryote gene regulatory networks. This then allows the construction of accelerating growth network models in Section III where we use the continuous approximation and simulations to analyze network statistics. The size constraints inherent in accelerating prokaryote regulatory networks are modelled in Section IV.
II Overview of prokaryote gene networks
Ongoing genome projects are now providing sufficient data to usefully constrain analysis of the gene regulatory networks of the simpler organisms. Ref. vanNimwegen_03_479 first noted the essentially quadratic growth in the class of transcriptional regulators () with the number of genes () in bacteria with the observed results
| (1) |
Here, the top two lines refer to different classes of regulators while the bottom two lines are the results of a crosschecking analysis of two alternate databases. Quoted intervals reflect 99% confidence limits vanNimwegen_03_479 . The explanation for this quadratic growth was that each additional transcription factor doubles the number of available dynamical states which, it was posited, allows for a doubling in the fixation probabilities for this class of genes.
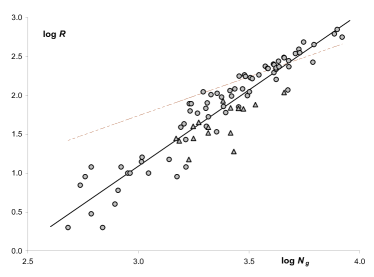
As noted above, Ref. Croft_03_unpub provides an alternate theoretical analysis predicting quadratic growth in any regulatory network exploiting homology dependent interactions and analyzed 89 bacterial and archeael genomes to determine the relations
| (2) |
In this paper, accelerating networks will be based on the quadratic second line (while nonaccelerating models presented in later work will work with the linear third line Gagen_0312022 ). In all cases, the limits reflect 95% confidence levels. For completeness, the data is shown in Fig. 1. The observed quadratic growth implies an ever growing regulatory overhead so there will eventually come a point where continued genome growth requires the number of new regulators to exceed the number of nonregulatory nodes, and based on this, Ref. Croft_03_unpub predicted an upper size limit of about 20,000 genes, within a factor of two of the observed ceiling.
Earlier surveys of bacterial genomes noted that larger genomes harboured more transcription factors per gene than smaller ones Cases_03_248 , with this trend attributed to the need in larger genomes for a more complex network of regulatory proteins to achieve coordinated expression of a larger set of cellular functions, and to selection in complex environments leading to enrichment in transcription factors allowing regulation of gene expression and signal integration. A similar upward trend in the proportion of regulators as a fraction of genome size with increasing genome size was observed in Ref. Stover_00_959 attributed to a need for an increasing responsiveness in diverse environments, with confirming observations in Ref. Bentley_02_141 .
Prokaryotes typically group their DNA encoded genes in operons, co-regulated functional modules of average size 1.70 genes each in E. coli which value we treat as typical though in reality, operon size decreases slightly with genome size Cherry_03_40 . Each operon can be either unregulated and so constitutively or stochastically expressed or subject to combinatoric regulation by multiple regulatory protein transcription factors binding to each operon’s promotor sequence.
Again assuming that E. coli is typical, any given regulatory protein affects an average of about 5 operons with this distribution being long tailed Shen_Orr_02_64 so the majority of regulators affect only one operon though some regulators (CRP) can affect up to 71 operons or 133 genes Thieffry_98_43 . (This latter reference estimated that each regulator controls on average 3 genes.) More recent estimates have the transcription factor CRP, a global sensor of food levels in the environment, regulating up to 197 genes directly and a further 113 genes indirectly via 18 other transcription factors MandanBabu_03_1234 . (To observe the long tailed distribution, see Fig. 2 of Ref. Thieffry_98_43 and Fig. 4 of Ref. MandanBabu_03_1234 .)
However, the number of inputs taken by an operon is characterized by a compact exponential distribution with a rapidly decaying tail so the majority of regulated operons are controlled by a single regulator while very few regulated operons are controlled by four, five, six or seven regulators Thieffry_98_43 ; Shen_Orr_02_64 ; MandanBabu_03_1234 . In particular, Ref. Thieffry_98_43 examined 500 regulatory links from about 100 regulators to almost 300 operons to estimate that each regulated operon takes on average 2 inputs though Fig. 2 of this reference suggests an average input number of about 1.5. Similarly, Ref. Shen_Orr_02_64 suggests that 424 regulated operons receive 577 links giving an average input number of 1.4, while Ref. MandanBabu_03_1234 estimates that 327 regulated operons receive 524 links giving an average input number of 1.6.
III Accelerating prokaryote network models
We extend the gene network model of Ref. Thieffry_98_43 to construct an accelerating network model of prokaryote regulatory gene networks. Prokaryotes typically pack their genes into a lesser number of co-regulated operons where we assume that operons contain exactly genes. Of the existing operons, are regulated operons and are unregulated operons. Of the total number of operons, there are regulatory operons whose regulatory interactions are directed links from regulatory operons to regulated operons. Under the assumption that there is only one regulatory gene per regulatory operon, the observed quadratic relation of Eq. 2 becomes
| (3) |
When regulators and regulatory links are very rare, i.e. when genomes are small, it is likely that every new link is associated with a new regulator so the number of links varies roughly quadratically with operon number. We write
| (4) |
where denotes the probability of forming a particular beneficial link per operon. The value for will be approximately , but the exact relation must be derived from the details of the implemented model.
Each regulatory link between nodes is directed, and characterized by two distinct distributions describing respectively the placement of the heads and tails of each link. Only a relatively few nodes are regulatory, and of these, the number of outbound link tails per regulatory node are described by a size dependent long-tailed distribution with average about . Such a long-tailed distribution requires that link tails be preferentially attached to an existing regulatory operon or equivalently, the associated regulated operon must possess one promotor binding site (among others) that binds that particular regulator. Consequently, the preferential selection of regulators means that the promotor sequences of newly regulated nodes cannot be randomly chosen—randomly drifting promotor sequences would be as likely to match any one regulator as another. A plausible physical explanation for the preferential attachment of link tails to existing regulators is that newly fixated operons come largely from gene duplication events Yanai_00_2641 where some of the duplicated promotor binding sites are under strong selective constraint while other binding sites and the operon genes can drift freely. Gene duplication then implies that in a genome of size operons, if some regulator has outbound regulatory links to approximately regulated operons, then the probability that a newly fixated operon is also regulated by is simply the proportion of such regulated operons in the genome, or . This implements the required preferential attachment as the resulting rate of growth in the number of links attached to node is also then proportional to . If there is also some probability of the appearance of novel promotor sequences, these combined processes suffice to produce the observed scale free distributions. This model is roughly consistent with recent estimates of the relative contributions to prokaryote genome growth which suggest that horizontal gene transfer rates are roughly one third of gene loss rates and roughly one half of vertical inheritance or gene genesis rates leading to roughly constant sized genomes over long times (as ), while “it is remarkable that phylogenetic distributions of at least 60% [and up to 75%] of protein families can be explained merely by vertical inheritance.” Kunin_03_1589 . Similarly, three quarters of examined transcription factors in Ref. MandanBabu_03_1234 were two-domain proteins with shared domain architectures leading to the estimate that about 75% of transcription factors have arisen as a consequence of gene duplication (though the joint duplication of regulatory regions and of regulated genes or of transcription factors together with regulated genes is more rare). A further implication of these gene duplication processes is that, in the main, regulators can only appear on entry to the genome—a potential regulator lacking any target matches in a given genome will never form any links when most operons arise from promotor preserving duplication events. This allows us to considerably simplify our model, and hereafter, we only allow regulators to appear on their entry to the genome. Of course, more realistic but considerably more complicated models are possible.
In contrast to the relatively small number of regulatory nodes, all nodes can themselves be regulated by inbound links and in fact, can be multiply regulated as promotor regions can contain more than one binding site. Further, the many used and unused promotor region binding sites broadly sample the space of possible binding sites so only a small fraction of nodes will be regulated by any one regulator. As a result, the number of inbound link heads per node is described by a size dependent exponential distribution with a low average of as typically results from the random or non-preferential attachment of inbound links to operon promotor sequences.

We suppose that the operon network grows by the sequential addition of numbered nodes for , and that at network size , node () has outbound tails and inbound heads. We do not model the many trials of potential genes over many generations and merely include fixated genes in our count—that is, drifting sequence is not counted as part of the fixated genome. This further implies the sequence of established nodes is under severe selective constraint and unable to drift so consequently new links cannot be added between existing nodes. (If a proportion of existing nodes can explore novel sequence space in time , then the number of new regulators increases as , and as is itself a function of time, this integrates to generate a non-quadratic relation between regulator and operon number which is not observed.)
For clarity, Fig. 2 preempts later calculations and depicts a statistically generated version of an E. coli genome where nodes are placed sequentially counterclockwise in a circle (for convenience only). Alternative genome models may be distinguished by the age distribution of regulators, regulated operons and their link numbers, and these are indicated in this figure. In particular, Fig. 2 shows a highly nonuniform distribution of regulators and outbound link numbers with gene age in contrast to a uniform distribution of regulated operons and of inbound link numbers. (It will turn out that these latter age-independent distribution are only present when regulator number grows quadratically with genome size.)
These distributions result from the physical processes underlying the formation of regulatory links in prokaryotes. As discussed above, a substantial proportion of the gene regulation network of prokaryotes is enacted via homology dependent interactions as when sequence specified protein transcription factors bind to specific promoter sequences. The undirected nature of evolutionary searches means that gene regulatory networks fundamentally exploit the same sequence matching algorithms used in comparative genetics where the probability of obtaining matches between a single given trial sequence of some small fixed length and an entire genome scales proportionately to genome length—doubling genome length doubles the probability of a match. Hence, the expected number of links formed per regulator scales linearly with present genome size. As the number of source trial sequences also scales with genome length, the expected number of matches between all regulators and all regulated operons scales quadratically with genome length, or effectively, with operon number assuming constant sized operons over the evolutionary record.
As a consequence, on entry into the genome, each new gene has some probability of being a regulator dependent firstly on its suitability to bind DNA and secondly on the linearly increasing expected number of acceptable binding targets present in the genome on entry (or at later times). As discussed above, the predominance of vertical gene genesis events allows a simplified model wherein the probability of a new node being regulatory is determined solely by the number of available links present at the time of entry. We assume then that on entry into the genome each new node can form links with nodes consisting of a single self-regulatory link from node to itself with probability , regulatory outbound links to the existing nodes each with equal probability , and, provided that sufficient regulators already exist, inbound regulatory links from some subset of the existing regulators chosen according to preferential attachment. (For consistency, we can only add distinct regulatory links to node provided there are at least this many regulators in existence. From Eq. 3, the average number of regulators must be greater than the number of regulatory links , and this will be satisfied for .) As a result, the total number of heads or tails attached to node on entry to the genome ranges between and , with each link formed with probability . Hence, the respective probabilities that the initial number of heads or the initial number of tails for node is
| (5) |
with the proviso that all the inbound links can only be added to node if there is a sufficient number of regulators among the nodes . The average number of inbound and outbound links is identical, showing linear growth in link number with increasing network size. The addition of node and its links will increase the probable number of heads attached to earlier nodes for so , while the probable number of tails outbound from node increases if and only if that node is regulatory with .
As regulators can only be created on entry to the genome, the distribution of regulators at any time is specified by the distribution for . Using Eq. 5, the probability that node is a regulator is , so for a network of nodes, the predicted total number of regulators is
| (6) | |||||
The exact top line shows the expected behaviour for the number of regulators in the respective limits giving , and giving . The approximate relation in the third line can be compared to the observed Eq. 3 and immediately suggests , while a fit to the more accurate top line gives the connection probability as
| (7) |
This probability value suggests an average promotor binding site length of bases. The average number of links per regulator using the second line of Eq. 6 is then approximately , while the more accurate top line with operons for E. coli Cherry_03_40 gives , about a factor of two from the observed value of for E. coli Shen_Orr_02_64 .
III.1 Random distribution of regulated operons
The distribution of link heads for all nodes (with possession of a link head designating a regulated node), can be straightforwardly calculated under the assumption that the new tails added with node are randomly distributed across the existing nodes so on average, each existing node receives links. To build insight, it is useful to consider the general case where for . Setting adds with some probability a constant number of links with each new node, adds a linearly growing number of probable links with each new node, adds a quadratically growing number of probable links with each new node, and so on. The total number of links present in the network is then
| (8) |
The continuous approximation Barabasi_99_17 ; Barabasi_99_50 ; Dorogovtsev_01_056125 for links randomly distributed over existing nodes determines the number of inbound head links for node according to
| (9) | |||||
This can be integrated with initial conditions at time and final conditions at time to give
| (10) |
Integration of these link numbers over all node numbers gives the required total number of links as in Eq. 8. For , the number of links per node is monotonically decreasing with node number. However, for and only in this case, the final distribution is independent of node number because earlier nodes receive exactly enough links from latter nodes to balance the initially biased distribution of heads , so in the end, all nodes receive on average the same number of inbound regulatory links for . For faster acceleration rates, , the number of links per node is monotonically increasing as later nodes receive a greater number of links on entry to the genome and this imbalance is not corrected.
The possibility of monotonically increasing numbers of links with node number in accelerating networks has not previously been considered. This possibility requires modifying the usual continuum approach Barabasi_99_17 ; Barabasi_99_50 ; Dorogovtsev_01_056125 so the final inbound link distribution is obtained via
| (11) | |||||
where is the solution of the equation . The top line is used when all nodes possess the same average link number while the second line is applicable with the plus (negative) sign when the average numbers of links per node is monotonically increasing (decreasing) with node number. Non-monotonic cases require alternate approaches.
Under quadratic growth in total link number when , and only in this case, the final distribution of link heads is independent of node number and evaluated using Eq. 11 to give
| (12) | |||||
As expected, a compact final link distribution results when all nodes have an average of inbound regulatory links at time . This distribution calculated under the continuous approximation equates to one where in reality, each node receives a controlling head with probability from every other node (though in practise, the total number of received links is of order unity). Hence, for any node in a network of size , the actual probability of having heads is
| (13) |
A network simulation with linear growth of link numbers per node model (Eq. 5) serves to validate this predicted final distribution. Fig. 3 compares the predicted distribution against observed distributions for typical simulated networks of various sizes with negligible discrepancies.
For a network of size , the probability that any given operon is unregulated is so the expected number of unregulated operons summed over all nodes is
| (14) |
This determines the number of regulated operons as
| (15) |
showing the expected behaviour as giving and giving as each of the sparsely distributed links hits a distinct regulated operon. We note that random gene duplication and deletion events will not change the distribution (other than changing ) as all nodes are identically connected on average. The distribution appears in Fig. 2 which shows a uniform (age-independent) distribution of regulated nodes over the genome, and this uniformity is only expected for corresponding to linear growth in link numbers per node and quadratic growth in regulator numbers.
These predictions can be compared to observation. For the E. coli network of size operons or 4289 genes Cherry_03_40 , the predicted proportion of regulated operons receiving inputs is
| (16) |
and is shown in Fig. 4. Here, the calculated distribution closely approximates the compact exponential distribution observed for E. coli shown in Fig. 2(d) of Ref. Cherry_03_40 and of Fig. 5 of Ref. MandanBabu_03_1234 , though it underestimates the numbers of regulated operons with 4, 5, 6 and 7 inputs—essentially no regulators are predicted to have 5 or more inputs for genomes of size operons. In addition, the average number of inbound regulatory links per operon (for all operons) is , while the average number of inbound regulatory links for regulated operons is . A more accurate calculation using the specific values for E. coli gives , very close to the E. coli value of 1.5 or 1.6 noted in Refs. Thieffry_98_43 ; Shen_Orr_02_64 ; MandanBabu_03_1234 .
III.2 Scale-free distribution of regulator operons
On entry into the genome, node sources on average outbound regulatory links and this linear growth in link number means that more recent nodes are more likely to be immediately regulatory and more likely to be highly connected on genome entry. However, node will also receive on average inbound regulatory links whose tails will be preferential attached to existing regulators. The final distribution of link number with age will depend on the rate at which earlier nodes under preferential attachment can attract links relative to the linearly increasing link numbers of later regulatory nodes.
On entry at time , node receives inbound links from existing regulatory nodes in the set . As previously, we gain insight by considering the general case where for (though we continue to use the distribution of Eq. 5 to determine both the number of links prior to exponentiation and regulatory probability so consequently the number of regulators continues to increase quadratically according to Eq. 6). As a result, the need to ensure that all regulatory links to node are distinct requires that new link number be less than the number of existing regulators requires . The new tails added with node are preferentially attached to the existing regulatory nodes with probability proportional to the number of existing regulatory links for that node at time , i.e. . Using the continuous approximation Barabasi_99_17 ; Barabasi_99_50 ; Dorogovtsev_01_056125 , the rate of growth in outbound link number for node is then approximately
| (17) |
The denominator here is a probability weighting to ensure normalization and is the total number of outbound links for all nodes. Following Dorogovtsev_02_10 , we can evaluate the denominator using the identity
| (18) |
This can be evaluated using Eq. 17 noting giving
| (19) |
which can be integrated determining the denominator of Eq. 17 to be
| (20) |
This is in agreement with Eq. 8. Substituting this value into Eq. 17 gives
| (21) |
Finally, this can be integrated with initial conditions at time and final conditions at time to give
| (22) |
Again we find that the respective choices and lead to monotonically decreasing and increasing numbers of links per node as a function of node number, while setting ensures the number of links per node is independent of node number. In this case, the preferential attachment of links to earlier nodes does indeed act to cancel the initial bias in link number towards later nodes. It is also apparent that when , the limit implies all nodes possess exactly links as expected for a fully connected regular network. (Preferential attachment cannot distort connectivity numbers in this case as all nodes have an equal number of links.) Additionally, in the limit we have as required for an entirely disconnected network. The case duplicates results found for growing networks which add a constant number of links with each new node subject to preferential attachment Albert_02_47 .
As previously, it is straightforward to calculate the final outbound link distribution in the case using Eq. 11. This gives
| (23) | |||||
Again, we find the expected compact distribution resulting when all nodes possess the same average number of links. This raises the question however, of how it is that a probabilistic accelerating network subject to preferential attachment can end up with all nodes possessing the same average number of links? The answer lies in our use of two classes of distinguishable nodes, regulators and non-regulators, which requires that we take into account the known distribution of regulators with node number over the genome. The average link number per node at node (Eq. 22) equates to the product of the average number of link tails per regulator at node , denoted , and the average number of regulators per node at node , denoted . This latter density is by Eq. 6, so by definition, we have
| (24) |
giving
| (25) |
Hence, for , the average number of links per regulator is a decreasing function of node number as the growing number of links added to recent nodes is insufficient to outweigh the effects of preferential attachment which more rapidly increases the number of links attached to early nodes. In particular, for with the addition of a linearly increasing number of links per node, the average number of regulatory links per regulator scales inversely with node number . In other words, the density of regulators is very low at small node numbers while the very few regulatory nodes in this stretch of the genome are heavily connected due to preferential attachment so as to maintain the constant average of Eq. 22. (See Fig. 2.)
The distribution contains information about both node connectivity and node age and so approximates genome statistics (simulated or observed) when all of this information is available. However, it is usually the case that node age information is unavailable necessitating calculation of connectivity distributions that are not conditioned on node age. This effectively requires binning together all nodes irrespective of their age to obtain a final link distribution. In the case of linearly growing number of links per node, , the delta function of Eq. 11 is resolved by the equality giving the final distribution as
| (26) | |||||
which, as required, is normalized as . The expected proportion of regulators possessing links is then obtained by integrating the continuous distribution of Eq. 26 over appropriate ranges or to obtain
| (27) |
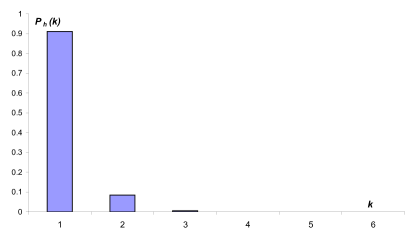
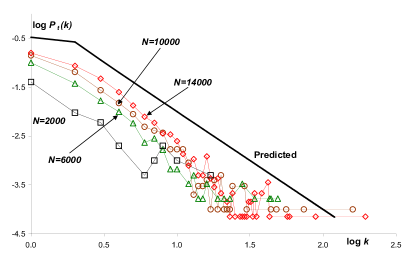
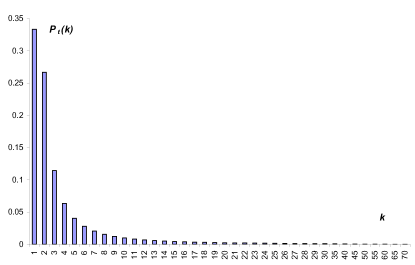
These theoretical predictions compare well to simulations of networks of various sizes with linearly increasing numbers of probable links per node and subject to preferential attachment. Fig. 5 shows simulated outbound link distributions which are long-tailed and scale free with probabilities scaling roughly as for large . The distribution shows a full one third of regulators have only one link, while 60% have two or fewer links, and 71% have three or fewer links. Fig. 6 shows the long-tailed distribution expected for a simulated E. coli network of operons with preferential attachment of links. This figure shows marked similarities to the long-tailed distribution of E. coli shown in Fig. 2(c) of Ref. Cherry_03_40 . In particular, the expected number of regulators with links is with the number of regulators obtained from Eq. 6 (or from observation). For E. coli, this predicts the probable existence of about one regulator possessing link numbers in each of the respective ranges between links, between links, between links, between links, and between links for instance. (This approximates the connectivity of the global food sensor CRP which regulates up to 197 genes directly MandanBabu_03_1234 .) The average of the distribution (as well as the distribution) is formally undefined as long as the integration limits are taken to infinity. However, in a network of nodes, a regulator can practically only regulate a total of nodes, and this cutoff allows us estimate the average connectivity per regulator (complementing previous estimates following Eq. 7). Using the cutoff and approximating the summation via an integral, the average connectivity per regulator in a network of nodes is
| (28) | |||||
(or simply using the continuous distribution of Eq. 26.) The average number of links per regulator for E. coli from Eq. 28 is (or 7.83 using the simpler derivation), which again compares well to the observed value of 5 in E. coli Shen_Orr_02_64 .
IV Inherent prokaryote size limits
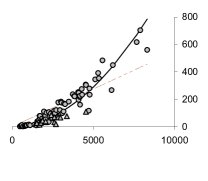
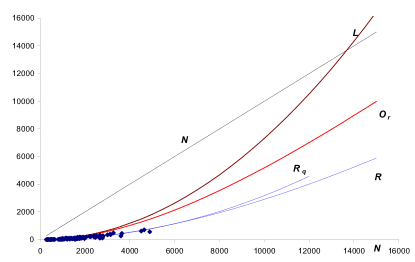
The accelerating nature of regulatory gene networks necessarily means that these networks must exhibit a transition at some critical network size either to a nonaccelerating architecture permitting continued growth or must cease growth entirely, and we now seek to predict the location of this transition point and compare it to the evolutionary record. We begin by examining an overview of the accelerating genome model. Fig. 7 shows that linear growth in link numbers per node () allows a quadratic growth in the total number of links (Eq. 4) despite each of the number of regulators (Eq. 6) and the number of regulated nodes (Eq. 15) asymptoting to some fraction of after an initial period of quadratic growth. For large genomes, almost all new nodes will be regulators and densely connected into the existing network which will then multiply regulate almost every node.
The transition from sparse to dense connectivity occurs as an increasing proportion of operons become linked into the regulatory network leading to the emergence of a single giant component of fully connected nodes. One way to highlight this transition is by determining the proportion of transcription factor which control downstream regulators as such linkages create the single giant component. The proportion of regulators controlling regulators is
| (29) | |||||
Here, the first fraction on the RHS normalizes the proportion in terms of the number of regulators (Eq. 6), the first term in the summation is the probability that node is a regulator, the second term is the average number of regulatory outbound links for this regulatory node at network size (Eq. 25 with ), and the third term approximates the probability that these nodes link to one of the existing regulators under random attachment. (If the very first and very last terms are dropped, the remaining summation over all nodes of the probability that is regulatory with the stated number of links equates to the total number of links in the network . This is the more accurate version of the calculation leading to Eq. 25.) Hence, the proportion of regulators which control transcription factors scales linearly with network size and equals 15% for an network, 29% for , 44% for , 59% for , 73% for , and 88% for operons (after which the approximations made break down). Naturally, when most regulators themselves control other regulators, then the entire regulatory network will consist of a single giant component. These ratios compare reasonably well with those observed in E. coli where Ref. MandanBabu_03_1234 noted that of 121 transcription factors for which one or more regulatory genes are known, 38 factors or 31.4% regulate other transcription factors. The approximate second line of Eq. 29 with for E. coli determines this proportion as while the more accurate top line gives the proportion of regulators which control transcription factors as , giving a reasonable match between prediction and observation.
As the proportion of regulators of transcription factors rises, the probable length of regulatory cascades will increase. In fact, the proportion of regulators taking part in a regulatory cascade of length is
| (30) |
This equation can be obtained from a tree of all binary pathways which at each branching point either terminate with probability or cascade with probability . As such, the probable cascade length is negligible when the proportion of regulators controlling regulators is small but can become large as itself increases. As is indeed large for networks of size , this again suggests that long cascades of regulatory interactions will lead to the coalescing of a single giant component in this regime. Again, the calculated lengths of regulatory cascades can be compared to those in E. coli where the number of cascades of regulated transcription factors observed in a particular set of regulatory interactions was 23 two-level cascades or 37.7%, 32 three-level cascades or 52.5%, and 6 four-level cascades or 9.8% MandanBabu_03_1234 . As one-level or autoregulatory interactions are not included in this observation, the predicted proportions for E. coli are with giving 82% two-level cascades, 15% three-level cascades, 3% four-level cascades, 1% five-level cascades, and so on. It is seen that the theoretical predictions overestimate the proportion of two-level cascades and underestimate the number of three-level and higher cascades probably because of selection pressures not included in the model. Lastly, we note that the number of cycles involving closed regulatory loops of size greater than one (i.e. involving more than autoregulation) in the examined portion of the E. coli regulatory network is zero reflecting that feedback loops in these organisms are carried out at the post-transcriptional level involving metabolites such as appear in the lac operon Thieffry_98_43 ; Shen_Orr_02_64 ; MandanBabu_03_1234 .
We note that our model is entirely unable to explain the high proportion of autoregulation observed in E. coli with various estimates that 28.1% Rosenfeld_02_785 , 50% Shen_Orr_02_64 and 46.9% Thieffry_98_43 of regulators are autoregulatory. The predicted proportion of autoregulators is approximated by replacing the very last fraction () in Eq. 29 by the term giving the probability that a self-directed link is formed, leading to the expected autoregulatory proportion for E. coli. This failure likely reflects the action of selection processes promoting spatial rearrangements of entire regulons on the genome and the internal shuffling of genes and promotor units. Such reorganizations of duplicated gene regions (presumably shuffling genes and promotor regions) have been common in E. coli allowing for instance, spatial regulatory motifs whereby the promotors of colocated (overlapping) and often co-functional operons transcribed in opposing directions can interfere Warren_03_0310029 .
The transition point from sparse to dense connectivity can be roughly located using the continuum approximation Barabasi_99_17 ; Barabasi_99_50 ; Dorogovtsev_01_056125 . These methods have not previously been used for this purpose (to our knowledge) and we first validate their use by deriving the known result that non-growing random graphs of nodes connected by an increasing number of undirected links undergo a phase transition from sparse to dense connectivity when Erdos_60_17 . As the number of links grows, the nodes are interlinked into firstly separate islands of size nodes for which eventually link up to form a giant component designated containing essentially all nodes . The largest component grows whenever a newly added link has either its head or tail in island (with probability ) and the other outside it (with probability ) leading to a size increment equal to the average size of the external islands (), giving
| (31) |
Numerical or analytic integration of this equation with initial conditions when and assuming the average size of external smaller islands is shows the largest island saturating the entire network when as expected. (This simple approach is indicative only and is quite sensitive to for instance, the assumed average size of external islands.)
This result suggests the following transition point in directed regulatory gene networks. Each undirected (i.e. bidirectional) link in random graph theory is equivalent to two directed links allowing bidirectional traffic between any two nodes, suggesting a transition point in directed graphs at roughly . This analysis suggests that the largest component is expected to saturate the entire network when link number or (see Fig. 7). In turn, this suggests that for a typical network likely consists of isolated trees, while if the network likely consists of a single giant cluster where almost every node is connected to all others via intermediate links. When the link number is very large, , then the network becomes regularly connected Albert_02_47 . As prokaryote regulatory networks likely consist of functionally distinct regulated modules Thieffry_98_43 ; Hartwell_99_c4 , it is unlikely that prokaryotic gene networks can successfully operate in the fully connected regime suggesting that prokaryote genome sizes are size constrained . In fact, the previously noted absence of regulatory cycles in E. coli Thieffry_98_43 ; Shen_Orr_02_64 ; MandanBabu_03_1234 likely reflects the evolutionary importance of maintaining disjoint and non-interfering regulatory units.
These results of random graph theory are suggestive only, and we now turn to consider the size of the largest connected island in prokaryote gene networks featuring directed links whose tails are preferentially attached to regulators and whose heads are randomly distributed over all existing nodes. A further difference is that prokaryote regulatory networks are themselves growing with each added node accompanied by a probabilistic number of links. In addition, we define an island to consist of all nodes which are linked regardless of the orientation of all links and so effectively treat links as being undirected. This is because a regulator can potentially perturb every node downstream to it including those nodes downstream of other regulators and so can modify the regulatory effects of other regulators—essentially, if the downstream effects of different regulators eventually intersect, we count these regulators in the same island. (Other definitions of islands could be used.)
The dominant (but not sole) mechanism by which island can grow is for the newly added node to either (a) be a regulator (with probability ) and establish an outbound regulatory link to some existing node in (with probability ) while at the same time accepting a regulatory link (with probability ) from a node in a different island (with probability ), or (b) accept an inbound regulatory link (with probability ) from a regulator in island (with probability ) while establishing a regulatory link (with probability ) to some node in a different island (with probability ). (Here, we assume that regulators are uniformly distributed over islands and the number of links within an island scales with the size of the island to crudely model preferential attachment.) The result is that island grows by the size of the second island assumed to be . Altogether, the rate of growth in the size of island is then
| (32) |
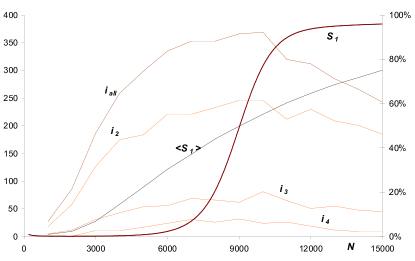
For initial conditions, we assume that a first link appears when the genome has nodes (). Simulations show that sufficient small islands are created to ensure remains roughly constant and equal to , though matching the simulated and predicted curves at the 50% point requires setting . This is reasonable given the approximations made. Fig. 8 shows the size of the largest island as a proportion of all nodes. A single giant component is expected to form at a critical genome size of operons defined as the point where the simulated proportion of nodes in the giant component is 50%. (Choosing a parameter setting of 40% would also be justifiable and would lead to an exact match between predicted and observed maxima.) Unlike random graph theory, this critical point applies to all growing genomes as it is determined by the value of the link formation probability . Genomes of smaller size than this critical value are expected to be sparsely connected so the network consists of multiple discrete connected islands (as in E. coli Thieffry_98_43 ), while genomes of larger size are expected to be densely connected into a single giant component where every regulator eventually perturbs the downstream effects of every other regulator.
Simulations of example genomes of various sizes spanning this critical network size confirm the adequacy of the continuum treatment. Fig. 8 shows the number of all discrete islands as well as the number of islands containing two, three and four components. In the vicinity of the critical genome size , the number of discrete interconnected islands begins to decline as the growing number of links connects more and more islands into the single giant component. The size of the simulated giant component as a proportion of genome size is also shown. This figure suggests that the E. coli genome of operons should possess a giant component containing about 5% of all nodes (about 100 nodes) which can be compared with the observation that about 70% or 300 operons of the examined regulatory and regulated operons (but not including unregulated and nonregulatory operons) could be loosely grouped into 3-6 “dense overlapping regulons” or DORS while the remaining operons appeared as disjoint systems with most containing 1-3 operons but some containing up to 25 operons Shen_Orr_02_64 .
The critical network size of operons or about genes corresponds to the point where growing regulatory networks exploiting accelerating links can no longer maintain discrete functional units, islands, of interconnected nodes. Larger genomes are densely connected into a single giant component where, eventually, any regulator can perturb the downstream effects of every other node so for instance, it is unlikely that the discrete network motifs found in the E. coli regulatory network Shen_Orr_02_64 can survive in this regime. This massive increase in perturbative effects immeasurably increases the difficulty of the evolutionary search process, leading to an expectation that the rate of evolutionary change will drastically slow when growing genome sizes reach criticality . From a biological point of view, it is relatively easy to understand why the critical network size acts as an upper size limit. The accelerating nature of the prokaryote regulation network means that larger networks can add new nodes only be integrating an increasing number of links to gain evolutionary benefits. Of course, the probability of finding beneficial links is a rapidly decreasing function of . It is relatively easy to find a beneficial regulator making only of order one link to existing genes (only billions of trials are needed say), but much harder when the regulator is making an average of five links with existing genes (many trillions of trails are needed). Essentially, the more links that must be beneficially integrated, the longer the evolutionary search task and the slower the rate of evolutionary change.
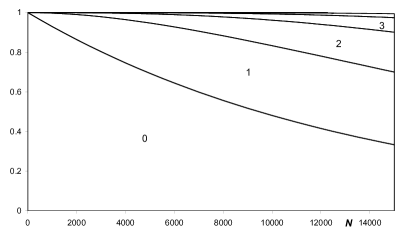
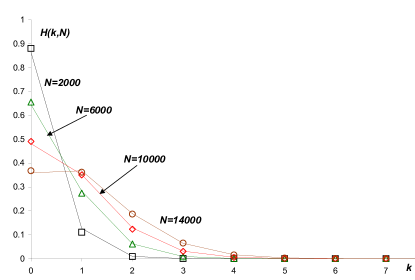
Many other statistical measures suggest that the regulatory mechanisms optimized to perform in a sparsely connected network will not necessarily operate in a densely connected network—evolution cannot foresee later needs. In particular, the proportion of operons which are regulated by inputs is, using Eq. 13, given by
| (33) |
This distribution increases with increasing network size and is shown in Fig. 9 making it clear that small networks mainly possess operons which are either entirely unregulated or regulated by only one or a few regulators. In contrast, large networks () have only a small proportion of operons which are unregulated while the majority of operons take between one or more regulatory inputs. It is a more difficult evolutionary task to integrate many inputs to achieve a beneficially regulated output again suggesting that prokaryote regulatory networks featuring accelerating growth in link number are size limited due to their regulatory architecture.
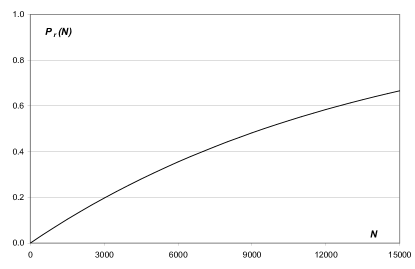
Another way to suggest the strict size limits imposed by the accelerating growth of regulatory links is to consider the probability that the most recently added node in a network of size immediately becomes regulatory. Using Eq. 5, node is a regulator with probability
| (34) |
This probability tends to unity as network size increases, and in particular, surpasses about 50% when networks consist of operons—see Fig. 10. At about this stage, large networks cannot add a new node without it having a significant probability of modifying the dynamics of existing nodes. This immeasurably increases the difficulty of the evolutionary task and again suggests a maximum size limit to prokaryote gene regulatory networks.
If the accelerating regulatory networks of prokaryotes were able to operate in the densely connected regime, the evolutionary record might be expected to show prokaryotes of arbitrarily large genome size with a transition in connectivity statistics at some critical genome size of about . Conversely, should these regulatory networks be unable to operate in the densely connected regime, then the evolutionary record should show a maximum size limit to prokaryote genome sizes of about operons or about genes, close to the observed upper limit.
V Conclusion
In this paper, we generalize models of accelerating networks by including probabilistic links to allow arbitrarily rapid acceleration rates leading to structural transitions in growing networks sometimes severe enough to strictly constrain network size. These structural transitions from sparse to dense connectivity are made more difficult by any additional steric or logical limitations on combinatoric control at any given promotor. Such transitions are in sharp contrast to the stationary statistics and unbounded growth potential of non-accelerating scale free and exponential networks. These probabilistic accelerating networks were applied to model prokaryote regulatory networks which exploit a quadratic growth in the number of regulators and regulatory links with genome size as established via comparative genomics programs. Our models predict a maximum genome size of operons or about genes for prokaryotes, closely approximating the observed maximum. We further validated our model by making a detailed comparison of predicted and observed results for E. coli, and achieved satisfactory matches for respectively, the number of observed regulators, an average promotor binding site length of about 7, the long tailed distribution of outgoing regulatory links with an average of between 2.12 and 7.51 (compared to 5), the exponential distribution of incoming regulatory links with an average of around 1.10 (compared to 1.5), the proportion of regulators controlling regulators of around 17.7% (compared to 31.4%), and the probable length of regulatory cascades and the absence of regulatory loops. Our approach is unable to explain the high proportion of autoregulation observed in E. coli Shen_Orr_02_64 and this failure likely points to selection for genome reorganizations leading to spatial arrangements of operons allowing joint regulation Warren_03_0310029 which is not included in this model. Further, this approach does not include selection pressures ensuring that similarly regulated islands or modules share common functionality Shen_Orr_02_64 , or other regulatory mechanisms influencing both the transcription and translation of transcription factors including micro-RNAs and other chemical mechanisms and mediators (see for instance Vogel_03_6435 ).
However, the many successes of the accelerating network model of prokaryote regulatory networks are meaningless if similar results can be achieved via non-accelerating network models. In later work, we will show that the two simplest non-accelerating network models fail to explain either the observed quadratic growth of regulator number with genome size or the detailed statistics pertaining to the E. coli genome Gagen_0312022 . In addition, the simplifying assumption adopted here that gene duplications ensure that operons become regulatory only on entry to the genome will be dropped in later work. This will develop a more realistic model including separate physical processes for transcription factor binding to DNA and for establishing regulatory links with regulated operons where links can form at any time.
This work has wider significance due to the still common presumption in molecular biology that “What was true for E. coli would also be true for the elephant” capturing the notion that the mechanisms operating in prokaryotes are exactly identical to those operating in complex multicellular eukaryotes. In this picture, eukaryotes are merely enlarged prokaryotes. The results of this paper indicate that this is not possible—the accelerating nature of regulatory networks necessarily implies that eukaryotes cannot be scaled up prokaryotes and that the (likely) accelerating regulatory networks of eukaryotes must be exploiting novel regulatory mechanisms. The successful modelling of these mechanisms will likely require incorporating computationally complex technologies Mattick_01_1611 ; Mattick_01_986 ; Mattick_03_930 into an accelerating network model, and this also will be addressed in later work.
References
- (1) S. N. Dorogovtsev and J. F. F. Mendes. Evolution of networks. Advances in Physics, 51(4):1079–1187, 2002.
- (2) R. Albert and A. L. Barabási. Statistical mechanics of complex networks. Reviews of Modern Physics, 74:47–97, 2002.
- (3) M. Faloutsos, P. Faloutsos, and C. Faloutsos. Power-law relationships of the Internet topology. In L. Chapin, J. P. G. Sterbenz, G. Parulkar, and J. S. Turner, editors, Proceedings of the Conference on Applications, Technologies, Architectures, and Protocols for Computer Communication, pages 251–262, New York, 1999. ACM Press.
- (4) A. Vásquez. Large-scale properties and dynamical properties of the Internet. Physical Review E, 65(5):066130, 2002.
- (5) H. Jeong, B. Tombor, R. Albert, Z. N. Oltvai, and A.-L. Barabási. The large-scale organization of metabolic networks. Nature, 407:651–654, 2000.
- (6) S. N. Dorogovtsev and J. F. F. Mendes. Scaling behaviour of developing and decaying networks. Europhysics Letters, 52(1):33–39, 2000.
- (7) A. Vásquez. Knowing a network by walking on it: Emergence of scaling. Eprint cond-mat/0006132, 2000.
- (8) A. L. Barabási, H. Jeong, Z. Néda, E. Ravasz, A. Schubert, and T. Vicsek. Evolution of the social network of scientific collaborations. Eprint cond-mat/0104162, 2001.
- (9) A. L. Barabási, H. Jeong, Z. Néda, E. Ravasz, A. Schubert, and T. Vicsek. Evolution of the social network of scientific collaborations. Physica A, 311:590–614, 2002.
- (10) A. Vásquez. Growing network with local rules: Preferential attachment, clustering hierarchy, and degree correlations. Physical Review E, 67(5):056104, 2003.
- (11) S. N. Dorogovtsev and J. F. F. Mendes. Language as an evolving word web. Proceedings of the Royal Society of London B, 260:2603–2606, 2001.
- (12) S. N. Dorogovtsev and J. F. F. Mendes. Effect of the accelerating growth of communications networks on their structure. Physical Review E, 63:025101(R), 2001.
- (13) P. Sen. Accelerated growth in outgoing links in evolving networks: Deterministic vs stochastic picture. 2003. arXive:cond-mat/0310513. See http://arxiv.org/abs/cond-mat/0310513.
- (14) M. J. Gagen and J. S. Mattick. Inherent limitations of “accelerating” networks in biology and society. In Preparation, 2003.
- (15) D. J. Watts. Networks, dynamics, and the Small-World phenomenon. American Journal of Sociology, 105(2):493–527, 1999.
- (16) E. van Nimwegen. Scaling laws in the functional content of genomes. Trends in Genetics, 19(9):479–484, 2003.
- (17) L. J. Croft, M. J. Lercher, M. J. Gagen, and John S. Mattick. Is prokaryotic complexity limited by accelerated growth in regulatory overhead? arXive:q-bio.MN/0311021. See http://arxiv.org/abs/q-bio.MN/0311021, 2003.
- (18) S. Casjens. The diverse and dynamic structure of bacterial genomes. Annual Review of Genetics, 32:339–377, 1998.
- (19) International Human Genome Sequencing Consortium. Initial sequencing and analysis of the human genome. Nature, 409(6822):860–921, 2001.
- (20) J. C. Venter, et al. The sequence of the human genome. Science, 291(5507):1304–1351, 2001.
- (21) Z. Liu, Y.-C. Lai, and N. Ye. Statistical properties and attack tolerance of growing networks with algebraic preferential attachment. Physical Review E, 66:036112, 2002.
- (22) K.-I. Goh, B. Kahng, and D. Kim. Fluctuation-driven dynamics of the Internet topology. Physical Review Letters, 88(10):108701, 2002.
- (23) X. Cheng, H. Wang, and Q. Ouyang. Scale-free network model of node and connection diversity. Physical Review E, 65:066115, 2002.
- (24) A. Wagner. How to reconstruct a large genetic network from gene perturbations in fewer than easy steps. Bioinformatics, 17(12):1183–1197, 2001.
- (25) A. Bhan, D. J. Galas, and T. G. Dewey. A duplication growth model of gene expression networks. Bioinformatics, 18(11):1486–1493, 2002.
- (26) A. V. Lukashin, M. E. Lukashev, and R. Fuchs. Topology of gene expression networks as revealed by data mining and modeling. Bioinformatics, 19(15):1909–1916, 2003.
- (27) M. J. Gagen and J. S. Mattick. Failed “nonaccelerating” models of prokaryote gene regulatory networks. 2003. arXive:q-bio.MN/0312022. See http://arxiv.org/abs/q-bio.MN/0312022.
- (28) I. Cases, V. de Lorenzo, and C. A. Ouzounis. Transcription regulation and environmental adaptation in bacteria. Trends in Microbiology, 11(6):248–253, 2003.
- (29) C. K. Stover, et al. Complete genome sequence of Pseudomonas aeruginosa PAO1, an opportunistic pathogen. Nature, 406(6799):959–964, 2000.
- (30) S. D. Bentley, et al. Complete genome sequence of the model actinomycete Streptomyces coelicolor A3(2). Nature, 417(6885):141–147, 2002.
- (31) J. L. Cherry. Genome size and operon content. Journal of Theoretical Biology, 221:401–410, 2003.
- (32) S. S. Shen-Orr, R. Milo, S. Mangan, and U. Alon. Network motifs in the transcriptional regulation network of Escherichia coli. Nature Genetics, 31:64–68, 2002.
- (33) D. Thieffry. From specific gene regulation to genomic networks: A global analysis of transcriptional regulation in Escherichia coli. BioEssays, 20(5):433–440, 1998.
- (34) M. Madan Babu and S. A. Teichmann. Evolution of transcription factors and the gene regulatory network in Escherichia coli. Nucleic Acids Research, 31(4):1234–1244, 2003.
- (35) I. Yanai, C. J. Camacho, and C. DeLisi. Predictions of gene family distributions in microbial genomes: Evolution by gene duplication and modification. Physical Review Letters, 85(12):2641–2644, January 2000.
- (36) V. Kunin and C. A. Ouzounis. The balance of driving forces during genome evolution in Prokaryotes. Genome Research, 13:1589–1594, 2003.
- (37) A. L. Barabási, R. Albert, and H. Jeong. Mean-field theory for scale-free random networks. Physica A, 272(1-2):173–187, 1999.
- (38) A. L. Barabási and R. Albert. Emergence of scaling in random networks. Science, 286:509–512, 1999.
- (39) S. N. Dorogovtsev and J. F. F. Mendes. Scaling properties of scale-free evolving networks: Continuous approach. Physical Review E, 63:056125, 2001.
- (40) N. Rosenfeld, M. B. Elowitz, and U. Alon. Negative autoregulation speeds the response times of transcription networks. Journal of Molecular Biology, 323:785–793, 2002.
- (41) P. B. Warren and P. R. ten Wolde. Statistical analysis of the spatial distribution of operons in the transcriptional regulation network of Escherichia coli. q-bio.MN/0310029 (http://arxiv.org/abs/q-bio.MN/0310029), 2003.
- (42) P. Erdös and A. Renyi. On the evolution of random graphs. Publication of the Mathematical Institute of the Hungarian Academy of Science, 5:17–61, 1960.
- (43) L. H. Hartwell, J. J. Hopfield, S. Leibler, and A. W. Murray. From molecular to modular cell biology. Nature, 402 (Supp):C47–C52, 1999.
- (44) J. Vogel, V. Bartels, T. H. Tang, G. Churakov, J. G. Slagter-Jäger, A. Hüttenhofer, and E. G. H. Wagner. RNomics in Escherichia coli detects new sRNA species and indicates parallel transcriptional output in bacteria. Nucleic Acids Research, 31(22):6435–6443, 2003.
- (45) J. S. Mattick and M. J. Gagen. The evolution of controlled multitasked gene networks: The role of introns and other noncoding RNAs in the development of complex organisms. Molecular Biology and Evolution, 18(9):1611–1630, 2001.
- (46) J. S. Mattick. Non-coding RNAs: The architects of eukaryotic complexity. EMBO Reports, 2(11):986–991, 2001.
- (47) J. S. Mattick. Challenging the dogma: The hidden layer of non-protein-coding RNAs in complex organisms. BioEssays, 25:930–939, 2003.