Dynamic receptor team formation can explain the high signal transduction gain in E. coli
Abstract
Evolution has provided many organisms with sophisticated sensory systems that enable them to respond to signals in their environment. The response frequently involves alteration in the pattern of movement, either by directed movement, a process called taxis, or by altering the speed or frequency of turning, which is called kinesis. Chemokinesis has been most thoroughly studied in the peritrichous bacteria Escherichia coli, which has 4 helical flagella distributed over the cell surface (Turner et al. 2000), and swims by rotating them (Berg Anderson 1973).
When rotated counterclockwise (CCW) the flagella coalesce into a propulsive bundle, producing a relatively straight “run”, and when rotated clockwise (CW) they fly apart, resulting in a “tumble” which reorients the cell with little translocation (Berg Brown 1972, Mcnab Orston 1977, Turner et al. 2000). A stochastic process generates the runs and tumbles, and in a chemoeffector gradient runs that carry the cell in a favorable direction are extended. The cell senses spatial gradients as temporal changes in receptor occupancy and changes the probability of CCW rotation (the bias) on a fast time scale, but adaptation returns the bias to baseline on a slow time scale, enabling the cell to detect and respond to further concentration changes (Block et al. 1982, Segall et al. 1986). The overall structure of the signal transduction pathways is well-characterized in E. coli, but important details are still not understood. Only recently has a source of gain in the signal transduction network been identified experimentally, and here we present a mathematical model based on dynamic assembly of receptor teams that can explain this observation.
E. coli has five receptor types, but most is known about the aspartate receptor Tar, which communicates with the flagellar motors via a phosphorelay sequence involving the CheA, CheY, and CheZ proteins. CheA, a kinase, first autophosphorylates and then transfers its phosphoryl group to CheY. CCW is the default state in the absence of CheY, which binds to motor proteins and increases CW rotation. Ligand binding to Tar reduces the autophosphorylation rate of CheA and the rate of phosphotransfer, and thereby increases the bias. This is the excitation component of the response. Bacteria also adapt to constant stimuli, and this is effected by changes in the methylation state of Tar. Tar has four residues that are reversibly methylated by a methyltransferase, CheR, and demethylated by a methylesterase, CheB. CheR activity is unregulated, whereas CheB, like CheY, is activated by phosphorylation via CheA. Thus, the receptor methylation level is regulated by feedback signals from the signaling complex, which can probably shift between two conformational states having different rates of CheA autophosphorylation. Attractant binding and demethylation shift the equilibrium toward a low activity state of CheA, and attractant release and methylation shift the equilibrium toward a high activity state. These key steps, excitation via reduction of the autophosphorylation rate of CheA when Tar is occupied, and adaptation via methylation of Tar, have been incorporated in mathematical models of signal transduction (Spiro et al. 1997, Barkai Leibler 1997, Morton-Firth et al. 1999).
E. coli can sense and adapt to ligand concentrations that range over five orders of magnitude (Bourret et al. 1991). In addition, the transduction pathway from an extracellular ligand to the flagellar motor is exquisitely sensitive to chemical stimuli. Bacteria can detect a change in occupancy of the aspartate receptor as little as , corresponding to the binding of one or two ligand molecules per cell. The gain of the system, calculated as the change in rotational bias divided by the change in receptor occupancy, was found to be about (Segall et al. 1986), and a long-standing question is what the source of this high sensitivity or gain is. Three main sources of gain have been suggested: (i) highly cooperative binding of CheY to the motor proteins, (ii) regulation of CheZ activity , and (iii) indirect activation of many receptors by a ligand-bound receptor. However, it is known that the high sensitivity is present in CheZ mutants (Kim et al. 2001), thereby ruling our the second possibility. Furthermore, it was shown that in the absence of cooperativity in signal transduction upstream of the motor, a Hill coefficient of at least was needed in the response of the motor to CheY to explain the observed gains of (Spiro et al. 1997). Cluzel at al. (2000) have confirmed this prediction experimentally, showing that the apparent Hill coefficient in the functional dependence of the bias on CheY is about . However, this cannot account for all the observed gain, and Sourjik and Berg (2002) have shown, using fluorescence resonance energy transfer, that the stage between aspartate binding and CheY concentration has an amplification times greater than expected. None of the existing models of the full signal transduction system (Spiro et al. 1997, Barkai Leibler 1997, Morton-Firth et al. 1999) address this source of gain.
Receptor interaction, either directly via clustering, or indirectly via an intracellular signal, is a likely source of the upstream component of the gain. Receptors are normally dimeric, and it has been suggested that ligand binding affects the spatial packing of the receptor array (Levit et al. 1998, Parkinson J. S., University of Utah, personal communication, 1999). Recent experiments show that transmembrane signaling occurs via receptor clusters or teams, probably of trimers of dimers (Ames et al. 2002, Kim et al. 2002). It was previously suggested in analogy with Ising models that clustering may enhance the sensitivity at low signals, but it is difficult to obtain both high gain and a wide dynamic range in models of this type (Bray et al. 1998). Moreover, while these types of models address the possibility of cooperative interaction as a mechanism for generating gain, the nature of this interaction is not specified and thus experimental tests are difficult. More recently an abstract model based on the energetics of interactions between receptors was proposed and analyzed by Mello Tu (2003). The model assumes that each receptor dimer can be in an active or inactive state, and that transitions between these states are rapid compared to ligand binding. Thus receptors flicker ‘on’ and ‘off’ between these states, according to an equilibrium distribution, and ligand binding biases the proportions in the two states. Parameters can be found so that the model reproduces existing data, but again there is no molecular mechanism that can be tested. Our goal here is to provide a more mechanistically-based description of the origin of high gain. The model is based on the idea that teams of receptor dimers assemble and dis-assemble dynamically, and that different types of receptors can assemble in different types of teams. In our analysis assembly and dis-assembly may occur on comparable time scales, but a static scheme in which teams exist for long time periods is a limiting case of the model.
Before describing the model, we observe that the large gain upstream of the motor can be qualitatively understood, once the experimentally-determined activity curves are known. The output of the signal transduction network as a function of attractant concentration has been studied in several recent experiments, both in vitro (Li Weis 2000, Bornhorst Falke 2001, Levit Stock 2002) and in vivo (Sourjik Berg 2002). In vitro experiments use receptor-CheW-CheA complexes reconstituted in the presence of attractant and measure the CheA activity immediately after the addition of ATP (Li Weis 2000, Bornhorst Falke 2001, Levit Stock 2002). The in vivo experiment of Sourjik Berg (2002) follows the immediate changes in CheY dephosphorylation after step changes in attractant concentration. These experiments show that the measured decrease of the CheA activity with increasing attractant concentration is functionally similar, but not identical, to the decrease of the ligand-free receptor concentration. The experimental curves of kinase activity as a function of ligand concentration can be fitted with Hill functions of the form
| (1) |
where represents the measured activity of the network, is the maximal activity in the absence of ligand, is the fraction of activity suppressed by ligand binding, is the ligand concentration, and is the ligand concentration that produces half-maximal activity. If we assume that there is no interaction between receptors, the fraction bound with ligand is
| (2) |
where is the inverse of the affinity for ligand and is the fraction of receptors free of ligand. If there are only two possible states of the receptor complex, free and ligand-bound, and only the former lead to autophosphorylation of CheA and a measurable activity, then the activity would have the functional form . However, the experimental observations indicate a more complex relationship, in that can be either larger or smaller than and the Hill coefficient can be between and (see Li Weis 2000, Bornhorst Falke 2001, Sourjik Berg 2002, Levit Stock 2002).
If the activity is given in the form at (1), we can compute the relative change in activity and the relative change in receptor occupancy for a small change in ligand concentration. Then the gain, which we define as the ratio of relative changes, is given by
| (3) |
and this is monotone increasing with . Thus high amplification is always possible for a sufficiently large ligand concentration, e.g. , and this conclusion holds even if the ligand occupancy has a more complicated dependence on , as long as it approaches one for large . The explanation of the high amplification is clear from (3): at high ligand concentrations the fraction of the activity suppressed approaches one, whereas the fraction of receptors free of ligand approaches zero. Thus the existence of high gain near saturation follows from the functional form of the input-output relation of the upstream signal transduction network, and even the simplest assumption of output proportional to leads to high amplification for large compared to . Accordingly, the objective of a model should be to predict the maximal activity , the apparent dissociation constant and the Hill coefficient .
It is found experimentally that , and depend on the methylation state of the receptors and the presence or absence of the methyltransferase CheR and the methylesterase CheB. increases with the methylation level of the receptors and varies approximately 30-fold (Li Weis 2000, Bornhorst Falke 2001, Sourjik Berg 2002). also increases with methylation state, and varies over two orders of magnitude (Li Weis 2000, Bornhorst Falke 2001, Sourjik Berg 2002, Levit Stock 2002), which implies that the simplest assumption that ligand-free receptors determine the output is not valid (Levit Stock 2002). The Hill coefficients of the output curves obtained in different experiments vary between and , and depend very weakly on the methylation level. In vivo experiments also suggest that CheR and CheB have a direct effect on the network output, in addition to determining the methylation state of the receptors, because the CheR and CheB single mutants show a qualitatively different response than CheRCheB mutants with fixed methylation states (Sourjik Berg 2002).
Our objective here is to propose a mechanism, based on receptor clustering to form active teams, that can reproduce the methylation-induced variability in the network output. There are several recent indications that the receptor-CheW-CheA complexes are not static and do not have a one-to-one stoichiometry, as assumed previously. Instead, an oligomer of multiple receptor dimers, including different types of receptors, forms the core of an active signaling complex (Ames et al. 2002, Francis et al. 2002). Since chemotaxis receptors tend to be clustered at one end of a bacterium (Maddock Shapiro 1993), we assume that individual homodimers exist in a dynamic equilibrium among singles, teams of two (twofolds), and teams of three (threefolds), and that the distribution among st these states depends on the ligand concentration. Our central hypothesis is that only threefolds can form complexes with CheW and CheA and activate the autophosphorylation of CheA. Because the experimental results we set out to explain all focus on the initial changes in kinase activity, we do not consider the slower methyl-transfer reactions. Since phosphotransfer from CheA to CheY is faster than the autophosphorylation of CheA, the concentration of phospho-CheY is proportional to the concentration of phospho-CheA, and the output of the network is taken to be proportional to the concentration of ligand-free threefolds in the model.
The Model
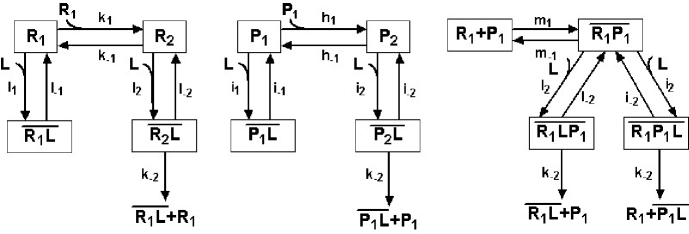
The basic units of the model are receptor dimers, and we first restrict attention to the inter-dimer association/dissociation and the ligand-binding and release reactions for a single receptor type. Homodimers are denoted by twofolds by , and threefolds by (see Figure 1). Receptor teams can have as many ligand-bound states as there are receptor dimers in the team. For example, the state contains a single ligand-bound receptor, while has two ligand-bound receptors, one on each dimer. We do not consider the state in which two ligand molecules are bound to a homodimer because this is energetically unfavorable. We assume that the ligand binding affinity of ligand-free homodimers in a team is the same regardless of the binding state of other homodimers in the same team222The proportionality factors and in the ligand-binding reactions arise from combinatorial effects.. We allow for the possibility that dimers in receptor teams do not have the same affinity for ligand as single receptor dimers (i.e. and can be different than ). We assume that both ligand-free and ligand-bound receptor dimers can associate to form teams, possibly with different rates i.e. and can be either equal or different.
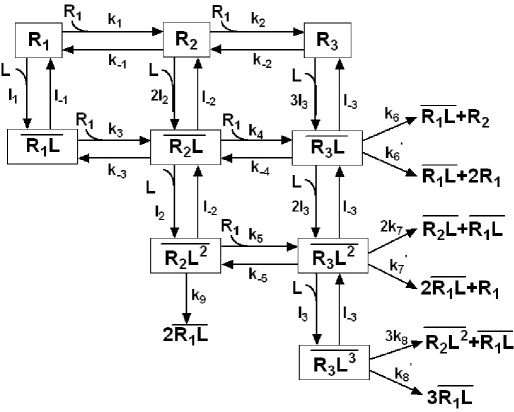
The main assumption of our model is that ligand binding destabilizes receptor teams and consequently they break into smaller units. We allow for every combination of resulting components, but assume that receptors will not release their ligands in the process (see Figure 1). In our model only the ligand-free threefolds lead to CheA activation. As a result, kinase activity is proportional to the concentration of , and its predicted dependence on ligand concentration can be compared with the experimental results on kinase activity.
The kinetic equations for the ligand-free states in Figure 1 are as follows; equations for the remaining states can be derived assuming mass-action kinetics.
| (4) | ||||
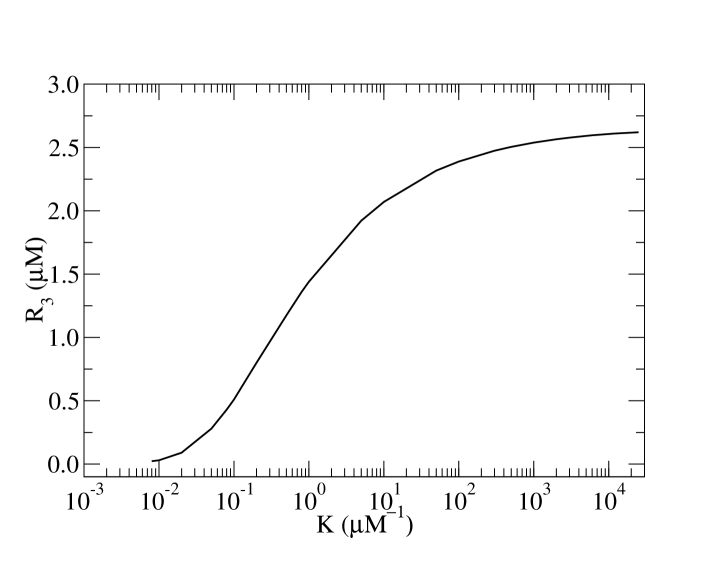
If we define the equilibrium constant (), for the formation of twofolds (resp., threefolds); then at satisfies the equation
| (5) |
where is the total receptor concentration fixed at . This equation has a unique positive root that tends to zero as and/or tend to zero, approaches its maximum as and/or tend to infinity, and increases monotonically between these limits along any ray in the plane. Since the rates of team association/dissociation are not known, we assume that and choose the individual rates accordingly. Then is completely determined by for fixed , and varies with as shown in Figure 2.
There is a close parallel between Figure 2 and the experimental observations regarding the dependence of the ligand-free output, , on the methylation state of the receptors. The output of the model, , increases with the team formation constant in a very similar way to the increase of with methylation. Notice that the nonlinear increase of can explain both the observation that the lowest methylation state’s activity is only a fraction of the activity of the wild type (Sourjik Berg 2002) and the result that the activity of the higher methylation states is very close (Levit Stock 2002). Based on this parallel, we identify different methylation states with different choices for the parameter , and we choose these values such that the ligand-free activities corresponding to these values have approximately the same proportions as the experimental measurements of Bornhorst and Falke (Bornhorst Falke 2001). Thus we identify the unmethylated (EEEE) state with and the totally methylated (QQQQ) state with the saturation limit . Bornhorst and Falke constructed engineered states corresponding to all the possible combinations of glutamate (E) and glutamine (Q) residues. Based on their results, and similarly to other models (Spiro et al. 1997, Barkai Leibler 1997, Morton-Firth et al. 1999) we assume that the total methylation level is the crucial characteristic of a given state, and not the exact residues that are methylated. We choose the team formation constants for partially methylated states as follows: methylation level one (e.g. EEEQ) , methylation level two (e.g. QEQE) and methylation level three (e.g. QQQE) .
In order to compare our results with the experimental results in Bornhorst Falke (2001) and Sourjik Berg (2002), we assume that the receptor is Tar and that the ligand is methyl-aspartate. It is known that the affinity of Tar to methyl-aspartate is about ten times less than to aspartate; therefore, we assume that the ligand release rate of a single receptor dimer is ten times larger than the release rate of aspartate, which is , while the ligand binding rate is the same as the binding rate to aspartate, which is (Spiro et al. 1997). Correspondingly, we assume , . We assume that the ligand release rates of receptor twofolds and threefolds are the same as the release rate of a single receptor dimer, i.e. .
We consider that the association rate of with is slightly smaller than the association between two s, and the dissociation rate of is proportionally smaller than the dissociation rate of , such that the ratios and are equal. Thus we choose the rates to be , , and we vary and according to for , such that corresponds to the different methylation levels described above.
As there is no information about the relative rates with which free or ligand bound receptor dimers associate/dissociate, we assume that the ligand binding state does not influence team formation and therefore , and , . For the breakdown of ligand-bound threefolds we consider that processes involving a single dissociation are equiprobable, i.e. , while the processes involving two dissociations are less likely, .
First we assume that the ligand binding rate of dimers that are part of receptor teams is the same as the ligand binding rate of separate receptor dimers, i.e., . Figure 3 shows the steady-state value of as a function of the ligand concentration for four different values corresponding to four methylation levels. These curves are obtained by solving the entire system of steady-state equations using the software package AUTO (Doedel 1981). All curves can be fit with Hill functions of the form (1), wherein .
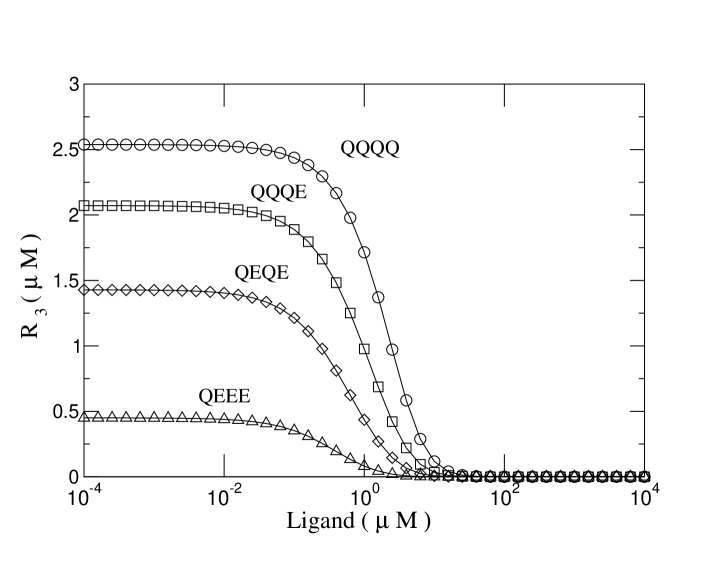
This figure captures many features of the experimentally-observed decay in kinase activity for increasing ligand concentrations. The curves are in qualitative agreement with those reported in Li Weis (2000), Bornhorst Falke (2001), Sourjik Berg (2002), and Levit Stock (2002); the apparent increases consistently with methylation level while the Hill coefficient does not. Thus our scheme provides a possible explanation for the apparent dependence of the receptor affinity on the receptor methylation level. We do not change the true affinity for ligand, but varying the affinity of receptor dimers for other receptor dimers leads to the differential response of kinase activity to ligand. Unfortunately, the values predicted by the model are lower than the experimental results obtained for CheRCheB mutants, and the range of their variation is also much smaller. Note, however, that the wild type response measured by Sourjik and Berg (2002) exhibits a small , close to our result of .
It is easily seen that the larger values observed in experiments on CheRCheB mutants could be explained by assuming that receptor teams have a lower affinity for ligand than individual receptor dimers. The cause of this lowered affinity could be the close proximity of receptors in teams. To illustrate this case we consider , while keeping all other parameters at their previous values. The resulting activity curves as a function of the ligand concentration are shown in Figure 4.
These curves agree well with the results given in Figure 2(c) of Bornhorst and Falke (2001). The Hill coefficients in (Bornhorst and Falke 2001) range from to , and our values are in this range; the range of values are from (QEEE) to (QQQQ), ours are around this range, too. Moreover, the apparent increases dramatically with methylation level, while the value of is about the same for each methylation level; which is consistent with all the experimental results (Li Weis 2000, Bornhorst Falke 2001, Sourjik Berg 2002, Levit Stock 2002).
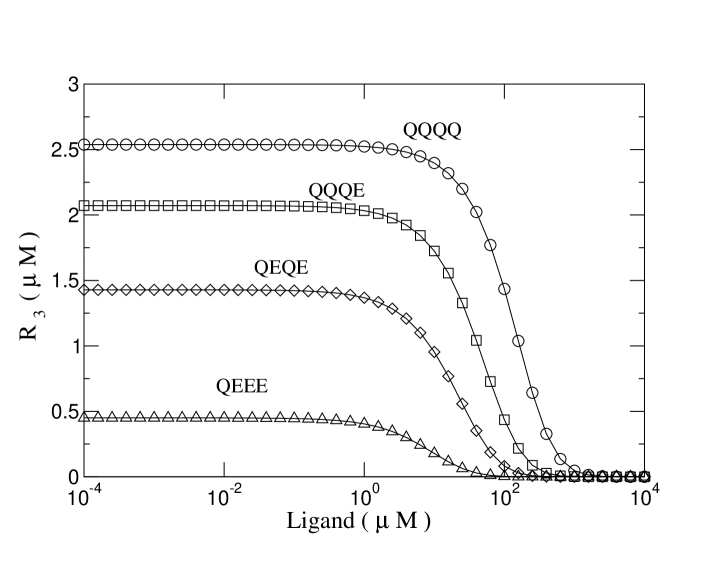
Comparing Figure 3 and Figure 4, we can notice that depends strongly and inversely on the ligand-binding rates of the receptor teams. Consequently, a possible effect of CheR and/or CheB that would modify the ligand-binding affinity of receptor teams would explain the methylation-independent variation of .
In order to better understand the dynamics of the reaction network, we consider the changes in the concentrations of different states on Figure 1 under changes in parameters and the ligand concentration. Because the total amount of receptor is fixed, changes in ligand propagate through the network until a new steady state is reached. In Table 1 we compare the concentrations of the ligand-free and completely occupied states for two external ligand concentrations, two different methylation levels, and two types of team ligand binding behaviors.
As we saw earlier, at the proportions of concentrations in these states depends strongly on the methylation state; in the highly methylated case the vast majority of receptors are in threefolds, while in the wild type methylation case the states are equilibrated. The addition of induces dramatic changes in the state occupancies. These changes depend both on the methylation level and the ligand affinity of receptor teams. For , ligand-free teams all but disappear, in both methylation states. The majority of the receptors are now in the ligand-occupied states. In the high methylation case the totally ligand-bound teams are most abundant, while in the wild type methylation case almost every receptor is in the ligand-bound single dimer state. For , the effect of ligand is much weaker, and it depends crucially on the methylation state. At high methylation, the ligand-bound states are sparsely populated, and the majority of receptors is in the ligand-free teams, and . Notice that the concentration of almost quadruples, and the moderate value of is the only indication of the presence of ligand. In the wild type methylation state the most occupied states are the ligand-bound isolated receptors and, still, ligand-free intermediary teams. We can thus conclude that in the case the most important response to ligand is a vertical flow from ligand-free to ligand-bound states, while in the case the most important flow is a horizontal one from receptor teams to individual receptor dimers.
The complexity of the state space induced by team formation also raises the question whether the fraction of ligand-bound states is dependent on the methylation level, and how it compares to the ligand affinity of individual receptor dimers. We have calculated the dependence of ligand occupancy, on , and find that it depends on the assumptions about team affinity and methylation state. For example, we find that the apparent dissociation constant corresponding to wild type methylation in the case is slightly smaller than the of individual receptor dimers, while in the case the apparent dissociation constant is higher than .
| K | L | |||||||
| 0 | 0.0136 | 0.1861 | 2.5381 | 0 | 0 | 0 | ||
| 100 | 0.0331 | 0.0079 | 2.0933e-4 | 0.3366 | 1.5849 | 1.2445 | ||
| 1 | 0 | 1.1337 | 1.2909 | 1.4282 | 0 | 0 | 0 | |
| 100 | 0.6094 | 0.0029 | 1.3973e-6 | 6.0943 | 0.5740 | 0.0083 | ||
| 0 | 0.0136 | 0.1861 | 2.5381 | 0 | 0 | 0 | ||
| 100 | 0.0115 | 0.8169 | 1.4353 | 0.1156 | 0.0164 | 0.0086 | ||
| 1 | 0 | 1.1337 | 1.2909 | 1.4282 | 0 | 0 | 0 | |
| 100 | 0.4037 | 1.3217 | 0.0815 | 4.0374 | 0.0264 | 4.8547e-4 |
Finally, we study how the different rates and change the activity curves of the model.
-
1.
In our choice of parameters we assumed that the ligand binding state does not influence the receptor association rate. To explore the effects of different rates, we test the extreme situation when one sets the rates , or to zero with the other parameters and conditions fixed. We find that for each case individual concentrations were altered but there was little effect on . This suggests that the equality of these rates is not a strict condition for the success of the model, and the association between ligand free receptors has the dominant effect on
-
2.
In our model we assumed that the ligand-free threefolds constitute the kinase-activating state. To test whether our conclusions are generally valid for teams comprised of different numbers of receptor dimers, we assume that the association of twofolds with individual dimers is prohibited, and ligand-free twofolds are the kinase-activating state. In other words, we set . We find that follows a curve very similar to Figure 2, with the only difference that the saturation value for high is instead of . Selecting the same values for the different methylation levels as before we obtain that varies between (QEEE) and (QQQQ) for and in the range (QEEE) - (QQQQ) for . The closeness of these results to our original model suggests that the number of steps involved in kinase-activating team formation does not have a crucial role.
-
3.
The effect of the single receptor ligand-binding rate on the activity curve is not as strong as the ligand-binding rates for receptor teams. When we assume rather than , as in Figure 4, increases considerably, but not as much as the change between Figure 3 and Figure 4. This suggests that an overall less-than-expected affinity to methyl-aspartate might be at the root of the large observed values.
In conclusion, our results show that a model based on active threefolds of a pure receptor can explain the in vitro activity curves (Li Weis 2000, Bornhorst Falke 2001, Levit Stock 2002). The assumptions of methylation dependent dynamic team formation and ligand-induced breakdown lead to differential kinase activity curves without invoking methylation-induced changes in ligand affinity. We turn next to the experimental observations on mixed receptor types (Sourjik and Berg 2002).
Mixed Receptor Types
Bacteria have several types of receptors, and it is possible that different types of receptor interact in order to be able to respond optimally to diverse environmental stimuli. Indeed, the experiments of Sourjik and Berg (2002) suggest that under certain conditions both the Tar and Tsr receptors respond to methyl-aspartate. According to these experiments, CheRCheB mutants with fixed methylation levels have two apparent dissociation constants corresponding to the Tar and Tsr receptors, respectively, and can be fit by Hill functions of the form
| (6) |
The simplest model suggested by these results is based on the assumption that the output of the composite system is the sum of two individual outputs similar to (1), one for each of the two pure receptor populations. For this model the total output is
| (7) |
where . If the Tsr methylation level is constant, as it appears to be experimentally (Sourjik Berg 2002), Equation 7 predicts that an increase in the Tar methylation level leads to an increase in . However, the experiments indicate that for the CheRCheB mutants, decreases from to as the methylation state of the Tar receptor changes from EEEE to QQEQ. Moreover, appears to be for CheR mutants that are in the lowest methylation state and it is for the CheB mutants that are in the highest methylation state (Sourjik Berg 2002). Therefore the experimental results cannot be explained if it is assumed that receptors act independently, which strongly suggests that there are interactions between different receptor types, in addition to the interactions within pure types. This leads to the possible formation of mixed teams, and in the following we determine whether the model for team formation of pure types, extended to two types of receptor, is able to generate response curves similar to those in (Sourjik Berg 2002).
We denote the two types of receptors by R and P, and assume that they have different affinities for ligand. We also assume that two receptor dimers can associate to form pure or mixed receptor teams, and in the general case the association/dissociation constants of two R (resp, P or R and P) receptor dimers, , (resp., and ), are different.
The full scheme of all mixed twofold and threefold states and the transitions between them includes states instead of the in Figure 1, and involves unknown rates for the receptor association/dissociation reactions alone. It is not worthwhile to tackle this level of computational complexity in the absence of any experimental information, and our previous analysis suggested that a reduced scheme with receptor twofolds as the ligand-activating state leads to similar results as the original scheme. Thus, to reduce the complexity of the analysis of mixed team formation, we only consider receptor twofold formation, and we do not consider teams with more than one ligand-bound receptor. Consequently, the reaction scheme contains two types of receptor dimers, and , the ligand-bound states of these dimers, three different twofolds, , and , and six ligand-bound states of these teams, , , , , and . As in the case of pure receptors, we allow for the possibility that teams have lower ligand affinity than homodimers. We assume that binding of ligand to either dimer in a twofold induces the dissociation of the twofold, and that the rate of dissociation is the same for all teams. Figure 5 shows the entire kinetic scheme and the associated rates.
This scheme leads to the following steady state equations.
| (8) |
| (9) |
where is the affinity of a single R dimer for ligand, is the affinity of a single P dimer, is the affinity of an R dimer that is part of a (pure or mixed) twofold, and is the affinity of a P dimer that is part of a twofold.
We assume that the kinase-activating output of this system is the concentration of free twofolds. Expressing each of these terms as a function of single receptor concentration we obtain
| (10) |
The main differences between this output and the simple assumption of non-interacting receptors are the existence of the second term depending on , and the fact that the steady state concentrations of and are coupled.
Equations (8) and (9) can be solved numerically to obtain the output of the network as a function of the ligand concentration. To account for the results reported in (Sourjik Berg 2002), we assume that the P receptor corresponds to Tsr and its affinity for methyl-aspartate is times lower than the affinity of the R receptor (Tar). The other rates are chosen to correspond with the rates used in the pure population. Thus we set , , , , and we allow to vary between (EEEE) and (QQQQ).
To model the wild type activity curve, we assume that Tar is in its QEQE methylation state, and set . To capture the surprisingly fast decay of the wild type activity, we assume that receptor teams have the same ligand binding affinity as single receptor dimers, i.e., and . We also assume that the association rate of Tsr into pure Tsr teams is lower than the association rate of Tar, i.e., . These assumptions lead to a Hill function of type 1 with a low , in good agreement with the experimental results Sourjik Berg 2002 (see filled diamonds in Figure 6). In the CheR mutant both receptors are in their lowest methylation levels since they lack the methylating enzyme but have the demetylating enzyme CheB. Again, we assume that the association rate of Tsr is lower than that of Tar, i.e., (EEEE) and . The decrease in Tar methylation state induces the decrease of both the ligand-free activity and the apparent dissociation constant; however, the experiments indicate that the of the CheR mutant is close to the of the wild type curve. We are able to reproduce this result by assuming that teams have a slightly lower ligand affinity than single receptors, i.e. and (see filled triangles in Figure 6).
Next we consider the CheRCheB mutants, and assume that , . We find that for the majority of choices for , and the output curves can be fit by generalized Hill functions like Equation 6 with two fast-decaying regions characterized by apparent dissociation constants that are several orders of magnitude apart. We identify the lower dissociation constant, , with the Tar receptor, and the higher, , with the Tsr receptor.
The experimental results indicate that both the ligand-free output and the apparent dissociation constants and increase with increasing Tar methylation levels. Additionally, the parameter , indicating the relative weight of the Tar receptors in the output, decreases with increasing Tar methylation levels. Our model results in a good agreement with these conclusions if we assume that interaction between the two receptor types leads to a moderate variability of the Tsr team formation rate. The curves marked by open symbols on Figure 6 present our results for four different sets of pure/mixed team formation rates. Different curves have Tar association rates corresponding to different methylation states from EEEE to QQQE. We assume that the Tsr-Tsr association rates are lower than the Tar and Tar-Tsr association rates, and they also increase with Tar methylation, but with a slower rate333Our studies indicate that if we keep the Tsr team association/dissociation rates constant, the high-ligand tails of the activity curves coincide, resulting in normalized activity curves that have a reversed order compared to the experimental curves, thus the only way to capture the systematic upwards shift with methylation is by assuming a variation of the Tsr methylation levels.. We find that under these assumptions our results are in excellent qualitative and good quantitative agreement with the CheRCheB mutant results of Sourjik and Berg (2002).

In a CheB mutant the receptors are in the highest methylation state, since the action of the methylating enzyme CheR is not balanced by CheB. We assume that Tar has a very high association rate, both in pure and mixed teams, while the Tsr-Tsr association rate is somewhat lower. As in the case of CheRCheB mutants, we assume that and . We find that the output of such mixture has a single apparent dissociation constant in the milimolar range (see filled circles in Figure 6).
Discussion
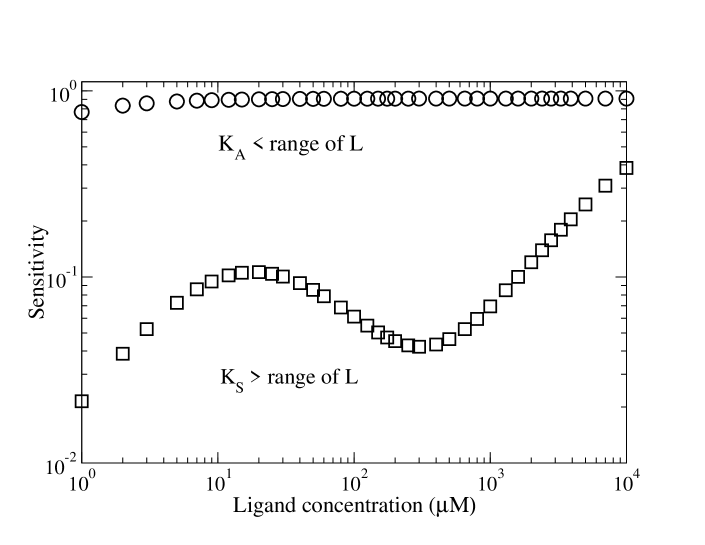
We have shown that the high upstream sensitivity of the signal transduction network is caused by the negative regulation between ligand occupancy of the receptors and kinase activity. Since kinase activity decreases with increasing ligand occupancy, at sufficiently high attractant concentrations the relative change in kinase activity is much larger than the relative change in occupancy. A related general argument indicates that the sensitivity of the signal transduction network, defined as the relative change in kinase activity in response to a certain percentage change in ligand concentration, depends only on the kinase activity suppressed by ligand
| (11) |
and consequently approaches at . This implies that the marked differences between the sensitivity of the wild type and CheRCheB mutants found by Sourjik and Berg (2002) are caused by the fact that for the ambient ligand concentrations studied the wild type receptors have reached the maximum sensitivity, while the CheRCheB mutants have not.
To illustrate this point we include a figure depicting the absolute value of the sensitivity of two receptor populations to a change in ligand concentration (similar to Figure 3b in Sourjik and Berg 2002). The first population’s kinase response is described by a Hill function like Equation 1 with the parameters , while the second’s kinase response follows Equation 6 with , and . In the ambient ligand concentration range the sensitivity of the first population is constant since , while the second population, having , has a varying and much smaller sensitivity. This behavior is in excellent qualitative agreement with the experimental observations of Sourjik and Berg (2002).
We have demonstrated that a model based on the assumption that homodimers of a receptor must aggregate into teams of three in order to activate the autophosphorylation of CheA can adequately explain the observed dependence of the kinase activity on the ligand concentration for a pure receptor. Our model is in qualitative agreement with the experimental results, and shows that methylation-dependent kinase activity does not necessarily imply methylation-dependent ligand affinity. We also showed that the concentration corresponding to half-maximal kinase activity need not coincide with the apparent ligand dissociation constant of the receptor population, nor does the latter coincide with the dissociation constant of an isolated homodimer.
Our model assumes that receptor populations possess a dynamic balance between homodimer, twofold and threefold states, as opposed to an ordered threefold structure. This prediction, along with our assumptions for team formation and dissociation rates could be tested experimentally in in vitro receptor preparations. Furthermore, in order to quantitatively reproduce the experimental results on CheRCheB mutants (Bornhorst Falke 2001) within the framework of the detailed model it is necessary that twofolds and threefolds of receptors have a lower affinity for ligand than an isolated homodimer. This theoretical prediction could be verified experimentally by testing the affinity of homogeneous receptor preparations (i.e. only dimers or only teams).
When there are multiple receptor types, the experimentally-determined activity curves display complex dependence on the ligand concentration, but they can be satisfactorily reproduced by our model. One consistent assumption that was needed is that the association rate of Tsr teams is lower than the association rate of Tar and Tar-Tsr teams. This assumption was vital in reproducing the wild type, CheR and CheB mutant curves, and it suggests the existence of receptor specificity in team formation capabilities. This feature could be caused by receptor-specific methyl-accepting activities that were confirmed experimentally (Barnakov et al. 1998).
Our results also confirm earlier suggestions that changes in methylation state (or association/dissociation rates) alone cannot explain the qualitative difference between the wild type and CheRCheB mutant activity curves. We were able to reproduce the shift by assuming that in CheR or CheB mutants receptor teams have lower affinity for ligand than individual receptor dimers. Note that this effect is weaker in CheR mutants, but still existent.
Our analysis deals only with the early response to changes in ligand concentration, since we have neglected methylation of receptors and downstream phosphotransfer reactions. It remains to integrate the model for the early response developed here with a complete model such as given in (Spiro et al. 1997) for later events. It is of course feasible to do this computationally, but given the complexity of the association scheme for the formation of signaling teams shown in Figure 1, it may be difficult to extract qualitative insights analytically. Some simplification exploiting the disparity in time scales of the various processes will certainly be needed.
This work was supported by NIH Grant #GM-29123 to H. G. Othmer. We thank Sandy Parkinson for helpful discussions at various stages of the model development.
References
- [1]
Ames, P., C. A. Studdert, R. H. Reiser and J. S. Parkinson. 2002. Collaborative signaling by mixed chemoreceptor teams in Escherichia coli, Proc. Natl. Acad. Sci. USA 99: 7060-7065.
Barkai, N and Leibler, S. 1997. Robustness in simple biochemical networks. Nature (London) 387:913-917.
Barnakov, A. N, L. A. Barnakova and G. L. Hazelbauer. 1998. Comparison in vitro of a high- and a low-abundance chemoreceptor of Escherichia Coli: Similar kinase activation but different methyl-accepting activities, J. Bacteriol. 180: 6713–6718.
Berg, H. C. and R. A. Anderson. 1973. Bacteria swim by rotating their flagellar filaments. Nature 245: 380-382.
Berg, H. C. and D. A. Brown. 1972. Chemotaxis in Escherichia coli analyzed by three-dimensional tracking. Nature 239:500-504.
Block, S. M, J. E Segall and H. C. Berg. 1982. Impulse responses in bacterial chemotaxis. Cell 31:215-226.
Bornhorst, J. A and J. J. Falke. 2001. Evidence that both ligand binding and covalent adaptation drive a two-state equilibrium in the aspartate receptor signaling complex J. Gen. Physiol. 118: 693-710.
Bourret, R. B, K. A Borkovich and M. I. Simon. 1991. Signal transduction pathways involving protein phosphorylation in prokaryotes. Annu. Rev. Biochem. 60: 401-41.
Bray, D, M. D. Levin and C. J. Morton-Firth. 1998. Receptor clustering as a cellular mechanism to control sensitivity. Nature (London) 393: 85-88.
Cluzel, P., M. Surette and S. Leibler. 2000. An ultrasensitive bacterial motor revealed by monitoring signaling proteins in single cells. Science 287:1652-1655.
Doedel, E. J. 1981. AUTO: A program for the automatic bifurcation and analysis of autonomous systems. Cong. Num. 30: 265-284.
Francis, N. R., , M. N. Levit, T. R. Shaikh, L. A. Melanson, J. B. Stock and D. J. DeRosier. 2002. Subunit organization in a soluble complex of Tar, CheW, and CheA by electron microscopy, J. Biol. Chem. 277: 36755-36759.
Kim, C, M. Jackson, R. Lux and S. Khan. 2001. Determinants of chemotactic signal amplification in Escherichia coli. J. Mol. Biol. 307: 119-135.
Kim, S. H, W. Wang and K. K. Kim. 2002. Dynamic and clustering model of bacterial chemotaxis receptors: structural basis for signaling and high sensitivity. Proc. Natl. Acad. Sci. USA 99: 11611-11615.
Levit, M. N, Y. Liu and J. B. Stock. 1998. Stimulus response coupling in bacterial chemotaxis: receptor dimers in signalling arrays. Mol. Microbiol. 30: 459-465.
Levit, M. N. and J. B.Stock. 2002. Receptor methylation controls the magnitude of stimulus-response coupling in bacterial chemotaxis, J. Biol. Chem. 277: 36760-36765.
Li, G. and R. M. Weis. 2000. Covalent modification regulates ligand binding to receptor complexes in the chemosensory system of Escherichia coli. Cell 100: 357-365.
Macnab, R. M., and M. K. Ornston. 1977. Normal-to-curly flagellar transitions and their role in bacterial tumbling. Stabilization of an alternative quaternary structure by mechanical force. J. Mol. Biol. 112: 1-30.
Maddock, J. R and L. Shapiro L. 1993. Polar location of the chemoreceptor complex in the Escherichia coli cell. Science 259: 1717-1723.
Mello, B. A. and Y. Tu. 2003. Quantitative modeling of sensitivity in bacterial chemotaxis: The role of coupling among different chemoreceptor species. Proc. Natl. Acad. Sci. USA 100: 8223-8228.
Morton-Firth, C. J, T. S Shimizu and D. Bray. (1999 A free-energy-based stochastic simulation of the Tar receptor complex, J. Mol. Biol. 286: 1059-1074.
Segall, J. E, S. M Block and H. C. Berg. 1986. Temporal comparisons in bacterial chemotaxis. Proc. Natl. Acad. Sci. USA 83:8987-8991.
Spiro, P. A, J. S Parkinson and H. G. Othmer. 1997. A model of excitation and adaptation in bacterial chemotaxis. Proc. Natl. Acad. Sci. USA 94:7263-7268.
Sourjik, V. and H. C. Berg. 2002. Receptor sensitivity in bacterial chemotaxis. Proc. Natl. Acad. Sci. USA 99:123-127.
Turner, L., W. Ryu and H. C. Berg. 2000. Real-time imaging of fluorescent flagellar filaments. J. Bacteriol. 182: 2793-2801.