Evolution of the Protein Interaction Network of Budding Yeast:
Role of the Protein Family Compatibility Constraint
Abstract
Understanding of how protein interaction networks (PIN) of living organisms have evolved or are organized can be the first stepping stone in unveiling how life works on a fundamental basis. Here, we introduce a new in-silico evolution model of the PIN of budding yeast, Saccharomyces cerevisiae; the model is composed of the PIN and the protein family network. The basic ingredient of the model includes family compatibility which constrains the potential binding ability of a protein, as well as the previously proposed gene duplication, divergence, and mutation. We investigate various structural properties of our model network with parameter values relevant to budding yeast and find that the model successfully reproduces the empirical data.
pacs:
89.75.Hc, 87.15.AaStudying complex systems by means of their network representation has attracted much attention recently rmp ; advphys ; siam ; saemulli ; dslee ; han . The cell, one of the best examples of complex systems, can also be viewed as a network: The cellular components, such as genes, proteins, and other biological molecules, connected by all physiologically relevant interactions, form a full weblike molecular architecture in a cell pyramid ; network-biology . Among the various levels, the protein interaction network (PIN) plays a pivotal role as it acts as a basic physical protocol of cooperative functioning in many physiological processes. In the PIN, proteins are viewed as nodes, and two proteins are linked if they physically contact each other. Thanks to recent progress in high-throughput experimental techniques, the data set of protein interactions for budding yeast, Saccharomyces cerevisiae, has been firmly established in the last few years uetz ; ito ; gavin ; ho ; tong ; mips ; dip ; bind . Thus, it offers a good testbed to understand how it has evolved to form its status quo from basic evolutionary rules. In this paper, our aim is to introduce a simple evolutionary model to reproduce the structural properties of the PIN of budding yeast, thereby deepening our understanding of the driving force for cellular evolution.
At a certain level of abstraction, one may view a protein as an assembly of domains. It is domains that offer structural and functional units. They act as basic units in the interactions between proteins and in the evolution of protein structures. Proteins are grouped into so-called protein families or superfamilies according to the domain structure within them alberts . The proteins within a family are monophyletic; that is, they originate from a common ancestor and are fairly well conserved during evolution. The protein family network (PFN) is defined as the one whose nodes are protein families, and two families are connected if any of the domains within them simultaneously occur in a single protein or any proteins within them interact with each other jpark . The distributions of the degrees and the sizes of the families in the PFN also follow power laws jpark ; huynen . Given that the entities of proteins and protein families are not separable but linked via domains as intermediates, it is desirable to unify their evolutions into a single framework.
So far, several in-silico evolution models have been proposed for the yeast PIN sole ; vazquez ; berg ; kim ; chung . A distinguishing aspect in the evolution of the PIN compared with that of other complex networks is the concept of “evolution by duplication” ohno : A new protein is thought to be created mainly by gene duplication. Subsequently, the duplicate protein may lose redundant interactions endowed from its ancestor to reduce redundancy, which is called divergence (or diversification). A protein also gains new interactions with other proteins via mutation. These three processes, duplication–divergence–mutation, have been regarded as the basic ingredients in the evolution of the PIN. While those in-silico models sole ; vazquez ; kim ; chung ; berg were successful in generating a fat-tail or power-law behavior in the degree distribution, they hardly reproduced other structural properties of the yeast PIN network, such as the clustering coefficient, the assortativity, etc., which we will specify in more detail shortly. The model we introduce here, however, can incorporate other structural properties of the yeast PIN as well as the degree distribution. To this end, we introduce the concept of “family compatibility” (FC): An interaction between two proteins is possible only when the corresponding families they belong to are compatible, and only those families linked via the PFN are compatible with one another. With this, we realize the effective structural constraint in physical binding between proteins, which is coupled with the evolutionary lineage of proteins through the notion of protein family.
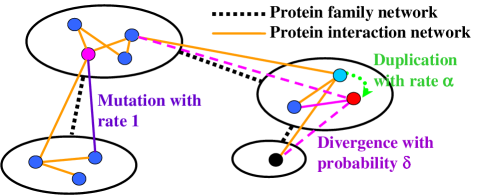

Model— The model can be depicted schematically as in Fig. 1. The whole system is composed of two types of networks, the PIN and the PFN. A number of proteins are grouped, forming a protein family. Protein families link to other protein families, forming the PFN. Two proteins belonging to different protein families can interact only when the respective families are also linked. Each family has a fitness-like parameter, the number of domains within it, , which is not fixed, but evolves with the PFN. The evolution takes place in two stages. In the first stage, the protein families are created along with the proteins; thus, the PFN coevolves with the PIN. In the second stage, the PFN is kept fixed, and the evolution of the PIN continues on top of it. A detailed description of the procedure is as follows:
-
1.
Initially, there are proteins, each of which constitutes its own protein family. All proteins are interconnected with one another, as are the protein families. We choose to be minimal. Each family has domains, the number of family-links it has.
-
2.
In the first stage, proteins and protein families coevolve: At each step, with rate , a new protein, say , is created by duplicating an existing protein chosen randomly. The new protein creates its own protein family . Each of the inherited interactions of the protein is removed with probability , a process called divergence. Through divergence, the degree of the new protein , , usually becomes less than that of the mother protein . The linkage of the new protein family is determined by that of the protein created. By this process, the newly born family consists of a single protein, but has a number of linkages, say , to existing families. The initial number of domains in the family is set to . In some cases, the newly created protein is left with no interaction at all . In this case, we do not let it establish a new family, but regard it as a remnant in the previous family. When this case happens, the population of the family to which the duplicated protein belongs is increased by 1. Note that the remnant can later gain new interactions via mutation described below and join the protein interaction network.
With rate , a randomly chosen existing protein gains a new interaction to another previously unlinked protein , which is chosen among the proteins within compatible families, according to the probability,
(1) where means the family to which the protein belongs and means that the families and are compatible, i.e., linked in the PFN. Eq. (1), the preferential attachment in the domain abundance constrained by FC, makes our model distinct and successful. In this process, the mutation as we will call it, the number of domains in the family increases by 1, but the number of domains in does not. This accounts for the acquisition of a new domain via mutation in the family . This stage lasts until there are 1,000 proteins made, during which about families are created, a number comparable with the number of superfamilies in yeast superfamily
-
3.
In the second stage, the same protein evolution process as in the first stage occurs, except that the PFN is kept fixed and the daughter protein remains in the same family as its mother in the duplication process. This stage lasts until there are about 6,000 proteins in the network, the approximate size of the yeast proteome.
A few remarks on the model are in order. First, this model is designed to be as simple as possible while implementing FC into the trio of duplication, divergence, and mutation, which we believe to be the most basic processes. Many interesting processes, such as lateral gene transfer and de novo creation of proteins and protein families, are not covered in this model, however. Second, we made an assumption that the time-scale of the PFN evolution is strictly separated, which might be an oversimplification. Third, proteins and protein families may become extinct during evolution, followed by the loss of the interactions between them. However, we may view the parameters of the evolution rates, such as and , as effective ones incorporating all these details. Also, for the sake of minimizing the number of free parameters, we assume that the duplication and the divergence rates of proteins and protein families are equal, i.e., and , although we can fix and for any given set of (, ) to incorporate the empirical data.
Structure of the yeast PIN— Several analyses on the topological properties of the yeast PIN have been performed during recent years lethal ; maslov ; wagner . Since then, however, new protein–protein interactions in yeast have been discovered steadily, so we repeat the analysis by integrating the most up-to-date data from various public resources, such as (i) the database at the Munich Information Center for Protein Sequences mips , (ii) the database of the interacting proteins dip , (iii) the biomolecular interaction network database bind , (iv) the two-hybrid datasets obtained by Uetz et al. uetz , by Ito et al. ito , and by Tong et al. tong , and (v) the mass spectrometry data (filtered) by Ho et al. ho . After trimming the synonyms and other redundant entries manually, the resulting network consists of 15, 652 interactions (excluding self-interactions) between 4, 926 nodes (in terms of distinct open reading frames and other biomolecules).
The topological properties of the integrated yeast PIN are shown in Fig. 2:
(a) The degree distribution of the PIN fits well to the generalized Pareto distribution (or a generalized power law) ab ; koonin ,
| (2) |
with and . Note that different functional types of the degree distribution from Eq. (2) were proposed sole ; vazquez ; berg ; wagner ; lethal based on smaller-scale datasets than the current one.
(b) The yeast PIN is highly clustered and modular. To quantify this, we measured the local clustering of a protein , , where is the number of links present between the neighbors of node out of its maximum possible number . The clustering coefficient of a graph, , is the average of over all nodes with . We obtain . is the clustering function of vertices with degree vespignani2 ; ravasz . exhibits a plateau for small while it drops rapidly for large . Such a plateau in the clustering function may reflect the functional module structure within the PIN, inside which the network is denser due to the high cooperativity to perform a given cellular task. Such locally dense modules are interconnected by a few global mediators, which are likely to be the hubs in the PIN han-vidal . This feature is what most existing PIN models fail to reproduce. As we will show, the FC constraint that we introduce successfully accounts for the emergence of the plateau in .
(c) The yeast PIN shows a dissortative degree correlation. The average neighbor-degree function knn is measured to be with , somewhat smaller than the value reported based on a single two-hybrid dataset alone maslov . The assortativity , defined as the Pearson correlation coefficient between the degrees of the two vertices on each side of a link assort , is measured to be . In Table 1, we summarize our measurements for the topological properties of the integrated yeast PIN.
| item | model | yeast PIN |
|---|---|---|
| total number of nodes | 6000 | 6000 |
| number of interacting nodes | 507954 | 4926 |
| average degree | 6.50.3 | 6.35 |
| clustering coefficient | 0.130.02 | 0.128 |
| assortativity index | 0.090.04 | |
| size of the largest component | 505153 | 4832 |
Results— Now we compare the simulation results of our model. In typical simulations, we employed and . The value of was chosen to accommodate the fact that superfamilies exhibit extensive sequence diversity todd . The value of was set to match the empirical value of the average degree of the PIN, . Also, we matched approximately the numbers of protein families and proteins with those of budding yeast, as we described before. The results obtained from the model show good agreements with the empirical data as shown in Fig. 2 and Table 1. In Fig. 2, we also show the results with the model without implementing FC, which is similar to the model of Solé et al. sole . One can clearly see that without FC, we cannot account for the clustering and the degree correlation characteristics. We also examine the full degree-correlation profile of the joint probability that two proteins with degrees and are connected to each other. The degree-correlation intensity is quantified by , the ratio with the joint probability in the randomized ensemble of the original network maslov ; sole03 . As shown in Fig. 3, the profile obtained from the model has a pattern that is quite similar to that of the empirical yeast PIN.

To get further support for the relevance of the FC constraint, we performed a network randomization test. We randomized the model network by using the conventional edge switching method maslov , but with the FC constraint. That is, when we are to switch the interactions between the protein pairs, only the switching attempts that preserve FC are accepted. In this way, we can filter out the role of FC. In Fig. 4, we show the results of randomization. We find that the high clustering property of the network is preserved with randomization with FC, but not without FC. Without FC, the clustering coefficient drops as soon as we shuffle the network, as can be seen in Fig. 4(b). Thus, we conclude FC, indeed, plays a crucial role in PIN evolution.

Finally, we check the properties of the PFN. In Fig. 5, we show the degree distribution of the PFN and the family size distribution generated in silico. The degree distribution of the PFN follows a similar form to Eq. (2), but with a different value of the exponent, . The family size distribution also follows a power law with an exponent of 34.
In summary, we have introduced an in-silico model for PIN
evolution. The model network is composed of the PIN and the PFN.
In the early stage of evolution, the PIN and the PFN coevolve,
and in the later stage, the PFN becomes fixed.
The evolution proceeds by the three major mechanisms
previously proposed, duplication, divergence, and mutation.
However, it is constrained by FC and
follows a modified preferential attachment rule in the domain abundance,
which is the new feature of our model.
We have checked various structural properties of the model network, finding
that they show good agreements with those of the integrated empirical data
of the yeast PIN.
Finally, it would be interesting to apply our model to higher eukaryotes,
as the data for the protein interactions are accumulating for the
multicellular species such as the nematode worm Caenorhabditis elegans
vidal and the fruit fly Drosophila melanogater giot .
Acknowledgements.
The authors would like to thank J. Park for helpful conversation. This work is supported by Korea Science and Engineering Foundation grant No. R14-2002-059-01000-0 in the Advanced Basic Research Laboratory program and Ministry of Science and Technology grant No. M1 03B500000110.References
- (1) R. Albert and A.-L. Barabási, Rev. Mod. Phys. 74, 47 (2002).
- (2) S. N. Dorogovtsev and J. F. F. Mendes, Adv. Phys. 51, 1079 (2002).
- (3) M. E. J. Newman, SIAM Rev. 45, 167 (2003).
- (4) B. Kahng, K.-I. Goh, D.-S. Lee, and D. Kim, Saemulli, New Physics (in Korean) 48, 115 (2004).
- (5) D.-S. Lee, K.-I. Goh, B. Kahng, and D. Kim, J. Korean Phys. Soc. 44, 633 (2004).
- (6) C. N. Yoon, S. K. Han, and H. Y. Kim, J. Korean Phys. Soc. 44, 638 (2004).
- (7) Z. N. Oltvai and A.-L. Barabási, Science 298, 763 (2002).
- (8) A.-L. Barabási and Z. N. Oltvai, Nat. Rev. Genet. 5, 101 (2004).
- (9) P. Uetz, et al., Nature (London) 403, 623 (2000); B. Schwikowski, P. Uetz, and S. Fields, Nat. Biotechnol. 18, 1257 (2000).
- (10) T. Ito, T. Chiba, R. Ozawa, M. Yoshida, M. Hattori, and Y. Sakaki, Proc. Natl. Acad. Sci. USA 98, 4569 (2001).
- (11) A. H. Y. Tong, et al., Science 295, 321 (2002).
- (12) A.-C. Gavin, et al., Nature (London) 415, 141 (2002).
- (13) Y. Ho, et al., Nature (London) 415, 180 (2002).
- (14) H. W. Mewes, et al., Nucl. Acids Res. 32, D41 (2004).
- (15) L. Salwinski, C. S. Miller, A. J. Smith, F. K. Pettit, J. U. Bowie, and D. Eisenberg, Nucl. Acids Res. 32, D449 (2004).
- (16) G. D. Bader, D. Betel, and C. W. V. Hogue, Nucl. Acids Res. 31, 248 (2003).
- (17) B. Alberts, D. Bray, A. Johnson, J. Lewis, M. Raff, K. Robert, and P. Walter, Essential Cell Biology (Garland, New York, 1998).
- (18) J. Park, M. Lappe, and S. A. Teichmann, J. Mol. Biol. 307, 929 (2001).
- (19) M. A. Huynen and E. van Nimwegen, Mol. Biol. Evol. 15, 583 (1998).
- (20) R. V. Solé, R. Pastor-Satorras, E. Smith, and T. Kepler., Adv. Compl. Syst. 5, 43 (2002); R. Pastor-Satorras, E. D. Smith, and R. V. Solé, J. Theor. Biol. 222, 199 (2003).
- (21) A. Vázquez, A. Flammini, A. Maritan, and A. Vespignani, ComPlexUs 1, 38 (2003).
- (22) J. Kim, P. L. Krapivsky, B. Kahng, and S. Redner, Phys. Rev. E 66, 05510(R) (2002).
- (23) F. Chung, L. Lu, T. G. Dewey, and D. J. Galas, J. Comput. Biol. 18, 1486 (2003).
- (24) J. Berg, M. Lässig, and A. Wagner, BMC Evol. Biol. 4, 51 (2004).
- (25) S. Ohno, Evolution by Gene Duplication (Springer-Verlag, Berlin, 1970).
- (26) J. Gough, K. Karplus, R. Hughey, and C. Chothia, J. Mol. Biol. 313, 903 (2001).
- (27) H. Jeong, S. P. Mason, A.-L. Barabási, and Z. N. Oltvai, Nature (London) 411, 41 (2001).
- (28) A. Wagner, Mol. Biol. Evol. 18, 1283 (2001).
- (29) S. Maslov and K. Sneppen, Science 296, 910 (2002).
- (30) R. Albert and A.-L. Barabási, Phys. Rev. Lett. 85, 5234 (2000).
- (31) E. V. Koonin, Y. I. Wolf, and G. P. Karev, Nature 420, 218 (2002).
- (32) A. Vázquez, R. Pastor-Satorras, and A. Vespignani, Phys. Rev. E 65, 066130 (2002).
- (33) E. Ravasz, A. L. Somera, D. A. Mongru, Z. N. Oltvai, and A.-L. Barabási, Science 297, 1551 (2002); E. Ravasz and A.-L. Barabási, Phys. Rev. E 67, 026112 (2003).
- (34) J.-D. Han, et al., Nature (London) 430, 88 (2004).
- (35) R. Pastor-Satorras, A. Vázquez and A. Vespignani, Phys. Rev. Lett. 87, 258701 (2001).
- (36) M. E. J. Newman, Phys. Rev. Lett. 89, 208701 (2002).
- (37) A. E. Todd, C. A. Orengo, and J. M. Thornton, J. Mol. Biol. 307, 1113 (2001).
- (38) R. V. Solé and P. Fernández, (arXiv:q-bio.GN/0312032).
- (39) S. Li, et al., Science 303, 540 (2004).
- (40) L. Giot, et al., Science 302, 1727 (2003).