What can we learn from noncoding regions of similarity between genomes?
Abstract
Background: In addition to known protein-coding genes, large amount of apparently non-coding sequence are conserved between the human and mouse genomes. It seems reasonable to assume that these conserved regions are more likely to contain functional elements than less-conserved portions of the genome. Here we used a motif-oriented machine learning method to extract the strongest signal from a set of non-coding conserved sequences.
Results:We successfully fitted models to reflect the non-coding sequences, and showed that the results were quite consistent for repeated training runs. Using the learned model to scan genomic sequence, we found that it often made predictions close to the start of annotated genes. We compared this method with other published promoter-prediction systems, and show that the set of promoters which are detected by this method seems to be substantially similar to that detected by existing methods.
Conclusions: The results presented here indicate that the promoter signal is the strongest single motif-based signal in the non-coding functional fraction of the genome. They also lend support to the belief that there exists a substantial subset of promoter regions which share common features and are detectable by a variety of computational methods.
1 Background
Since the publication of draft sequences for the human [1] and mouse [2] genomes, several groups have run large-scale comparisons of the sequences to detect regions of conserved sequence. An initial survey of these was published along with the draft mouse genome [2]. Briefly, protein coding genes are – as we might expect – among the most strongly conserved regions, but homologous sequences can be found throughout the genome. In total, it is possible to align up to 40% of the mouse genome to human sequence [3], but it seems likely that at least some of this is just random “comparative noise” – regions of sequence which serve no particular purpose but which, purely by chance, have not yet accumulated enough mutations to make their evolutionary relationship unrecognizable. However, it is widely accepted that some of the noncoding-but-similar regions, especially those with the highest levels of sequence identity between the two species, are preferentially conserved because they perform some important function. It has been estimated that around 5% of the genome is under purifying selection [2], indicating that mutations in these regions have deleterious effects: a strong suggestion of some important function..
Here, we apply the Eponine Windowed Sequence (EWS) sequence analysis method [4] method which uses a Relevance Vector Machine [5] to extract a minimal set of short motifs which are able to discriminate between two sets of sequences: in this case, a positive set of conserved non-coding sequences and a negative set of randomly picked sequences. The EWS model is an adaption of the Eponine Anchored Sequence model first described in [6] and subsequently used to predict a range of additional biological features including translation start sites and transcription termination sites [A. Ramadass, unpublished] While EAS is designed to classify individual points in a sequence – a feature which allows the EponineTSS model to predict precise locations for transcription start sites – EWS classifies complete blocks (windows) of sequence. The design and implementation of the EWS model is described in detail in [4].
2 Results
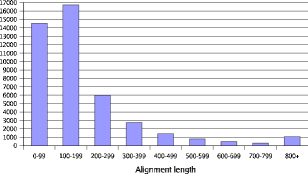
We considered a set of ‘tight’ alignments made by the blastz program [3] between release NCBI33 of the human genome and release NCBIM30 of the mouse genome. In total, this method reported 787173 blocks alignable between the two genomes. We considered only those blocks assigned to human chromosome 6, a 170Mb chromosome which has recently undergone manual annotation of gene structures and other features [7]. This chromosome included 44105 (5.6%) of the total alignments. These varied in length from 34 to 9382 bases, with a length distribution skewed towards relatively short alignments, as shown in figure 1.
Since we were interested in non-coding features of the genome, we ignored all regions where an alignment overlaps an annotated gene structure. This removed 20.8% of aligned bases. It is possible that some genes, and especially psuedogenes, have been missed by the annotation process, so we also removed portions covered by ab initio gene predictions from the Genscan program [8]. This eliminated an additional 4.3% of aligned bases. Finally, repetitive sequence elements annotated by the programs RepeatMaster [9] and trf [10] (5.9%) were removed from the working set. The remainder of the aligned regions were split into non-overlapping 200 base windows, ignoring any portions less that 200 bases. This gave a set of 13925 sequences which are well-conserved between human and mouse – and therefore likely to be functional – but which are very unlikely to be part of the protein-coding repertoire. These formed the positive training set for our machine learning strategy.
A negative training set of equal size was prepared by picking 200-base windows at random from the non-coding, non-repetitive portions of chromosome 6, using the same criteria to define repeats and coding sequence. While it is probable that this set also included some functional sequences, we would expect them to be represented at a substantially lower level than in the conserved set.
These two sets of sequence were presented to the Eponine Windowed Sequence machine learning system. Randomly chosen 5-base words were used as seed motifs, and three models were trained, each for 2000 cycles. The set of motifs used in model 1 is shown in table 1
| Positive | Negative | ||
|---|---|---|---|
| Forward | Reverse | Forward | Reverse |
| gtca | tgac | tacgt | acgta |
| tattg | caata | gggca | tgccc |
| tgcca | tggca | gtca | tgac |
| ggca | tgcc | acaat | attgt |
| tacgt | acgta | ggggc | gcccc |
| gtact | agtac | tact | agta |
| taac | gtta | cctcc | ggagg |
| ttt | aaa | ggca | tgcc |
| acaat | attgt | tattg | caata |
| caatt | aattg | tattg | caata |
| cagc | gctg | aaatt | aattt |
| cag | ctg | caat | attg |
| cggat | atccg | gtat | atac |
| aaatt | aattt | ccagg | cctgg |
| gctcg | cgagc | catg | catg |
| ggc | gcc | act | agt |
| taagg | cctta | ||
| aaaaa | ttttt | ||
While the exact set of motifs used in the model varied somewhat from run to run, testing pairs of models on non-overlapping windows from a 1Mb region of human chromosome 22 and plotting the scores showed that the model outputs were highly correlated (e.g. figure 2). We calculated the Pearson correlation coefficient for all pairs, and in all cases this was greater than . From this strong correlation, we concluded that any variations in the model were simply the result of the trainer picking one representative from a group of motifs which provide similar information.

We scanned genomic sequences using these models at a range of thresholds, and examined the results using the Ensembl genome browser [11]. Visual inspection showed that many of the highest-scoring regions were localized near the start of genes. This prompted us to look at the distribution of high-scoring with respect to the starts of a set of well-annotated genes. We considered the GD_mRNA genes from version 2.3 of the human chromosome 22 annotation. These are confidently annotated genes with experimental evidence as described in [12], which confirms at least the approximate location of the ends of the transcripts, and are entirely independent from the chromosome 6 training data. Figure 3 shows the density of predictions with GLM scores relative to the annotated 5’ ends of these genes. This shows a strong peak of predictions close to the annotated starts, demonstrating that the model is predicting some sequences commonly located around the transcription start site of genes. Combining this observation with the fact that the model was trained from conserved (and therefore presumed functional) sequences, we believe that it is detecting signals found in the promoter regions of genes.

Evaluation of promoter-prediction methods on a large scale is a difficult exercise, since there are no large pieces of genomic sequence for which we can be certain we know the complete set of transcribed regions, and even in the case on well-known genes we often do not know the precise location at which transcription begins. In [6], we developed a pseudochromosome, derived from release 2.3 of the chromosome 22 annotation. As described above, this includes a subset of 284 experimentally verified gene structures. The pseudochromosome was constructed to include these genes while omitting all other annotated genes (which could be substantially truncated). We considered predictions (groups of one or more overlapping windows which all have scores greater than some chosen threshold) to be correct if they lie withing 2kb of an annotated gene start, and false otherwise. Plotting accuracy (proportions of predictions which are correct) against coverage (proportion of transcript starts which are detected by one of the correct predictions) gives an ROC curve. This is plotted for three different models in figure 4. Firstly, this shows that predictive performance for all three models is rather similar similar. It also shows that they can function as accurate promoter predictors, with accuracy rising to a plateau of around .

We picked model 1 for further study. Using a score threshold of , this gives an accuracy of and a coverage of . We compared the set of genes correctly detected by this model to two other methods: firstly, the EponineTSS predictor described in [6], and secondly, the published results from the PromoterInspector program [13]. PromoterInspector results were mapped to pseudochromosome coordinates using the procedure described in [6]. Figure 5 shows how the set of promoters detected by these three distinct methods overlaps. There are clearly strong correlations between all three methods. In particular, at this threshold the EpoHomol model detects 98 promoters which were found by at least one of the other methods, but only 4 novel promoters.

3 Conclusions
We have shown here that, when presented with a set of non-coding sequences which are strongly conserved between human and mouse, a simple motif-oriented machine learning system consistently builds models which are able to detect a substantial fraction of human promoter regions with good accuracy. This strongly suggests that this promoter signal represents the most widely used motif-based signal in functional non-coding sequence. While the model learned here can clearly be applied for the purpose of genome-wide promoter annotation, in practice existing methods offer better coverage and (in the case of the EponineTSS predictor) predictions for the precise location of the transcription start site.
It is interesting that the promoter model learned by this technique detected substantially the same set of promoters as found by the EponineTSS and PromoterInspector methods. It has previously been remarked that these two methods detect similar sets [6], but this could perhaps be explained by the fact that both methods were initially derived from similar sets of known promoter sequences (in both cases, training data was extracted from the EPD database [14]. In the case of the homology models described here, there is no connection with EPD, or any similar set of known promoters: the training data was picked purely on the basis of its high similarity to corresponding portions of the mouse genome. These result therefore support the alternate view that there is a particular ‘easily detected’ subclass of promoter sequences.
One distinct group of promoters, which previous results show may correspond to this easily detected family, is those promoters associated with CpG islands [ref]. However, while a number of the motifs listed in table 1 are G/C rich and/or contain the CpG dinucleotide, by no means all of the motifs match this description, and indeed one motif containing CpG has a negative weight in the linear model – their presence reduces the model output score – while some A/T rich motifs have positive weights. We therefore believe that the signals detected here are significantly more complex than a simple overrepresentation of CpG dinucleotides.
4 Materials and Methods
4.1 Genomic sequence and annotation
Human genome sequence release NCBI33 and mouse genome release NCBIM30 were extracted from Ensembl databases [11], which also contained gene predictions from Genscan [8] and repeat data from RepeatMasker [9] and trf [10]. Curated annotation of gene structures on human chromosome 6 was obtained from the Vega database [15]. Vega and Ensembl data was extracted directly from the SQL databases using the BioJava toolkit with biojava-ensembl extensions [16].
4.2 Genome alignments
4.3 Pseudochromosome for testing promoter-finding methods
A 16.3Mb pseudochromosome sequence was produced based on version 2.3 of the curated annotation for human chromosome 22. This includes all the experimentally-validated gene structures and their upstream regions, while omitting regions containing genes that are predicted but not fully verified. In the case of a pair of divergent genes where one has been verified and the second has not, their shared upstream region was cut at the midpoint. More information about pseudochromosome construction is given in [6].
4.4 Eponine Windowed Sequence learning
The Eponine Windowed Sequence (EWS) model is a machine learning system for identifying a small set of motifs which can be effectively used to classify some set of training sequences [4]. In this case, we applied a slightly restricted version of the EWS trainer which omitted the “Append Column” sampling rule, restricting the model to learning motifs with length less than or equal to the length of the seed motifs.
5 Acknowledgments
Chromosome 22 annotation data version 2.3 were produced by the Chromosome 22 Annotation Group at the Sanger Institute and were obtained from the World Wide Web at http://www.sanger.ac.uk/HGP/Chr22 (Dunham et al. unpublished data). TD would like to thank the Wellcome Trust for funding.
References
- [1] The Genome International Sequencing Consortium: Initial sequencing and analysis of the human genome. Nature 2001 409:860-912
- [2] The Mouse Genome Sequencing Consortium: Initial sequencing and comparative analysis of the mouse genome. Nature 2003 420:520-562
- [3] Schwartz S, Kent WJ, Smit A, Zhang Z, Baertsch R, Hardison RC, Haussler D, Miller W: Human-Mouse Alignments with BLASTZ. Genome Res. 2003 13:103-107.
- [4] Down TA, Hubbard TJP: Relevance Vector Machines for classifying points and regions of biological sequences. submitted.
- [5] Tipping ME: Sparse Bayesian learning and the relevance vector machine. Journal of Machine Learning Research 2000 1:211–244.
- [6] Down TA, Hubbard TJP: Computational Detection and Location of Transcription Start Sites in Mammalian Genomic DNA. Genome Res. 2002 12:652-658.
- [7] A. J. Mungall et al. The DNA sequence and analysis of human chromosome 6 Nature 2003 425:805-811.
- [8] Burge C, Karlin S: Prediction of complete gene structures in human genomic DNA. Journal of Molecular Biology 1997 26878-94
-
[9]
Smit AFA, Green P: RepeatMasker
[http://ftp.genome.washington.edu/RM/RepeatMasker.html] - [10] Benson G: Tandem repeats finder: a program to analyze DNA sequences Nucleic Acids Res. 1999 27:573-580
- [11] T. J. P. Hubbard et al.: The Ensembl genome database project Nucleic Acids Res. 2002 30:38–31.
- [12] Collins JE, Goward ME, Cole CG, Smink LJ, Huckle EJ, Knowles S, Bye JM, Beare DM, Dunham I: Reevaluating Human Gene Annotation: A Second- Generation Analysis of Chromosome 22. Genome Res 2003, 13:27-36
- [13] Scherf M, Klingenhoff A, Frech K, Quandt K, Schneider R, Grote K, Frisch M, Gailus-Durner V, Seidel A, Brack-Werner R, Werner T: First pass annotation of promoters on human chromosome 22 Genome Res. 2001 11:333-340
- [14] Perier RC, Praz V, Junier T, Bonnard C, Bucher P: The Eukaryotic Promoter Database (EPD) Nucleic Acids Res. 2000 28:307-309
- [15] Vega Genome Browser [http://vega.sanger.ac.uk/].
- [16] BioJava [http://www.biojava.org/].
- [17] UCSC Genome Bioinformatics [http://genome.cse.ucsc.edu/].