Abstract
We study some mechanisms responsible for synchronous oscillations and loss of synchrony at physiologically relevant frequencies (10-200 Hz) in a network of heterogeneous inhibitory neurons. We focus on the factors that determine the level of synchrony and frequency of the network response, as well as the effects of mild heterogeneity on network dynamics. With mild heterogeneity, synchrony is never perfect and is relatively fragile. In addition, the effects of inhibition are more complex in mildly heterogeneous networks than in homogeneous ones. In the former, synchrony is broken in two distinct ways, depending on the ratio of the synaptic decay time to the period of repetitive action potentials (), where can be determined either from the network or from a single, self-inhibiting neuron. With , corresponding to large applied current, small synaptic strength or large synaptic decay time, the effects of inhibition are largely tonic and heterogeneous neurons spike relatively independently. With , synchrony breaks when faster cells begin to suppress their less excitable neighbors; cells that fire remain nearly synchronous. We show numerically that the behavior of mildly heterogeneous networks can be related to the behavior of single, self-inhibiting cells, which can be studied analytically.
Section 1 Introduction
Synchronous activity has been observed in many regions of the brain and has been implicated as a correlate of behavior and cognition [Gray (1994), Llinás and Ribary (1993)]. In the hippocampal formation, where such activity has been studied most thoroughly, neurons discharge in several behaviorally important synchronous rhythms [Buzsáki (1986)]. Among these patterns are the theta (4-12 Hz) and gamma ( Hz) rhythms, which appear as nested rhythms under conditions of active exploration and paradoxical sleep, as well as hippocampal sharp waves ( Hz), which occur along with embedded fast ripples ( Hz) under conditions of rest and slow wave sleep [Bragin et al. (1995), Ylinen et al. (1995)]. Here, we investigate some mechanisms responsible for generating synchronous oscillations throughout the physiologically relevant range of frequencies (10-200 Hz).
Two crucial results point to the importance of inhibitory interneurons in generating synchronous rhythms in the hippocampal formation. First, it has been shown in intact animals that interneurons fire robustly and synchronously in both the theta-gamma state and in the sharp wave-ripple state [Bragin et al. (1995), Ylinen et al. (1995)]. Second, in vitro experiments have demonstrated that a functional network containing interneurons alone can support synchronous gamma activity [Whittington et al. (1995)]. These and other experimental results have spurred both analytic [Ernst et al. (1995), Hansel et al. (1995), Gerstner et al. (1996), van Vreeswijk et al. (1994)] and numerical [Jeffreys et al. (1996), Traub et al. (1996a), Traub et al. (1996b), Wang and Buzsáki (1996), Whittington et al. (1995)] studies of synchrony among neurons. Among the principal conclusions of such studies are that stable synchrony is supported by inhibition that is slow compared with neuronal firing rates; and that firing rate decays linearly, eventually saturating, as a function of the decay time constant of inhibition (). When the synaptic coupling is extremely fast, the coupling tends to push the neurons towards anti-synchrony [Friesen (1994), Perkel and Mulloney (1974), Skinner et al. (1994), van Vreeswijk et al. (1994), Wang and Rinzel (1992)].
Synchronous oscillations generated in vivo are almost certainly the product of interactions among neurons with some (unknown) degree of heterogeneity in excitatory drive and intrinsic excitability. Much of the earlier work in the area has not explored the effects of heterogeneity in intrinsic spike rates [Ernst et al. (1995), Gerstner et al. (1996), Jeffreys et al. (1996), Traub et al. (1996a), Traub et al. (1996b), van Vreeswijk et al. (1994), Whittington et al. (1995)]. Tsodyks et al.(1993) considered a network of integrate-and-fire oscillators with heterogeneous external drive and all-to-all excitatory coupling. They found that for an infinite number of oscillators, those with an external drive below a critical value would be synchronized and those above the critical value would be asynchronous. This co-existence around the critical value persisted in the limit of vanishing heterogeneity. Golomb and Rinzel (1993) considered a heterogeneous network of all-to-all coupled inhibitory bursting neurons and found regimes of synchronous, anti-synchronous and asynchronous behavior when the width of the heterogeneity was changed. They considered a parameter regime that was synchronous for small heterogeneity. Wang and Buzsáki (1996) considered a hippocampal interneuron network with heterogeneity in the external drive and network connectivity. They found numerically that for a physiologically plausible parameters, coherent activity is only possible in the gamma range of frequencies.
Our purpose here is to understand more fully the implications of small levels of heterogeneity for the degradation of synchrony in networks of inhibitory fast spiking neurons and the mechanisms by which this degradation occurs. To this end, we have begun a coordinated set of analytic and numerical studies of the problem. In this paper, we numerically analyze a network of interneurons applicable to the CA1 region of the hippocampus. We consider slow inhibition and heterogeneity in the external drive. We find that small amounts of heterogeneity in the external drive can greatly reduce coherence. In addition, we find that coherence can be reduced in two qualitatively different ways depending on the parameters – either by a transition to asynchrony where the cells fire independently of each other, or through suppression where faster cells suppress slower cells.
The reaction of a network to heterogeneity is shown in the paper to be correlated with the dependence of firing frequency on the time constant of synaptic decay. We find in self-inhibiting cells or synchronous networks that this dependence divides into two asymptotic regimes. In the first (the tonic-inhibition or tonic regime), inhibition acts as if it were steady-state and only weakly affects discharge frequency. In the second (the phasic-inhibition or phasic regime), time-varying inhibition firmly controls discharge frequency. There is a gradual crossover between these regimes. The presence of a neuron or network in the tonic or phasic regime can most easily be determined by examining the ratio of the synaptic decay time constant to discharge period (). (Discharge period can be obtained from the full network or from a reduced model including only a single cell with self-inhibition.) is large ( for our parameters) and varies linearly with in the tonic regime. is small () and only logarithmically dependent on in the phasic regime. However, if is too small (), the phasic regime is departed and anti-synchrony is possible. Networks of weakly heterogeneous (less than 5%) cells generally exhibit asynchrony (defined here as the state of phase dispersion) in the tonic regime. In the phasic regime, cells generally exhibit a form of locking, including synchrony, harmonic locking (locking at rational ratios), and suppression. These results can be demonstrated analytically using a reduced model with mutual and self-inhibition [Chow et al. (1997)].
We conclude that mild heterogeneity in inhibitory networks adds effects that are not accounted for in previous analyses, but that are tractable under our current framework. In particular, we show that the prediction that slow inhibition leads to synchrony, made under assumptions of homogeneity [Ernst et al. (1995), Gerstner et al. (1996), van Vreeswijk et al. (1994)], must be modified in the presence of mild heterogeneity. Thus, the new framework provides a context for understanding previous simulations [Wang and Buzsáki (1996)]. In particular, it explains the mechanisms underlying asynchrony (phase dispersion) with slow decay of inhibition. These mechanisms differ from those underlying the loss of synchrony with faster-decaying inhibition.
Section 2 Methods
2.1 Numerical simulations
Simulations were carried out using single-compartment neurons with inhibitory synapses obeying first-order kinetics. Membrane potential in each point neuron obeyed the current balance equation
| (1) |
where F/cm2, is the applied current, and are the Hodgkin-Huxley type spike generating currents, is the leak current and is the synaptic current. The fixed parameters used were: mS/cm2, mS/cm2, mS/cm2, mV, mV, mV, mV. These parameters are within physiological ranges and give the high spike rates typical of hippocampal interneurons. The phenomena described here seem largely independent of specific neuronal parameters.
The activation variable was assumed fast and substituted with its asymptotic value . The inactivation variable obeys
| (2) |
with , . The variable obeys
| (3) |
with , .
The gating variable for the synapse is assumed to obey first order kinetics of the form
| (4) |
where .
The ODEs were integrated using a fourth-order Runge-Kutta method. The free parameters were scanned across the following ranges: for applied current , 0-10 A/cm2; for , the maximal synaptic conductance per cell, 0-2 mS/cm2; for the synaptic decay time constant , 5-50 ms.
2.2 Calculation of coherence
As a measure of coherence between pairs of neurons, we generated trains of square pulses from the time domain responses of each of the cells (Fig. 1). Each pulse, of height unity, was centered at the time of a spike peak (resolution = 0.1 ms); the width of the pulse was 20% of the mean firing period of the faster cell in the pair (0.2 in Fig. 1). We then took the cross-correlation at zero time lag of these pulse trains. This is equivalent to calculating the shared area of the unit-height pulses, as shown in Fig. 1D. We took coherence as the sum of these shared areas, divided by the square root of the product of the summed areas of each individual pulse train. For the example shown in Fig. 1, our algorithm gives coherence of 0.35.
Our approach differs from the algorithm used by Wang and Buzsáki (1996), in which trains of unit-height pulses are correlated for a bin width equal to or greater than the neuronal time scale. The difference between the two algorithms can be appreciated by considering the contribution made to the coherence measure by two spikes (in two separate neurons) occurring with time difference . The Wang and Buzsáki (1996) algorithm would see these as perfectly coherent if the spikes are in the same time bin and incoherent if they are not. The answer depends on where the bin edges fall, with probability of a coherence “hit” falling to zero when the bin width is less than . In their algorithm coherence is a function of the bin width, and averaging across the population of cells ameliorates effects due to the placement of bin edges. In our algorithm, the two spikes make a contribution to coherence that is continuously distributed between 0 ( 20% of firing period) and 1 (). Although both algorithms give results that depend on the percentage of the firing period considered significant, our measure allows us to examine coherence in small networks with less discretization error. This change is important here specifically because we analyze small networks that phase-lock with a short but measurable phase difference.
We mapped coherence vs. , , and for networks of 2, 10, and 100 cells with all-to-all inhibitory coupling. In networks with , coherence is plotted in the maps. In larger networks, the plots show the average of the coherence measure taken for all pairs of neurons.
Section 3 Results
3.1 Single self-inhibited neuron
We first consider the firing characteristics of a single self-inhibited neuron or, equivalently, a network of identical, synchronized, mutually inhibitory neurons. These simulations validate predictions from analytic work on simpler models [Chow et al. (1997)] and determine the ranges of the phasic and tonic regimes in parameter space. Firing frequency of the single neuron was tracked over the parameter space of , , and . Figure 2A shows sample time-domain traces for three values of (0.4, 1.6 and 9.0 A/cm2). Like mammalian interneurons, the modeled system of differential equations produces action potentials at rates up to 250 Hz. Figure 2B shows discharge frequency as a function of , for several values of . For large values of (lower traces), this curve is roughly linear. For smaller values (upper traces), discharge frequency rises along a somewhat parabolic trajectory. For negative values of , the self-inhibited neuron can fire at arbitrarily low frequencies (data not shown), indicative of a saddle-node bifurcation and synchrony through slow inhibition [Ermentrout et al. (1996)]. In Fig. 2C we show discharge frequency versus for several values of , with fixed. The dependence of the frequency on for the lower two traces is similar to what was observed in the full network and in vitro by Whittington et al. (1995). The phasic and tonic regimes are clearly illustrated in Fig. 2D, in which the ratio is plotted versus for various values of . For large (top traces), is large and linearly related to , indicative of the tonic regime. In contrast, for small (bottom trace), is small and depends only weakly on , indicative of the phasic regime. For our model and level of heterogeneity, parameter sets that give are in the phasic regime; sets that give are in the tonic regime.
Presence in either the phasic or tonic regime is dependent on parameters other than . Generally, the tonic regime is characterized by strong applied current and a relatively weak synapse so that the firing period is much faster than the synaptic decay time. The phasic regime occurs when either the applied current is weak and/or the synapse is strong so that the firing period is locked to the decay time.
3.2 Two cell network
We simulated networks of two mutually inhibitory cells with self-inhibition. We include self-inhibition because it better mimics the behavior of a large network. In these and all other network simulations, mutual and self-inhibition are of equal weight. In networks of two interneurons with identical properties but different initial conditions, the cells quickly synchronize (phase-lock with zero phase difference) over the entire examined range of , , and (data not shown). Slow-firing cells tend to synchronize more quickly than fast-firing cells, but the exact delay before synchronization depends on initial conditions and was not examined systematically. Anti-synchrony is not stable in the parameter regime we considered, but could be with very small values of .
When the input to each neuron is made mildly heterogeneous (intrinsic spike rates 5% different), a more complex picture emerges. Under the conditions of mild heterogeneity modeled here, but not necessarily under conditions of greater heterogeneity [Golomb and Rinzel (1993)], the behavior of the two-cell network falls into one of four qualitative states, as exemplified by the traces of membrane potential and inhibitory conductance vs. time in Fig. 3. For small , large , and large – conditions associated with the tonic regime – the phasic component of synaptic inhibition received by each cell is small (Fig. 3A). The neurons influence each other’s firing frequencies, but firing times are independent. We refer to this phase-dispersed state as the asynchronous state. As the phasic component of inhibition is increased, the phasic regime is approached. Within the phasic regime lie three qualitative states. For appropriate choices of the level of inhibition, the two-cell network enters a phase-locked state with a non-zero phase difference (Fig. 3B). We will continue to use the term synchrony to refer to this near-synchronous regime. For this model, heterogeneity of some sort (in this case, heterogeneity of intrinsic firing frequencies) is a necessary and sufficient condition for near, as opposed to pure, synchrony [Chow et al. (1997)]. The size of the phase difference depends on the parameters chosen. With further increases in the level of inhibition, the faster cell begins to suppress its slower partner, leading to what we term harmonic locking (Fig. 3C). In this example, cells fire in a 4:3 ratio, and exert temporally complex effects on each other during the course of one cycle ( 50 ms). Finally, with enough inhibition, the faster neuron inhibits its slower counterpart totally, in what we term suppression (Fig. 3D). In suppression, the sub-threshold dynamics of membrane potential in the suppressed cell are exactly phase locked to those of the faster cell. This exact relationship holds because our simulations do not include a synaptic delay term.
Without self-inhibition, this harmonic-locking regime is very small and not seen in the analogous parameter space (data not shown). Our heuristic explanation for this difference is as follows. Without self-inhibition, once the slower neuron is suppressed, the instantaneous preferred frequencies of the two cells diverge. The faster cell is uninhibited and, by firing faster, adds more inhibition to the slower cell, making it more difficult for the slower cell to escape. With self-inhibition, each of the cells in the two-cell network receives an identical synaptic signal, effectively making the two cells more homogeneous. The added homogeneity increases the size of the region in which harmonic locking occurs at relatively small locking ratios.
In order to observe network behavior over a large parameter range, we used the relatively simple measure of firing coherence (see Methods). A given level of coherence does not uniquely determine the qualitative behavior of the network (asynchronous, synchronous, harmonic, or suppressed). However, the structures of coherence maps are stereotyped, and coherence maps can be correlated to the four qualitative network states.
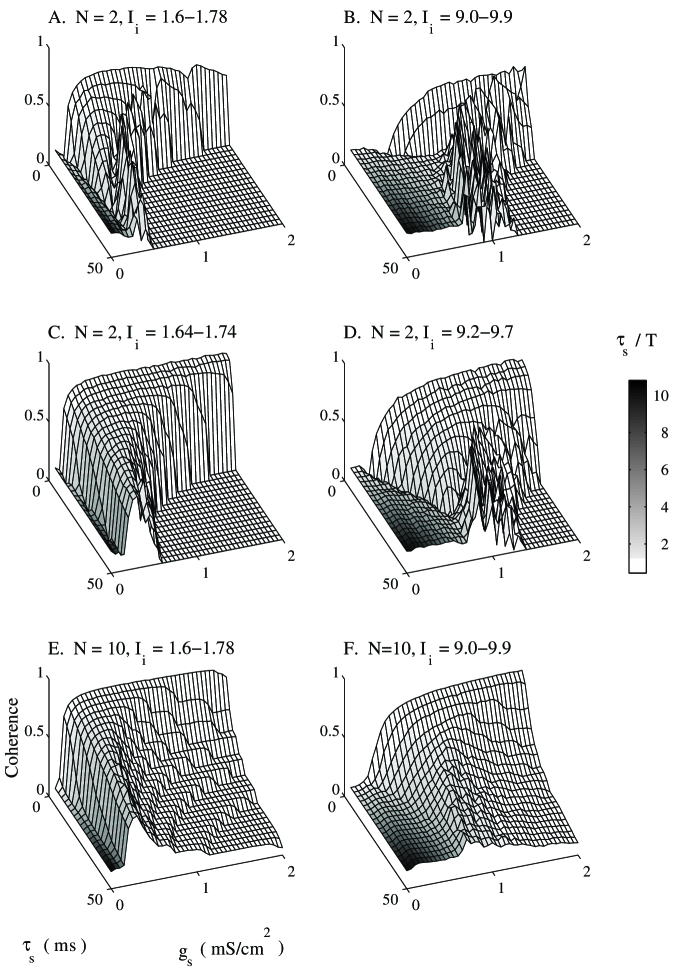
Figures 4A-B show three dimensional plots of coherence in a two-cell network, plotted versus and for low ( and A/cm2) and high ( and A/cm2) applied currents. (The gray scale, which does not relate to coherence, is discussed below.) Even though the differences in intrinsic (uncoupled) firing frequencies for the two cells are small ( in each case), coherence is high and smoothly varying, corresponding to synchrony, only over a small region of parameter space. The extent of the synchronous region increases as decreases. Increasing the heterogeneity reduces the size of the synchronous region. For differences greater than a few percent in the intrinsic (uncoupled) frequencies, the synchronous region was dramatically reduced in size (data not shown).
For a given , synchrony is broken in two distinct ways if is either too small or too large. For large , large , and (especially) small , the phasic coupling between the two cells is weak and they fire asynchronously (i.e., with dispersed phase). In this state, which is particularly large on the left side of Fig. 4B, coherence has a value of about 0.2, corresponding to the expected value of our coherence measure with “memory” equal to 20% of the spiking period. For large , high levels of coherence are lost when the faster cell begins to suppress the slower cell, resulting in harmonic spiking. The particular pattern of harmonic spiking can change dramatically with small changes in parameters, resulting in the jagged coherence regions seen in Figs. 4A-B. Again, the harmonic region is particularly noticeable with large , as in Fig. 4B.
Eventually, with large enough , the full suppression state can take hold, and coherence plummets to give a very flat region of coherence at a value of 0. This state, favored by large and large , occupies a large region on the right side of Fig. 4A.
We argued in the discussion of Fig. 3 that the network’s presence in the asynchronous state is associated with the tonic regime, and that the transition from asynchrony to locking is associated with the transition from the tonic regime to the phasic regime. To demonstrate this effect, we have gray-scale-coded the coherence maps of Fig. 4 according to the value of obtained from single, self-inhibited cells with the same values of and total inhibition and taken as the average of the range seen in the heterogeneous population.
The single-cell value of is useful as an indicator of the qualitative state of all the cells in the network because all the cells that are not suppressed fire at similar frequencies. This result is demonstrated by Fig. 5, which shows plots of for four conditions: the N = 1 case (solid lines), the N = 2 case with differences in intrinsic rates of around 4% (dashed lines) and 2% (dashed-and-dotted lines); and the N = 10 case with maximal heterogeneity of around 4% (dotted lines). In all cases with more than one cell, a pair of traces corresponding to the fastest and slowest cells of the simulations are shown. In all cases, the traces follow similar trajectories until the slowest cell is suppressed (indicated by an abrupt end of the lower branchbefore the rightmost point is reached). This similarity in (and hence ) for all unsuppressed cells is seen in both the phasic (Fig. 5C) and tonic (Fig. 5D, right side) regimes.
Returning to Fig. 4, the value of as a predictor of transitions in qualitative state and hence coherence implies that we should see transitions from asynchrony when drops below . As Figs. 4A-B show, this approximate relationship does hold. Furthermore, factors that change (e.g., changing ; cf. Figs. 3A and 3B) have predictable effects on the extent of the asynchronous state in ()-space.
Figures 4C-D show similar results with less heterogeneity (A/cm2 for panel C; A/cm2 for panel D; these values approximate the mean one standard deviation for uniform distributions with limits as in Figs. 4A-B). In these cases, the same qualitative coherence map is evident, with a somewhat larger region of coherence. The qualitative coherence regions correspond to the same qualitative states from Fig. 3.
3.3 Large networks
We also simulated all-to-all connected networks of 10 and 100 heterogeneous inhibitory neurons and found qualitatively similar results. Figures 4E-F show the coherence plots over the same parameter space as Figs. 4A-B for a network of 10 heterogeneous cells. The level of inhibition per synapse, , scales with to keep the level of inhibition per postsynaptic cell, , constant. For the ten-cell case, applied current is uniformly distributed through the same ranges as in panels A-B ([1.6, 1.78] for panel E; [9.0 9.9] for panel F). Again, there are four qualitative states: an asynchronous state for small , more prevalent with higher ; a near synchronous state; a harmonic state; and a suppressed state. For the 10 cell network, the transition to suppression is smoother than in the two-cell case. Cells fall out of the rhythm to suppression one at a time, leading to a relatively smooth drop in coherence. At the highest values of , coherence has not yet dropped to zero because some cells are still able to synchronize with the fastest neuron of the network. In the harmonic state, examination of time-domain traces (data not shown) reveals harmonic patterns, with a cluster of cells in synchrony while the slower cells drop in and out of the population rhythm. The coherent region for the ten-cell network is larger than in Figs. 4A-B. Applied currents (and hence intrinsic frequencies) of the two neurons in panels A-B are at the limits of the range of applied currents in the ten-cell network, making the effective level of heterogeneity smaller in the ten-cell case. The close agreement between panels C-D and E-F supports this contention.
We also performed a limited number of simulations of a 100-cell network with the same architecture, at parameter values representing orthogonal slices through the 3-dimensional coherence maps. Results from these simulations are shown in Fig. 6, along with slices from the coherence maps of Fig. 4. In Figs. 6A-B, coherence is plotted vs. for a fixed value of = 15 ms and at two levels of applied current. In Figs. 6C-D, coherence is plotted vs. for a fixed value of = 0.5 mS/cm2. Results from the 100-cell (N = 100) and 10-cell (N = 10) cases are quite similar, at both low (panels A, C) and high (panels B, D) levels of applied current. These results support the argument that the qualitative behavior of the network does not change with N, and thus that predictions based on single-cell analysis and simulations are applicable to moderately heterogeneous networks of arbitrary size. Results are shown for both levels of heterogeneity in 2-cell networks. The dashed lines (N = 2), which are slices through the coherence maps of Fig. 4A-B, have lower coherences that reflect the relatively large amounts of heterogeneity in these cases. The dashed-and-dotted lines (N = 2*) show coherence values for slices through Figs. 4C-D, with closer intrinsic frequencies chosen to approximate the standard deviations of the appropriate uniform distributions. These slices more nearly match the 10- and 100-cell cases.
Results from Figs. 5 and 6 also demonstrate the close relationship between the ratio and coherence (as well as underlying qualitative states). Values of from Fig. 5 are almost invariably associated with one of the locked states. Values of , on the other hand, give rise to the asynchronous state, associated in Fig. 6 with regions of flat coherence at a value of 0.2 (e.g., the leftmost portion of Fig. 6B and the rightmost portion of Fig. 6D).
Section 4 Discussion
We show that the behavior of the firing frequency of a single self-inhibited cell can give insight into the network frequency and coherence. In particular, the ratio of the synaptic decay constant to the neuronal firing period has rough predictive value in determining whether a mildly heterogeneous network is synchronous or asynchronous. This predictive value only holds with mild heterogeneity, however; greater heterogeneity leads to a mixture of qualitative states [Golomb and Rinzel (1993)] which invalidates our analyses.
We also emphasize the importance of even mild heterogeneity in affecting network dynamics. Previously, it had been argued that slowly decaying inhibition generally had a synchronizing influence [Gerstner et al. (1996), Terman et al. (1996), van Vreeswijk et al. (1994)]. However, for mildly heterogeneous cells, the relation of the frequency (or period) to the synaptic decay time must also be considered. For homogeneous cells, the synaptic coupling is only required to align the phases in order to obtain synchrony. For mildly heterogeneous cells, the coupling must both align the phases and entrain the frequencies. The latter is more difficult for the network to achieve. It occurs only when the inhibition is strong enough so that firing period is dominated by the decay time. However, if the inhibition is too strong then the slower cells will never fire. Thus, there are two ways to destroy full network synchrony. The first is through effective de-coupling where the cells tend to fire asynchronously. The second is through suppression, in which the neurons with higher intrinsic rates fire in near-synchrony and keep their slower counterparts from firing. Between synchrony and suppression harmonic locking is also possible. This occurs when the suppression of the slower cell is temporary but lasts longer than the period of the faster cell. We should note that anti-synchrony, not seen in the parameter regimes presented here, can become stable with very fast synapses (i.e., ) [Friesen (1994), Perkel and Mulloney (1974), Skinner et al. (1994), van Vreeswijk et al. (1994), Wang and Rinzel (1992)].
For even mildly heterogeneous cells, synchrony in which all inhibitory cells participate is possible only over a small region of parameter space that decreases as the heterogeneity is increased. The region where synchrony occurs in a large network of known (mild) heterogeneity and connectivity can be approximated from a two-cell network. The frequency of firing and conditions allowing synchrony can be estimated analytically from a reduced model neuron with self-inhibition [Chow et al. (1997)] As in large networks [Traub et al. (1996a)], the frequency in single cells depends on the applied current, the synaptic strength and the synaptic decay time. In the synchronous region, the firing period depends linearly on the decay time and logarithmically on the other parameters so that frequency will depend directly on the decay rate. However, the contribution from the logarithmic factor can be fairly large and thus must be calculated explicitly. This can be estimated analytically from the reduced model [Chow et al. (1997)], or from simple simulations of a single, self-inhibiting cell (see Fig. 2).
The result that the value of from single-cell simulations has predictive value for the qualitative state and coherence of a network of arbitrary size is intriguing and potentially useful, because it points the way to determining the qualitative and quantitative behavior of a neuronal network based on simple behavior that can be studied numerically or even analytically. However, the predictive capabilities of this index should not be overestimated. A careful examination of Fig. 4 shows that the mapping between and asynchrony is not precise. The value of at which the transition will occur is dependent on many factors, including the level of heterogeneity and, in all likelihood, the level and form of connectivity in the network. The value of alone is not sufficient to determine the point of transition from synchrony to harmonic locking and suppression, even in a model of known heterogeneity and architecture. Making this determination requires knowledge of and in addition to [Chow et al. (1997)].
Studies of the 2-cell network were successful in elucidating the qualitative states of the larger circuit, though the exact form of transitions from asynchrony to synchrony and synchrony to suppression is different in detail for our simulations of the 2-cell and N-cell cases. In general, the behavior of the 2-cell network matches that of the N-cell circuit better in the asynchronous state, associated with the tonic regime, than in the harmonic and suppression states, associated with the phasic regime. This result is expected from our theoretical framework since the tonic regime is defined as the regime in which only the tonic level of inhibition is important. Since we normalized the synaptic strength by N, the net amount of inhibition is independent of the network size. Thus, we take this result as additional evidence that our hypothesized mechanisms of loss of coherence are correct.
Our numerical results are similar to those of Wang and Buzsáki (1996), but our explanations differ considerably. In heterogeneous networks, they also saw a decline in coherence with both low and high firing rates. They attributed the decline in synchrony for low rates to two factors. First, they point out that cells are more sensitive at low firing rates than at higher rates to changes in applied current, a source of heterogeneity in both studies. This point is correct, but in our work we controlled for this factor, using smaller percent differences in small currents than in large currents to achieve similar percent differences in intrinsic firing rates, and we still saw a drop-off in coherence at low rates. Second, Wang and Buzsáki (1996) cite what they call a “dynamical” effect, in which inhibition is fast enough to destabilize the synchronous state. Previous work [van Vreeswijk et al. (1994), Wang and Rinzel (1992)] shows that the outcome of such dynamical effects for homogeneous networks is anti-synchrony. In our parameter regime, the loss of coherence in heterogeneous networks at low firing rates (i.e., with small) is associated with the phasic regime and is due to suppression of firing in slower cells. Wang and Buzsáki (1996) make the phenomenological argument that the loss of synchrony at high firing rates is related to a need for greater density of synaptic connectivity. We considered all-to-all connectivity and found that loss of coherence associated with high firing rates (tonic regime) is caused by a loss of too much of the phasic component of inhibition. Furthermore, we argue that one can approximate the parameters for which this loss of coherence occurs by analyzing the single, self-inhibitory cell. It should be possible to generalize these results and arguments to the case with less than all-to-all coupling.
It has been suggested that the selection of the network frequency in vivo is determined by the tonic excitation and the parameters regulating the synaptic coupling [Traub et al. (1996a)]. Our results support this hypothesis. However, we have demonstrated that with heterogeneous cells, synchrony may not be possible at all frequencies. In particular, a network of this kind seems unlikely to support synchronous firing at 200 Hz, a frequency that seems too fast to be synchronized by GABAA receptors with ms (and ). Our framework implies that this result, which has been seen in simulations before [Wang and Buzsáki (1996)], holds in general for heterogeneous cells in the tonic regime.
Our results emphasize the difficulty of generating synchronous oscillations in interneuronal networks over a large range of frequencies, such as in the transition from the gamma/theta mode to the sharp wave/fast ripples mode. At gamma frequencies, the factor should be less than 1 with typical values of . Thus, full synchrony at gamma frequencies is possible but requires careful regulation of the system to prevent suppressive effects. The question of whether or not the suppression we see is incompatible with physiological data cannot be answered, because it is extremely difficult to estimate the number of interneurons participating in the rhythm. We believe that this issue can be explored, and our model tested, by examining the power of the gamma field potential in a brain slice as is modified by pentobarbital. Our model predicts that the power in this signal should decrease as rises and suppression becomes more evident. A negative result in these experiments would indicate that our model is missing a fundamental element. One such element is intrinsic or synaptic noise, which can act to release neurons from suppression (White, unpublished observations).
The more difficult goal for our model to achieve is that of firing synchronously at ripple (200 Hz) frequencies, as has been reported in the behaving animal [Ylinen et al. (1995)]. One or more of several conceivable explanations may underlie this apparent robustness in hippocampal function at high frequencies. First, it is possible, but unlikely, that heterogeneity in the intrinsic firing frequencies of interneurons is very low (%). Second, the operant value of may be lower than we believe; a value of 5 ms would conceivably allow synchrony at 200 Hz with levels of heterogeneity of around 5%. Third, each interneuron may fire not at 200 Hz, but rather at a lower frequency of, say, 100 Hz, during sharp waves. Under this explanation, the 200-Hz ripple would be generated by clusters of two or more populations of neurons spiking independently. Finally, some factor(s) not considered here may enhance synchrony at high frequencies. Gap junction-mediated electrical coupling among interneurons, for which some evidence exists in the hippocampal region CA1 [Katsumaru et al. (1988)], is perhaps the most likely such factor [Traub (1995)].
Acknowledgements
We thank M. Camperi for assistance in writing code, and S. Epstein, O. Jensen, C. Linster, and F. Nadim for helpful discussions. B. Ermentrout, J. Rinzel, and R. Traub provided valuable feedback on earlier versions of the manuscript. This work was supported by grants from the National Science Foundation (DMS-9631755 to C.C., N.K. and J.W.), the National Institutes of Health (MH47150 to N.K.; 1R29NS34425 to J.W.), and The Whitaker Foundation (to J.W.)
References
- Bose et al. (1997) Bose A, Terman D, and Kopell N. (1997) Manuscript in preparation.
- Bragin et al. (1995) Bragin A, Jandó G, Nádasdy Z, Hetke J, Wise K, and Buzsáki G. (1995) Gamma (40-100 Hz) oscillation in the hippocampus of the behaving rat. J. Neuroscience 15:47-60.
- Buzsáki (1986) Buzsáki G. (1986) Hippocampal sharp waves: their origin and significance. Brain Res. 398:242-252.
- Chow et al. (1997) Chow CC, White JA, Ritt J, and Kopell N. (1997) Manuscript in preparation.
- Ermentrout et al. (1996) Ermentrout B. (1996) Type I membranes, phase resetting curves, and synchrony. Neural Comp. 8:979-1001.
- Ernst et al. (1995) Ernst U, Pawelzik K, and Geisel T. (1995) Synchronization induced by temporal delays in pulse-coupled oscillators. Phys. Rev. Lett. 74:1570-1573.
- Friesen (1994) Friesen W. (1994) Reciprocal inhibition, a mechanism underlying oscillatory animal movements. Neurosci Behavior 18:547-553.
- Gerstner et al. (1996) Gerstner W, van Hemmen JL, and Cowen J. (1996) What matters in neuronal locking? Neural Computation 8:1653-1676.
- Golomb and Rinzel (1993) Golomb D and Rinzel J. (1993) Dynamics of globally coupled inhibitory neurons with heterogeneity. Phys. Rev. E 48, 4810-4814.
- Gray (1994) Gray CM. (1994) Synchronous oscillations in neuronal systems: mechanisms and functions. J. Comp. Neuro. 1:11-38.
- Hansel et al. (1995) Hansel D, Mato G, and Meunier C. (1995) Synchrony in excitatory neural networks. Neural Comp. 7:307-337.
- Jeffreys et al. (1996) Jeffreys JGR, Traub RD, and Whittington MA. (1996) Neuronal networks for induced ‘40 Hz’ rhythms. Trends Neurosci. 19:202-207.
- Katsumaru et al. (1988) Katsumaru H, Kosaka T, Heizman CW, and Hama K. (1988) Gap-junctions on GABAergic neurons containing the calcium-binding protein parvalbumin in the rat hippocampus (CA1 regions). Exp. Brain Res. 72:363-370.
- Llinás and Ribary (1993) Llinás R and Ribary U. (1993) Coherent 40-Hz oscillation characterizes dream state in humans. Proc. Natl. Acad. Sci. USA 90:2078-2081.
- Perkel and Mulloney (1974) Perkel D and Mulloney B. (1974) Motor patterns in reciprocally inhibitory neurons exhibiting postinhibitory rebound. Science 185:181-183.
- Pinsky and Rinzel (1994) Pinsky P and Rinzel J. (1994) Intrinsic and network rhythmogenesis in a reduced Traub model for CA3 neurons. J. Comp. Neurosci. 1:39-60.
- Skinner et al. (1994) Skinner F, Kopell N, and Marder E. (1994) Mechanisms for oscillations and frequency control in networks of mutually inhibitory relaxation oscillators. J. Comp Neurosci. 1:69-87.
- Terman et al. (1996) Terman D, Bose A, and Kopell N. (1996) Functional reorganization in thalamocortical networks: transition between spindling and delta sleep rhythms. Proc. Natl. Acad. Sci. USA 93:15417-15422.
- Traub (1995) Traub RD. (1995) Model of synchronized population bursts in electrically coupled interneurons containing active dendritic conductances. J. Comp. Neurosci. 2:283-289.
- Traub et al. (1996a) Traub RD, Whittington M, Colling S, Buzsáki G, and Jefferys J. (1996a) Analysis of gamma rhythms in the rat hippocampus in vitro and in vivo. J. Physiol. 493:471-484.
- Traub et al. (1996b) Traub RD, Jefferys JGR, and Whittington MA. (1996b) Simulation of gamma rhythms in networks of interneurons and pyramidal cells. J. Comp. Neurosci. In press.
- Tsodyks et al. (1993) Tsodyks M, Mitkov I, and Sompolinsky, H. (1993) Pattern of synchrony in inhomogeneous networks of oscillators with pulse interactions. Phys. Rev. Lett. 71:1280-1283.
- Wang and Buzsáki (1996) Wang X-J and Buzsáki G. (1996) Gamma oscillation by synaptic inhibition in an interneuronal network model. J. Neurosci. 16:6402-6413.
- Wang and Rinzel (1992) Wang X-J and Rinzel J. (1992) Alternating and synchronous rhythms in reciprocally inhibitory model neurons. Neural Comp. 4:84-97.
- Whittington et al. (1995) Whittington MA, Traub RD, and Jefferys JGR. (1995) Synchronized oscillations in interneuron networks driven by metabotropic glutamate receptor activation. Nature 373:612-615.
- van Vreeswijk et al. (1994) van Vreeswijk C, Abbott L, and Ermentrout GB. (1994) When inhibition not excitation synchronizes neural firing. J. Comp. Neuroscience 1:313-321.
- Ylinen et al. (1995) Ylinen A, Bragin A, Nádasdy Z, Jandó G, Szabó I, Sik A, and Buzsáki G. (1995) Sharp wave-associated high-frequency oscillation (200 Hz) in the intact hippocampus: network and intracellular mechanisms. J. Neurosci. 15:30-46.