Scaling in Counter Expressed Gene Networks Constructed from Gene Expression Data
Abstract
We study counter expressed gene networks constructed from gene-expression data obtained from many types of cancers. The networks are synthesized by connecting vertices belonging to each others’ list of -farthest-neighbors, with being an a priori selected non-negative integer. In the range of corresponding to minimum homogeneity, the degree distribution of the networks shows scaling. Clustering in these networks is smaller than that in equivalent random graphs and remains zero till significantly large . Their small diameter, however, implies small-world behavior which is corroborated by their eigenspectrum. We discuss implications of these findings in several contexts.
pacs:
89.75.-k, 87.16.Yc, 05.65.+b, 87.10.+eGene networks are fundamental objects underlying the regulatory mechanism of biological systems. Small portions of these networks have been studied by molecular biologists since long using mutagenesis techniques pivoted on manipulation of single gene, or at best a few genes, at a time Mutagen . Consequently, unraveling of gene networks has been slow. Recent advancements in DNA microarray technology Microarray have made large scale studies of gene networks possible. Attempts have been made at identifying large segments of regulatory networks using data from gene microarray expression assays Network . An aspect of these studies is identification of groups of coregulated genes. This is done using specialized clustering techniques developed in recent years Eis98Blat98Agr03 . Genes in each coexpression group display similar expression pattern across different samples and are expected to be coregulated. Identification of coexpressed genes is almost a standard exercise in the expression profiling studies undertaken at present.
Regulatory genes function by means of both activating (up regulating) as well as inhibiting (down regulating) the expression of genes. Knocking out of such a gene leads to simultaneous change in the expression of genes that were either up or down regulated by it. This may, in turn, result in a cascade affecting other genes and destabilizing the organism. Thus, the coregulated genes are not necessarily only coexpressed, they can also be counter expressed. Recent studies have verified that both increase and decrease of expression level of genes are equally discriminatory indicators of genetic pathologies Erns02 . Studies on large scale properties of coexpressed gene networks constructed from gene expression data have shown them to be having both small-world and scale-free characteristic Agr02 . In this letter we analyze counter expressed gene networks constructed from gene expression data and outline results showing their relevance in biological processes.
Raw gene expression data requires extensive processing before it can be used (see Preproc for details). This gives an expression matrix having rows, each with zero mean and unit variance, corresponding to the genes and columns corresponding to the samples. Henceforth this is the expression matrix that we use and refer to. The algorithm for constructing counter expressed gene networks is a modification of the algorithm used earlier for constructing coexpressed gene networks Agr02 . It requires specification of the maximum number of neighbors , , that a vertex can have. For a given , counter expressed gene network is constructed using the following two step procedure. (i) For each vertex , , …, , make a list of its farthest neighbors ordered by decreasing distance. (ii) Connect all vertices and through an edge if and , otherwise the vertices are not connected. We choose Euclidean distance as the measure for making the list of farthest neighbors. The use of other distance measures will not alter the results as long as they preserve the ordering of points obtained from the Euclidean measure.
The topological structure of these networks, as in the case of coexpressed gene networks Agr02 , is highly dependent on . Starting with isolated vertices at , the network agglomerates very rapidly as is increased and a single connected component is obtained for , . A giant connected component emerges for . As this algorithm preferentially connects vertices that are far away from each other, it selectively disfavors the formation of triangles. Consequently, we expect that the clustering coefficient of these networks will be lower than that of equivalent random graphs having the same number of vertices and edges. The formation of squares, however, is preferred. The squares occur as long as there are two groups of at least two vertices each such that the smallest distance between vertices of different groups is larger than the largest distance between vertices of the same group. The formation of squares, despite the absence of triangles, makes the average length of shortest paths between vertices small and gives these networks and their connected components a small-world structure.


We analyzed counter expressed networks constructed using gene expression data from several types of cancers Nott01 ; Golu99 ; Pero99 . Let be the degree of vertex , be the largest degree in the network, be the degree density
| (1) |
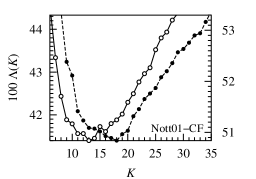
and be the distribution. For each network we calculated , , and the homogeneity in terms of the homogeneity order parameter defined earlier Agr02 . The variation of homogeneity in both coexpressed and counter expressed gene networks constructed from colon cancer data Nott01 is shown in Fig. 1. The figure clearly shows that on increasing the homogeneity of both the types of networks first decreases for small , reaches a minimum, and then increases to its maximum value of at . The minimum, as seen in the Fig. 1, is somewhat noisy and flat in both the networks. Furthermore, for the same the homogeneity of the counter expressed networks is smaller than that of the coexpressed networks, except at of the order of .
Figure 2 shows the variation of the observed cumulative probability distribution function with normalized degree in a wide range of values of for counter expressed networks constructed from several gene expression data sets. From the figure it is clear that in the range of corresponding to the flat minimum of the order parameter , the degree distributions of the networks collapse together and show good scaling for all the data sets. The tails of these distributions fit well with the form
| (2) |
where and are fit parameters. This implies that the corresponding has scale-free behavior of the form in the tails, sharply truncated at . As the number of hubs in these networks varies in the range –, the observed is consistent with that expected for sharply truncated power-law probability density with exponent , where is th Harmonic number.


The scale-free behavior, seen above in – of the range of variation of the normalized degree, is also indicated by the spectral density of the eigenvalue spectrum of the adjacency matrix of the networks Far01Goh01
| (3) |
where is the th eigenvalue. Figure 3 shows that develops a triangular form for , indicating the presence of a power-law in the networks. The triangular shape persists till . For , is highly skewed with several blurred peaks indicating the presence of small-world behavior. Similar behavior observed earlier in coexpressed gene networks Agr02 was accompanied by very high clustering coefficient. In the present case, however, the clustering coefficient has a completely different behavior. This implies that the structural details of counter and coexpressed networks, contrary to the intuition, are very different.


The clustering coefficient of a vertex of degree is defined as
| (4) |
where is the total number of links present among the neighbors of the vertex. The clustering coefficient of the network is defined as the mean of in two different ways. First, it is the average over all the vertices. Second, it is the average taken only over vertices of degree at least 2. The clustering coefficient of the equivalent random graph is , where is the number of edges in the graph Watt98 .
The variation of the clustering coefficient with for both coexpressed and counter expressed gene networks is shown in Fig. 4. The figure clearly shows that of coexpressed networks is much higher than that of equivalent random graphs for all . It is almost constant at for small and then increases to its maximum values of 1 as increases to . The also has similar behavior except at small when it increases rapidly from at to at and then to at . Despite this remains higher than that for the corresponding random graphs for all , except at when both are 1, as seen by the variation of in Fig. 4.
Figure 4 shows that the clustering coefficient of counter expressed gene networks remains smaller than that for the corresponding random graphs for all . Both become equal and equal to their maximum value of 1 only at . Furthermore, both and remain zero till significantly large in these networks (here ). This is a consequence of absence of triangles. Selective disfavoring of triangle formation, in general, leads to for all .


The most important indicator of small-world behavior is the mean and the maximum of the shortest paths between mutually reachable vertices. In disjoint networks these are defined by using only the finite length shortest paths. In all networks having vertices, and are bounded in and , respectively. The variation of with in both counter expressed and coexpressed gene networks is shown in Fig. 5. The figure shows that in both types of networks , starting with 1 at , decreases sharply as increases till , the value at which giant connected component emerges in the network. On increasing further, decreases and attains a minimum at . This occurs because large chunks merge, forming still larger chunks and introducing paths, longer than , connecting vertices across the merged chunks. At the effect of long paths introduced by merging of chunks is balanced by the simultaneously introduced short paths and reduction in the length (if any) of existing paths due to new shortcuts within the chunks. Increasing beyond leads to decrease in , as seen by the behavior of in Fig. 5, till the vertices form a complete graph. In data containing widely separated big chunks, merging and consequent rapid increase in can occur at . This will appear as sharp dips in the presently smooth versus curve seen in Fig. 5. The figure shows that immediately after the minimum, follows very well till the onset of finite size effects at large , where is mean degree. This behavior is characteristic of both random graphs and small-world networks Alb02Dor02 . The behavior of , although more noisy, was similar to that of .


Zero clustering for and very low clustering otherwise observed in counter expressed networks is a consequence of the definition of clustering coefficient which looks for triangles in the network. This definition, although good for random graphs, does not always reveal the actual extent of clustering. We defined new clustering coefficient using squares instead of triangles by setting in Eq. (4) to the number of pairs of neighbors of that have at least one more common neighbor. The square based clustering coefficients and , computed similarly to and , respectively, have much higher values relative to random graphs for both counter expressed and coexpressed networks. The value for random graphs is the probability that two vertices connected to a vertex (say, “O”) have another common neighbor (say, “”; ). It evaluates to for large , where is the edge density. The variation of is shown in Fig. 6. The behavior of is similar. These results show that clustering in counter expressed networks, despite being zero, is actually very high and comparable to that in coexpressed networks.
An implication of for is that all the connected components comprising the counter expressed networks are bipartite for these values of . This allows each connected component to be partitioned into two groups such that the genes within each group are coexpressed but those in different groups are counter expressed. This is done by assigning a gene to one group (say, A) and its neighbors to the other group (say, B) and then iteratively assigning neighbors of genes in group A (or, B) to group B (or, A) till no gene in the connected component remains unassigned. This procedure can be used even if the network contains triangles by first eliminating them, e.g., in the counter expressed networks for , by iteratively identifying all the links forming triangles and removing the smallest one. Triangle elimination may decompose a connected component into two or more parts. In such a case, isolated vertices, doublets, and small chunks are ignored and each of the big chunks is separately processed further. However, the larger the number of triangles that need to be removed before partitioning, the smaller will be the clarity of partitions.
The results presented above were verified using counter expressed networks constructed from several other gene expression data sets also OtherData . Flat minimum of implies that counter expressed gene networks have non-trivial structure that is robust against noise. High and imply that the structure is highly clustered. Thus, these networks can be used for non-parametric partitioning of gene expression data. The scale-free character of these networks implies that they are built around few crowded hubs and are robust. The small-world structure, a key evolutionary aspect, implies that signaling mechanism encoded by these networks, despite the lack of triangles, functions as efficiently as that of coexpressed networks. These results show that the role of counter expressed networks is as important in biological processes as that of coexpressed networks. Thus, despite difference in their regulatory behavior (activating versus inhibiting gene expression), both these types of networks should be considered together.
References
- (1) D. Botstein and D. Shortle, Science 229, 1193 (1985); C. R. Geyer, A. Colman-Lerner, and R. Brent, Proc. Natl. Acad. Sci. U.S.A. 96, 8567 (1999); W. L. Stanford, J. B. Cohn, and S. P. Cordes, Nat. Rev. Genet. 2, 756 (2001).
- (2) A. C. Pease et al., Proc. Natl. Acad. Sci. U.S.A. 91, 5022 (1994); M. Schena, D. Shalon, R. W. Davis, and P. O. Brown, Science 270, 467 (1995).
- (3) D. K. Slonim, Nat. Genet. Sup. 32, 502 (2002); H. Zhu and M. Snyder, Curr. Op. Cell Biol. 14, 173 (2002).
- (4) M. B. Eisen et al., Proc. Natl. Acad. Sci. U.S.A. 95, 14863 (1998); M. Blatt, S. Weizmann, and E. Domany, Phys. Rev. Lett. 76, 3251 (1998); H. Agrawal and E. Domany, Phys. Rev. Lett. 90, 158102 (2003).
- (5) T. Ernst et al., Am. J. Pathol. 160, 2169 (2002).
- (6) H. Agrawal, Phys. Rev. Lett. 89, 268702 (2002).
- (7) R. Nadon and J. Shoemaker, Trends Genet. 18, 265 (2002); J. Quackenbush, Nat. Rev. Genet. 2, 418 (2001).
- (8) D. A. Notterman et al., Cancer Res. 61, 3124 (2001).
- (9) T. R. Golub et al., Science 286, 531 (1999).
- (10) C. M. Perou et al., Proc. Natl. Acad. Sci. U.S.A. 96, 9212 (1999).
- (11) I. J. Farkas, I. Derényi, A.-L. Barabási, and T. Vicsek, Phys. Rev. E 64, 026704 (2001); K.-I. Goh, B. Kahng, and D. Kim, ibid. 64, 051903 (2001).
- (12) D. J. Watts and S. H. Strogatz, Nature (London) 393, 440 (1998).
- (13) R. Albert and A.-L. Barabási, Rev. Mod. Phys. 74, 47 (2002); S. N. Dorogovtsev and J. F. F. Mendes, Adv. Phys. 51, 1079 (2002).
- (14) A. Bhattacharjee et al., Proc. Nat. Acad. Sci. U.S.A. 98, 13790 (2001); D. G. Beer et al., Nat. Med. (NY) 8, 816 (2002); S. A. Armstrong et al., Nat. Genet. 30, 41 (2002).
- (15) Keys in the graphs are as follows. Golu99-I (Golu99-T): 1049 (1030) genes in 34 (38) samples of the independent (training) set from acute leukemia data Golu99 . Pero99-26: 1030 genes in 26 samples in breast cancer data Pero99 . Nott01-CF: 1211 genes in 36 samples from colon cancer data Nott01 . All the data sets were preprocessed as in Agr02 .