Spin-Lattice Relaxation in Metal-Organic Platinum(II) Complexes
Abstract
The dynamics of spin-lattice relaxation (slr) of metal-organic Pt(II) compounds is studied. Often, such systems are characterized by pronounced zero-field splittings (zfs) of the lowest-lying triplets. Previous expressions for the Orbach slr process do not allow to treat such splitting patterns properly. We discuss the behavior of a modified Orbach expression for a model system and present results of a fit of the temperature dependence of the spin-lattice relaxation rate of Pt(2-thpy)2 based on the modified expression.
keywords:
Metal-organic Platinum(II) complexes, Shpol’skii matrices, Spin-lattice relaxation, Orbach process, Raman process, Direct process, Triplets, Zero-field splittings, , and ††thanks: Author for correspondence. Address: PD Dr. H. H. H. Homeier, Institut für Physikalische und Theoretische Chemie, Universität Regensburg, D-93040 Regensburg, Germany. FAX: +49-941-943 4719. Email: Herbert.Homeier@na-net.ornl.gov ††thanks: WWW: http://www.chemie.uni-regensburg.de/hoh05008 ††thanks: Author for correspondence. Address: Prof. Dr. H. Yersin, Institut für Physikalische und Theoretische Chemie, Universität Regensburg, D-93040 Regensburg, Germany. FAX: +49-941-943 4488. Email: Hartmut.Yersin@chemie.uni-regensburg.de
Transition metal complexes with organic chelate ligands and their lowest excited states are of potential use for solar energy conversion [1, 2, 3, 4, 5, 6, 7]. Recently, the processes of spin-lattice relaxation and the decay behavior of excited states have been studied experimentally for such systems in Shpol’skii matrices. [8, 9, 10, 11, 12, 13, 14] Of special importance are compounds with a Pt(II) central ion. Pt(II) systems exhibit many different types of low-lying excited triplets that include metal-centered (MC) dd∗ states [15, 16], metal-to-ligand-charge-transfer (MLCT) states [17, 18, 19], intra-ligand-charge-transfer (ILCT) states [10, 13, 20], ligand-ligand′-charge-transfer (LL′CT) states [6, 7], and ligand-centered (LC) states with some MLCT and/or MC contribution [21, 22, 23]. In the following, we focus to Pt(II) systems with heterocyclic chelate ligands.
| Complex | E | Type | Ref. | |||
|---|---|---|---|---|---|---|
| Pt(2-thpy)2a) | 17156 | 7 | 9 | 710 | LC/MLCT | [9, 21, 14] |
| Pt(2-thpy)(CO)Cla) | 18012 | 0.055 | 3.8 | 3000 | LC/MLCT | [14, 24] |
| Pt(phpy)2a) | 19571 | 6.9 | 25.1 | 390 | LC/MLCT | [14] |
| Pt(3-thpy)2a) | 18020 | 13 | 9 | 25 | LC/MLCT | [25, 26] |
| [Pt(bpy)2](ClOb) | 21237 | 1 | 1 | LC/MC | [23] | |
| Pt(qol)2a) | 15426 | 1 | 1 | ILCT | [10, 13] | |
| Pt(qtl)2a) | 13158 | 1 | 1 | 7000 | ILCT | [13] |
| Pt(phpy)(CO)Cla) | 20916 | 1 | 6.4 | LC/MLCT | [27] | |
| Pt(bhq)2c) | 19814 | 11 | 28 | LC/MLCT | [28] | |
| Pt(phpz)2a) | 22952 | 9 | 7 | LC/MLCT | [25] |
2-thpy-: 2-(2-thienyl)pyridinate;
phpy-: 2,2′-phenylpyridinate;
3-thpy-: 2-(3-thienyl)pyridinate;
bpy: 2,2′-bipyridine;
qol-: 8-quinolinolate;
qtl-: 8-quinolienthiolate;
bhq-: benzo[h]quinolinolate;
phpz-: 2,2′-phenylpyrazinate.
a) In n-octane b) Neat material c) In n-decane
As shown in Tab. 1, the low-lying triplets of these systems are characterized by a rather large variation of zero-field splittings (zfs) in the range from less than 0.1 to about 40 . The larger splittings are mainly due to spin-orbit coupling. For the same complex in different matrices, the lowest triplet states are shifted in energy (in many cases in the range of 200 – 400 ). The corresponding optical spectra show rich vibrational structure that may be well resolved (about 2) by choosing appropriate matrices and by employing methods of emission and/or excitation line narrowing.
At low temperatures (several Kelvin), the processes of spin-lattice relaxation occurring between the triplet sublevels , , and are relatively slow with relaxation times as long as hundreds of nano-seconds and even up to many micro-seconds (See Tab. 1 and Refs. [9, 10, 11, 12, 13, 14]) due to the low density of phonon states corresponding to such zfs patterns.
To discuss these processes, we assume that the perturbation caused by the phonons couples the electronic states of the chromophore essentially linearly (e.g. see Ref. [29, p. 228])
| (1) |
where is the strain corresponding to the phonon mode with wave vector in the long wavelength limit. The matrix elements of are denoted by and analogous expressions for and . The energy differences are between and , between and , and between and . The usual notation for given temperature and Boltzmann constant , and the abbreviations and analogous ones for and are also used. Here, the parameter is defined in terms of mass density and (average) velocity of sound of the matrix. The dependence of should be kept in mind.
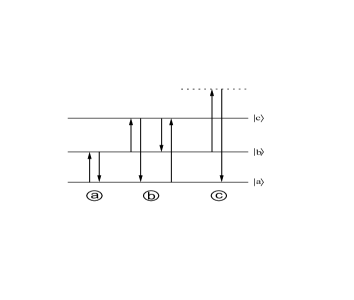
The following relaxation processes (see Fig. 1) occur:
Direct process:
Orbach process:
The rate for this process vanishes for K exponentially. It depends on the splitting pattern of the three involved states: If the energy separation of the two lower states and is much smaller than both the energy separations and to the upper state , then the well-known expression
| (4) |
holds approximately for low . This original Orbach expression is derived under the assumption that the energy differences are given by . For a more general zfs pattern, the rate is given by the low-temperature approximation [31]
| (5) |
with up and down rates as given in Eq. (Direct process:). The modified expression (5) contains Eq. (4) as a limiting case (see Ref. [31]).
Raman process:
For low temperature, the rate may be approximated by
| (6) |
with a constant and for non-Kramers ions [32]. In the cases under study, this dependence fits the experimental observations [31] better than the dependence observed in other systems.
The relative importance of the various slr processes is largely dependent on the size of the zfs and the energy separations to further electronic states. For instance, in systems like Pt(qol)2 and Pt(qtl)2 with a very small total zfs (see Tab. 1) and no further electronic states in the vicinity of T1, direct and Orbach processes are expected to be very small due to the dependence of these processes, and the Raman process is expected to dominate. Compare also Ref. [31].

The behavior of the above expressions is illustrated for a model system (without a Raman process) and with parameters , m/s, g/cm3, , , . In Fig. 2, the relative errors of the approximations for both direct and Orbach process, i.e., for the sum as obtained using Eq. (2) in combination either with Eq. (4) or Eq. (5), respectively. The errors are calculated with respect to the exact rate
| (7) | |||||
for the three-level system that is obtained from the rate equations [31].
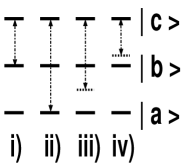
Applying the original Orbach expression, i.e., using Eq. (4) in combination with (2) for the direct process, the prefactor was computed from the model parameters, but different values of the parameter have been used: corresponds to using the minimum distance of state to the states and (curve i) in Fig. 2), corresponds to using the maximum distance (curve ii)), and corresponds to using the mean distance (curve iii)). The value is obtained by a least square fit of the exact data with one fit parameter (curve iv)), i.e., for the direct process and the prefactor of Eq. (4), the exact expressions were used during the fit. Interestingly, is less than any of the other differences of the energies. Alternatively, one could try to use the prefactor in Eq. (4) as an additional fit parameter. But then, one cannot hope to extract the model values of and from such a fit. Finally, curve v) in Fig. 2 was obtained using the modified expression (5) in combination with Eq. (2) for the direct process. Clearly, the modified approach yields much reduced errors over a large temperature range. Thus, Orbach’s original expression (4) that was designed for a different pattern of the energy levels cannot be applied to a pattern with for any reasonable choice of the parameter .
We remark that similar results are also obtained for different choices of the parameters. For instance, for a value of smaller by a factor , the same results for the absolute rates would be obtained, if all the matrix elements of are also chosen smaller by a factor , e.g., for m/s and , , . Moreover, fixing all the other parameters, any rescaling of the three matrix elements by an arbitrary common positive factor yields the same error curves since we are dealing with relative errors and, under this scaling, all up and down rates , etc., and, hence, all slr rates in the model are multiplied by a common factor.
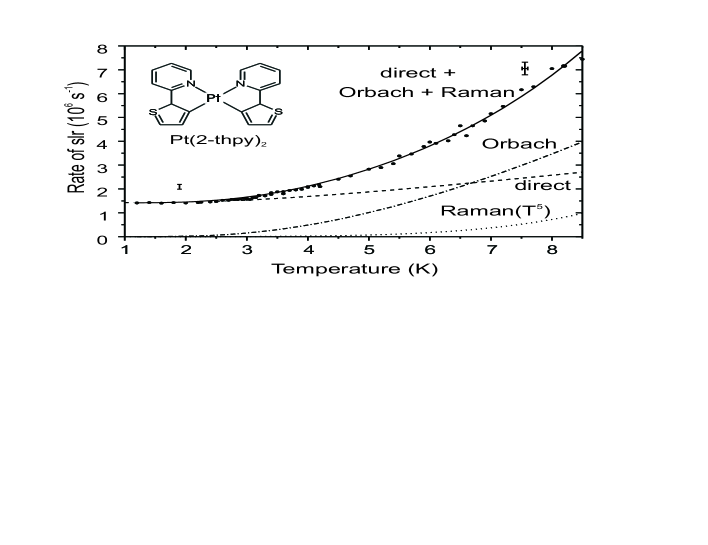
It is of interest to present an example of the application of the above formalism to the spin-lattice relaxation observed for the lowest triplet of the Pt(2-thpy)2 complex in an n-octane matrix. This compound is depicted in of Fig. 3, and some properties are collected in Table 1. The experimental spin-lattice relaxation rate is obtained from the measured emission decay rate of state by subtraction of the corresponding triplet deactivation rate to the ground state [31]. For the fit, we used Eq. (2) for the direct process, the modified expression (5) for the Orbach process, and Eq. (6) with for the Raman process, i.e., for a low temperature dependence. As prefactor of the direct process, we used the low temperature limit of . The ratio of can be obtained independently from time-resolved excitation spectra [9, 31]. Also, all energy separations and are available from highly resolved spectra [9, 21, 14, 31]. Thus, as fit parameter, only the prefactor of the Raman process and the constant remain. For such a two-parameter fit as displayed in Fig. 3, the result is highly satisfactory.
A three-parameter fit based on the original Orbach expression (4) using the parameters , and the prefactor in Eq. (4) yields the value (and a nearly doubled prefactor for the Raman process in comparison to the fit displayed in Fig. 3). A similar value for was obtained in Ref. [9] by a somewhat different fitting procedure. Both these values are unphysical since they do not correspond to any of the observed energy differences (see Tab. 1). We remark that the present study was triggered by this difficulty of using the original Orbach expression (4).
This result shows, as further ones presented in [33, 31], that the use of the modified expression (5) for the Orbach process is necessary for a detailed understanding of the dynamics of the spin-lattice relaxation for low-lying triplets of metal-organic transition metal compounds with their characteristic patterns of zero-field splitting. Thus, although the present study concentrated on Pt(II) compounds, the result should be applicable to a more general class of compounds, namely, the whole platinum metal group complexes (compare, e.g., the recent results [8, 9] for [Ru(bpy)3]2+).
Financial support by the Deutsche Forschungsgemeinschaft and the Fonds der Chemischen Industrie is gratefully acknowledged.
References
- [1] J. S. Conolly (Ed.), Photochemical Conversion and Storage of Solar Energy, Academic Press, New York, 1981.
- [2] A. Harriman, M. A. West (Eds.), Photogeneration of Hydrogen, Academic Press, London, 1982.
- [3] G. Calzaferri (Ed.), Proceedings of the 10th International Conference on Photochemical Transformation and Storage of Solar Energy, volume 38 of Solar Energy Materials and Solar Cells, Interlaken, 1994.
- [4] B. O’Regan, M. Grätzel, Nature 353 (1991) 737.
- [5] A. Juris, V. Balzani, F. Barigelletti, S. Campagna, P. Belser, A. von Zelewsky, Coord. Chem. Rev. 84 (1988) 85.
- [6] A. Vogler, H. Kunkely, J. Am. Chem. Soc. 103 (1981) 1559.
- [7] S. D. Cummings, R. Eisenberg, J. Am. Chem. Soc. 118 (1996) 1949.
- [8] H. Yersin, W. Humbs, J. Strasser, in: H. Yersin (Ed.), Electronic and Vibronic Spectra of Transition Metal Complexes, Vol. II, volume 191 of Topics in Current Chemistry, Springer-Verlag, Berlin, 1997, p. 153.
- [9] J. Schmidt, J. Strasser, H. Yersin, Inorg. Chem. 36 (1997) 3957.
- [10] D. Donges, J. K. Nagle, H. Yersin, Inorg. Chem. 36 (1997) 3040.
- [11] H. Yersin, J. Strasser, J. Luminescence 72-74 (1997) 462.
- [12] H. Yersin, D. Braun, Coord. Chem. Rev. 111 (1991) 39.
- [13] D. Donges, J. K. Nagle, H. Yersin, J. Luminescence 72-74 (1997) 658.
- [14] J. Strasser, D. Donges, W. Humbs, M. V. Kulikova, K. P. Balashev, H. Yersin, J. Luminescence 76-77 (1998) 611.
- [15] L. G. Vanquickenborne, A. Ceulemans, Inorg. Chem. 20 (1981) 796.
- [16] H. Yersin, H. Otto, J. I. Zink, G. Gliemann, J. Am. Chem. Soc. 102 (1980) 951.
- [17] C. D. Cowman, H. B. Gray, Inorg. Chem. 15 (1976) 2823.
- [18] H. Yersin, G. Gliemann, Ann. N.Y. Acad. Sci. 313 (1978) 539.
- [19] G. Gliemann, H. Yersin, Struct. Bond. (Berlin) 62 (1985) 87.
- [20] R. Ballardini, G. Varani, M. T. Indelli, F. Scandola, Inorg. Chem. 25 (1986) 3858.
- [21] H. Wiedenhofer, S. Schützenmeier, A. von Zelewsky, H. Yersin, J. Phys. Chem. 99 (1995) 13385.
- [22] M. Maestri, V. Balzani, C. Deuschl-Cornioley, A. von Zelewsky, Adv. Photochem. 17 (1992) 1.
- [23] W. Humbs, H. Yersin, Inorg. Chim. Acta 265 (1997) 139.
- [24] M. Glasbeek, W. Humbs, H. Yersin, unpublished results.
- [25] H. Wiedenhofer, Ph.D. Thesis (in German), Universität Regensburg, Regensburg, Germany, 1994.
- [26] M. Eichenseer, Diploma Thesis (in German), Universität Regensburg, Regensburg, Germany, 1999.
- [27] D. Donges, Ph.D. Thesis (in German), Universität Regensburg, Regensburg, Germany, 1997.
- [28] H. Backert, H. Yersin, A. von Zelewsky, in: 13th International Symposium on Photochemistry and Photophysics of Coordination Compounds, Lipari, Italy, 1999, p. 90.
- [29] B. Henderson, G. F. Imbusch, Optical Spectroscopy of Inorganic Solids, Clarendon Press, Oxford, 1989.
- [30] A. Abragam, B. Bleaney, Electron Paramagnetic Resonance of Transition Ions, Clarendon Press, Oxford, 1970.
- [31] J. Strasser, H. H. H. Homeier, H. Yersin, Chem. Phys. (in preparation).
- [32] M. B. Walker, Can. J. Phys. 46 (1968) 1347.
- [33] J. Strasser, Ph.D. Thesis (in German), Universität Regensburg, Regensburg, Germany, 1999.