A Fiber Detector Radiation Hardness Test
Abstract
An intense 146 pion beam was stopped inside a scintillating fiber detector made out of 12 planes with 16 pixels each, where every pixel consists out of scintillating fibers of 500 m diameter dense packed. The detector was irradiated for 52 hours to more than 1 Mrad at its center. Before and directly after the irradiation the detector has been exposed to a particle beam to compare the corresponding light output. This study was continued during the following three months using cosmic rays. No damage was found taking into account the measurement errors of 5-10 . In contrast a 9 cm deep lucite degrader became irreversibly non-transparent in the irradiation region.
,
***corresponding author, phone: +49 33762
77346, Fax: +49 33762 77330,
e-mail: nahnhaue@ifh.de,
,
††thanks: at present student at Fachhochschule Wildau, Germany
††thanks: on leave from High Energy Physics Institute, Tbilisi State
University, Georgia
1 Introduction
During the last years there was a wide discussion about the use of different scintillator and fiber materials in high luminosity environments for tracking and calorimetric applications for new collider and fixed target experiments. Extensive radiation hardness studies for these materials have been carried out to investigate various quantities relevant for the problem. An introduction to the field is given in [1] whereas selected results of several groups are quoted in [2]-[15].
Due to the large number of relevant parameters, the published results do not give a clear and conclusive picture of the subject. This is true also for our own investigations which were connected with the development of a scintillating fiber detector as backup solution for the HERA-B inner tracker [16]. Irradiation of scintillating and clear fibers using a gamma source and charged particles (p,e) at low and high dose rates gave rather different results [11], [12]-[15]
First of all the material under study is important concerning the basic polymer and the different dyes used to shift scintillation light into the visible region of the spectrum. Decreases of light emission and transparency are observed under irradiation. It is well known that Polystyrene and PVT are much more radiation hard than PMMA and green shifting dyes give better results than blue ones. It seems, however, that the kind of production (e.g.polymerization time) can be important as well as temperature and atmospheric effects during transport, storage and machining [3, 10].
An increase of the total dose rate normally will increase the damage of the material under study. However, on an absolute scale results are different even for the same substances. Whereas damages are observed in some cases already at some 10 krad [9, 10] other studies show considerable effects only above 1 Mrad [11, 12]. In situ observations seem to indicate a change of the damage mechanism above this dose at least for specific materials [14].
Very often a recovery of the light emission and transparency has been reported after the irradiation. Recovery times of some days [4, 6, 14], several weeks [12] or even months [9] have been observed. However, for the same material total [12] and no recovery [11] is reported.
The presence of oxygen during and after the irradiation seems to be of particular importance for the damage and recovery of materials. Parameters related to this question are dose rate, surrounding atmosphere and coverage (glue). Published results are again inconsistent. In [2] it was measured that low dose rates in air produce larger damages than large ones. This was interpreted to be due to a better possibility for oxygen diffusion in the material during longer times. The same was observed in [15] for doses below 1 Mrad. At about that value however the same damage was found. Nearly no effect was seen for low rates in [13].
If oxygen diffusion is important one would expect an influence if air is kept off the material surfaces. No differences were observed for irradiation in air and nitrogen in [4, 13]. In contrast larger effects for irradiation in argon [10] and nitrogen [11] were stated. Non-glued fibers were found to be less damaged compared to glued ones [11] opposite to the measurements reported in [12, 13].
All the above results underline that one is far away from a consistent understanding of radiation damage mechanisms in scintillator and fiber materials. In addition to the large field of parameters, measurements are difficult to perform. General problems are dose determination for small probes, low light signals and mechanical damages of fragile objects during repeated measurements.
In order to estimate the radiation hardness of a detector of preselected material one should therefore irradiate a finite size prototype close to the later experimental conditions. For the SCSF-78M fibers selected to build a high rate tracking detector [11, 16] and a fast active target [17] we made such a test using 146 MeV/c pion beams at the Swiss Paul-Scherrer Institute (PSI).
2 Detector setup and readout
Most of the following activities were done in close cooperation with the FAST-collaboration [17]. In a common test run at PSI radiation hardness studies were performed as well as first proofs of ideas for the precise measurement of the muon lifetime using a fast active scintillating fiber target.
Two detectors - I and II - have been used for radiation hardness tests. Both were produced at DESY Zeuthen with the winding technology [16]. A drum grooved with a pitch of 510 m has been used to produce detector planes consisting of 8 fiber layers of KURARAY SCSF-78M double clad fibers of 500 m diameter dense packed. White acrylic paint has been taken to glue all fibers of a plane together over a length of about 10 cm. One plane has an effective width of 66 mm and a depth of 3.6 mm. Twelve of these planes were glued on top of each other to build the final detector.
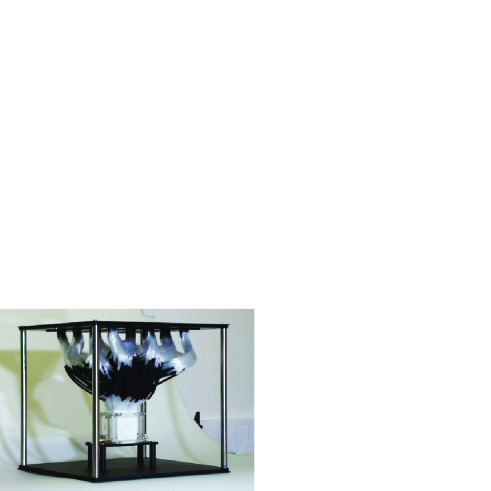
A photo of I is displayed in fig. 1. The bottom side of the detector was polished and mirrored by an aluminium foil. The other end consists of 30 cm loose fibers. 8 8 fibers of a plane were combined to form a macroscopic pixel. Using a plastic connector mask the 16 pixels of a plane were put to a 16 channel multianode photomultiplier Hamamatsu R5900-M16. The 192 pixels of the detector are readout in parallel using 12 such devices.
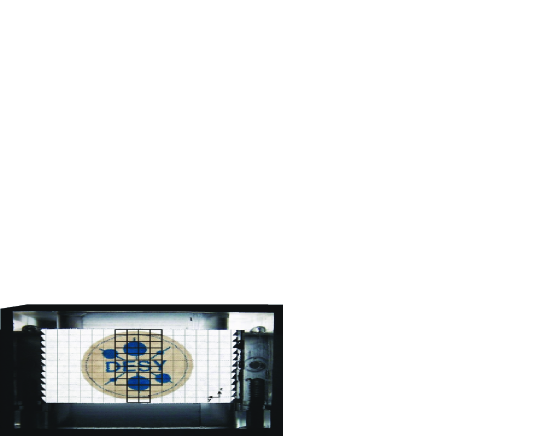
For II both ends of the glued fibers were cut and polished. This allows to look through the fibers and visually to inspect their quality. A corresponding photo is shown in fig. 2. The readout of the detector pixels of the same size as in I is done here by clear optical light guides. Using 500 m double clad KURARAY clear fibers exactly the same planes are produced as for scintillating fibers with the same winding drum. Polished at one end of the about 5 cm long glued part, the 30 cm long loose ends are again ordered to macro-pixels of fibers feed in masks fitting to the same multianode photomultipliers as mentioned above. Only four planes of this type were available and glued together to a compact block. Using pins and holes this block could be connected with moderate precision to all parts of the II scintillator block.
During the test run the FAST DAQ system has been used to study light signals from particles hitting I or II. The signals from the 192 photomultiplier channels were splitted passively. After a beam trigger the arrival time of all signals appearing in an interval of 20 were registrated by two VME-TDC’s CAEN V767. In addition 42 PM channels were connected to the channels of six VME ADC’s LECROY 1182 to measure signal amplitudes within a gate of 30 nsec after the beam trigger. The detector planes were arranged perpendicular to the incoming beam defining the z-direction. The pixels in a plane have increasing row numbers in y-direction. ADC-channels were connected to all planes of row numbers 8 and 9 and planes 4-12 in row numbers 7 and 10 (see also fig. 2).
At DESY Zeuthen II has been studied during three months after the test run using a cosmic ray trigger to activate a VME ADC CAEN V265 for registration of the PM-signal of particular pixels of the detector.
3 Measurements at PSI
The basic idea for the irradiation test was to stop an intense pion beam in the center of one of the detectors. Due to the strong increase of the pion ionization loss near to its stopping point it should be possible to irradiate different detector planes with different but correlated and calculable doses.
The concept has been tested in a low intensity positive charged particle beam of the area at PSI which is expected to contain mainly pions. The beam momentum was selected to be 146 MeV/c. The setup is shown schematically in fig 3a. Beam particles first cross a 8.5 cm thick lucite degrader (D) then a beam trigger system of three plastic scintillators (T1-T3) of 0.5 cm thickness each and hit finally the planes of the detectors I or II perpendicularly. Using I half a million triggers have been recorded for radiation hardness studies with a data rate of about 100 Hz.
As came out later 80 of all triggers were due to minimum ionizing particles (positrons) crossing all detector planes. These triggers were used to calibrate the 12 photomultipliers to give the same signals for any plane. The corresponding energy loss spectrum is shown in fig. 4a.
Pions entering the detector were already non-relativistic and gave rise to larger energy losses (fig. 4b) increasing to the stopping point (fig. 4c). Comparing the average values of the three distributions a ratio of 1.0/2.7/5.6 is found. As required, the pions stop dominantly in the center of the detector (see fig. 5).
3.1 Irradiation scheme
A high intense charged pion beam of the area of PSI has been used for a passive irradiation of the II scintillator block selecting the same momentum of 146 MeV/c as in . The corresponding arrangement is sketched in fig. 3b. The beam crosses a 9.0 cm thick lucite degrader (D). The beam profile is measured using a transparent wire chamber (C). The beam rate is monitored by two 0.5 cm thick scintillation counters (T1-T2). Finally particles enter the detector which was surrounded by a lead shield otherwise.
Because the scintillation counters could operate only up to moderate particle rates the PSI proton accelerator intensity was reduced for a short time by a factor 19.2 to measure the particle flux in our beam configuration. It was assumed that a linear scaling to the nominal accelerator intensity is possible also for the area. With that procedure we measured a particle flux of particles cm sec-1 in a 2 1 cm2 peak region of the beam profile, illuminating the six central channels (6 - 11) of the detector in about 5 cm height. Within a total irradiation time of 186000 sec ( 51h 40′) 1.67 1013 particles/cm2 hit that detector region in total.
To estimate the corresponding radiation dose per detector plane the particle content of the beam becomes important. With the available setup it could not be measured for the conditions in . In contrast to the situation in where the beam collimators were nearly closed, they were completely opened here what should decrease positron appearance.
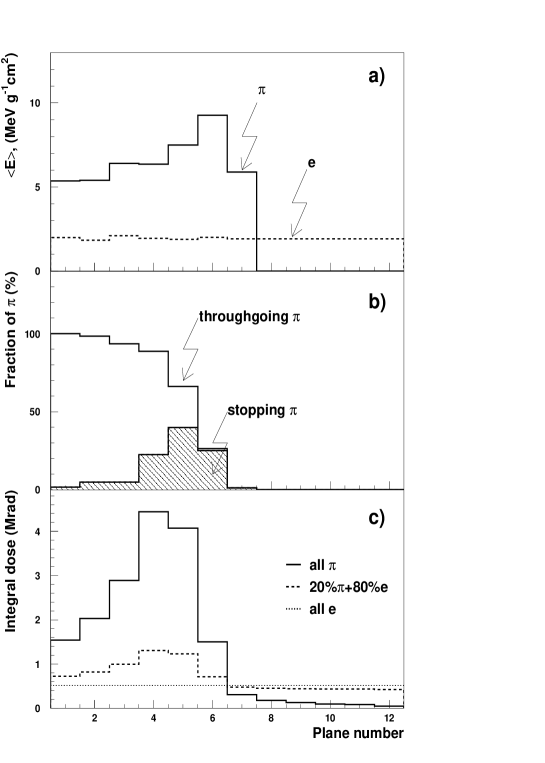
In fig. 6a the average energy loss in the detector planes as measured with in is distributed for pions and positrons. Fig. 6b shows the part of incoming pions crossing a detector plane or stopping there. Together with the total particle flux this numbers allow to estimate the integral irradiation dose per detector plane. To do that a GEANT-based Monte Carlo was used to simulate the experimental conditions and fit the pion stopping distributions in figs. 6b. The corresponding Monte Carlo result for the dose per plane is displayed in fig. 6c if the beam consists only of pions or positrons and for the particle mixture found for the measurement in M1. Planes 4 and 5 have been irradiated correspondingly with a dose beetween 1 - 4 Mrad.
3.2 Irradiation damage
When the irradiation was finished first a visual inspection of the degrader and the II detector was made.
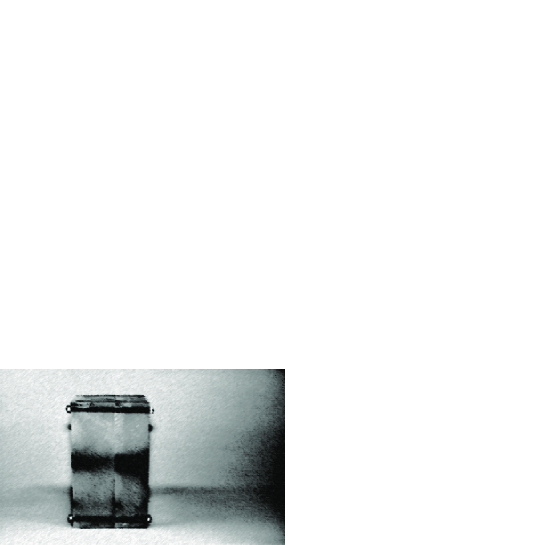
As visible in fig. 7 the degrader showed a clear damage in the region where the intense beam was crossing. The degrader is made out of two blocks pressed strongly together with screws. Both blocks arise from the same piece of lucite of 5 cm thickness. The second one was machined down to 4 cm a few hours before the irradiation started. During that procedure the block was warmed up considerably. This circumstance seems to be reflected in an interesting way in the damage profile. Beam particle hitting the blocks from left produce in the first one a brown zone which becomes smaller and weaker near to its end. At the entrance of the second block however a kind of phase transition seems to happen. Much stronger browning is observed. The widening of the profile is due to increasing multiple scattering of pions slowing down. The damage seems to be irreversible. After three months no change of the transparency has been observed.
In contrast to the strong effect for the degrader no visible change of the transparency of the II detector fibers was seen.
The detector has been studied in addition to I before and after irradiation in the particle beam. However only planes 2-5 were readout with the optical light guide planes described in section 2. In table 1 the ratio of the average values of the ADC-spectra for this planes measured with II and I is given. A light loss of about 20 is observed for the clear light guides due to connector coupling losses because no fiber-by-fiber coupling is possible.
The ratio of the average values of ADC-spectra measured with II after and before the irradiation is also shown in the table. It comes out to be near to unity, demonstrating that no clear radiation damage is appearing for the considered detector region. One would, however, like to prove whether the shape of the corresponding spectra remains unchanged too. That is shown in fig. 8, where the ratio of the two sum spectra is distributed for the region of reasonable statistics of the data. All values are consistent with one within their errors, giving an average which allows a decrease of the observed light signal of less than 10 due to irradiation.
4 Laboratory measurements with cosmic rays
To check the long term behavior of the irradiated II detector for all its twelve planes, the detector was studied using a cosmic ray particle trigger in the DESY Zeuthen laboratory during three months. The detector planes were placed perpendicular to the zenith axis in a black box. On top of the first plane a scintillation counter allowed to measure at different positions along the fibers. The complete trigger was made by a threefold coincidence of this counter and signals from two planes directly before and/or after the measured one. For every plane pixel 9 was selected for trigger and measurement. To study any plane of II, the light guide block step by step was moved across the planes. Repeated measurements of the same pixel were done therefore often with different photomultipliers. For this purpose the PM’s were calibrated using a constant LED light signal.
In fig. 9 the results of all measurements are distributed versus the plane number and a rough order in time. In contrast to the impression from the first measurement no dependence on the plane number is observed. As can be seen from fig. 10 all data points follow a gaussian distribution.
Due to lack of time, only a single measurement has been done before irradiation in plane 11. It fits to the gaussian behavior of all data.
In fig. 11 the average values of the measurements per plane are shown together with a total average and its one and three sigma region. The single data point from before irradiation agrees with that average in 1.4 .
5 Summary
A low energy high rate beam of positive pions has been stopped in the center of a fiber detector made out of 12 planes with 16 pixels each. The fibers are glued together with white acrylic paint. Every pixel consists of KURARAY SCSF-78M fibers of 500 m diameter.
Within about 52 hours a total dose of 1 - 4 Mrad has been placed in the detector center with a rate of 20 - 80 krad/h. The large error of this number is due to a unknown positron contribution to the beam.
Unexpectedly, all measurements are consistent with no radiation damage of any fiber detector plane. However, a large and irreversible damage (browning) reflecting the profile of the crossing beam is observed for the lucite degrader placed in front of the detector. Within the measurement errors we can not exclude a maximum decrease of 10 of the light signals of detector fibers after irradiation. If present, no recovery has been observed during three months.
Acknowledgement
First of all we would like to thank the FAST collaboration members from BNL, Bologna, CERN, PSI and ETH Zurich who heavily supported the radiation hardness measurements. Secondly the whole program would not have been possible without tremendous help provided by the Paul Scherrer Institute. In particular we thank C. Petitjean, K. Deiters, and J. Egger for support in the installation of the necessary hardware and the accelerator crew for providing the required intensities for monitoring and exposure.
References
- [1] Zorn C., Nucl. Phys. B (Proc.Suppl.) 32, 377 (1993)
- [2] Zorn C. et al., Nucl. Phys. B (Proc.Suppl.) 32, 369 (1993)
- [3] Ilie S. et al., Nucl. Phys. B (Proc.Suppl.) 32, 384 (1993)
- [4] Margulies S. et al.,Proceedings of SCIFI93, World Scientific,(1993), editors A.D.Bross, R.C. Ruchti, M.R. Wayne, p. 421
- [5] Jahan M.S. et al.,,Proceedings of SCIFI93, World Scientific, (1993), editors A.D.Bross, R.C. Ruchti, M.R. Wayne, p. 441
- [6] Tome B. et al., Proceedings of SCIFI93, World Scientific, (1993), editors A.D.Bross, R.C. Ruchti, M.R. Wayne, p. 450
- [7] Hagopian V. and Daly I. Proceedings of SCIFI97, AIP Conference Proceedings 450, Woodbury, New York, (1997), editors A.D.Bross, R.C. Ruchti, M.R. Wayne, p. 53
- [8] David M. et al., Proceedings of SCIFI97, AIP Conference Proceedings 450, Woodbury, New York, (1997), editors A.D.Bross, R.C. Ruchti, M.R. Wayne, p. 62
- [9] Hara K. et al., NIM A411 (1998) 31
- [10] Busjan W., Thesis, DESY F35D-97-09 (1997)
- [11] Dreis, B., et al., preprint DESY 98-049 (1998)
- [12] Aschenauer, E.C., et al., preprint DESY 97-174 (1997)
- [13] Aschenauer E. C. et al., preprint DESY 99-078 (1999)
- [14] Klose H. et al., NIM B135, (1998) 555
- [15] Hamada M. M. et al., NIM A422,(1999) 148
- [16] Aschenauer E.C. et al., NIM A424,(1999) 459
- [17] Navarria F. et al., ETHZ-IPP PR-98-04 (1998)
Table 1
| Plane | |||
|---|---|---|---|
| 2 | 0.81 | 1.04 | 0.98 0.05 |
| 3 | 0.75 | 0.94 | 0.93 0.05 |
| 4 | 0.78 | 1.07 | 0.96 0.03 |
| 5 | 0.85 | 1.07 | 0.94 0.03 |
| sum | 0.81 | 1.04 | 0.94 0.02 |
For the detector planes 2-5 and their sum three ratios of ADC spectra are given: -the ratio of average values of spectra measured for II and I, - - the ratio of average values of the spectra measured for II after and before irradiation - and - the average value of the ratio of ADC-channel contents measured after and before irradiation.
Figure captions
| Fig. 1 : | Photo of the installation of the I detector within a black box. The loose ends of the scintillating fibers are coupled via plastic masks to photomultipliers which could be installed on top of the box. |
|---|---|
| Fig. 2 : | Photo of a DESY-logo through the 10 cm long fibers of the II detector. The fiber planes and pixels in z and y-direction are indicated as well as the region in the center where pulse height measurements were possible |
| Fig. 3 : | Sketch of the beam setups for a.) quantitative studies of the performance of I and II, b.) irradiation, D : degrader, T1-T3: trigger counter, C: wire chamber. |
| Fig. 4 : | Energy loss distributions for a.) positrons crossing I, b.) pions in the first plane, c.) pions in the stopping point. |
| Fig. 5 : | Distribution of pion stoppings per detector plane of I. |
| Fig. 6 : | a.) average energy loss as measured for pions and positrons per plane of I, b.) corresponding fraction of crossing and stopping pions, c.) results of a GEANT based Monte Carlo calculation of the radiation dose placed per plane for different assumptions about the particle content of the incoming beam. |
| Fig. 7 : | Photo of the side view of the degrader after irradiation with clearly visible damage in the irradiation region. The beam particles are entering from the left. |
| Fig. 8 : | Ratio of the sum of ADC-spectra for planes 2-5 of II after and before irradiation. |
| Fig. 9 : | Mean ADC-values as measured for cosmic ray particle crossing a pixel of a certain plane of II |
| Fig. 10 : | Number distribution of measurements displayed in fig. 9 versus the measured variable. |
| Fig. 11 : | Average of mean ADC-values for cosmic ray particle crossings per plane of II. |