Optical response of small silver clusters
Abstract
The time-dependent local density approximation is applied to the optical response of the silver clusters, Ag2, Ag3, Ag8 and Ag. The calculation includes all the electrons beyond the closed-shell Ag+11 ionic core, thus including for the first time explicitly the filled -shell in the response. The excitation energy of the strong surface plasmon near 4 eV agrees well with experiment. The theoretical transition strength is quenched by a factor of 4 with respect to the pure -electron sum rule in Ag8 due to the -electrons. A comparable amount of strength lies in complex states below 6 eV excitation. The total below 6 eV, about 50% of the sum rule, is consistent with published experiments.
I Introduction
The optical response of clusters of IB elements has been an interesting theoretical challenge: while their chemistry is dominated by the atom’s single valence -electron, the electrical properties are strongly influenced by the nearby filled -shell. Up to now, the -electrons have been treated only implicitly by a dielectric approximation[1]. For example, one of the interesting phenomena that has been attributed to the -electrons is the blue shift of the surface plasmon for small clusters[2, 3, 4]. The -electrons also strongly screen the oscillator strength of the valence electrons, and this raises the question of whether the theory is consistent with the measured oscillator strength, which are only somewhat below the full sum for the -electrons[5, 6, 7].
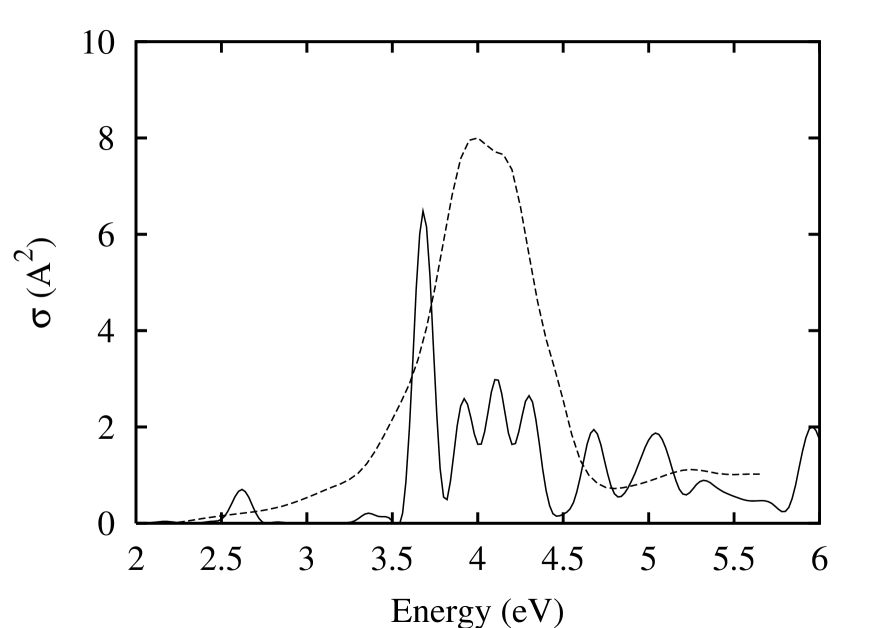
In this work, we calculate the optical response explicitly including the -electrons, using the time-dependent local density approximation (TDLDA). We begin by recalling the limiting behavior in some simple extreme models. The first is the free-electron model including only the -electrons, as in the jellium theory. This produces a collective mode with all of the oscillator strength at a frequency related to the number density by . At the bulk density of silver, this gives an excitation energy of 5.2 eV. The second limiting case is the Mie theory, treating the cluster as a classical dielectric sphere. The Mie theory in the long wavelength limit gives the optical absorption cross section as [10]
| (1) |
where is the radius of the sphere and is the dielectric function. In Fig. 1 we show the result expressed as the cross section per atom, taking from ref. [11]. The graph also shows the integrated oscillator strength per atom, . We see that there is a sharp peak at 3.5-3.6 eV, but that the oscillator strength is only 1/6 of the sum rule for -electrons. Thus the effect of the screening is to push the -electron surface plasmon down from 5.2 to 3.5 eV, together with a strong quenching of the oscillator strength.
II The TDLDA method
The details of our implementation of the TDLDA are given in ref. [12, 13]. The calculation is performed in real time, which has the advantage that the entire response is calculated at once, and only a Fourier transformation is needed to extract strengths of individual excitations. The Hamiltonian we employ is one that has been frequently used in static calculations. The electron-electron interaction is treated in the local density approximation following the prescription of ref. [14]. The ionic potential is treated in the pseudopotential approximation keeping only the - and -electrons active. The -dependent pseudopotentials were constructed according to the method of Troullier and Martins [15]. We showed in ref.[16] that for the atom the resulting pseudopotential is adequate to describe the electromagnetic response well into the continuum, even though the sum rules become ambiguous[16]. We make one further approximation in the Hamiltonian, treating the nonlocality in the pseudopotential by the method of Kleinman and Bylander[17]. The approximation takes one angular momentum state as given by the radial pseudopotential and corrects the others by adding a separable function. A potential problem of this method is that there may be spurious deeply bound states in some of the partial waves[18]. We take the local wave to be the -wave, which avoids the difficulty.
The critical numerical parameters in the implementation of the TDLDA on a coordinate-space mesh is the mesh spacing , the shape and size of the volume in which the electron wave functions are calculated, and the step size of the time integration. We use a mesh size = 0.25 Å, which is justified in the next section that examines atomic properties. For the volume geometry we take a sphere of radius 6 Å. From experience with the jellium model, the collective resonance frequency of Ag8 should be accurate to 0.1 eV with this box size, and the smaller clusters will be described even more accurately. The last numerical parameter must be small compared to the inverse energy scale of the Hamiltonian, which in turn is controlled by in our method. We find that the integration is stable and accurate taking eV-1. The equations are integrated to a total time of . The inverse of this time corresponds to the energy resolution of the theoretical spectrum.
III Atomic properties
Before presenting the results on silver clusters, we examine the accuracy of our three-dimensional coordinate-space numerical method for atomic properties. We have considered the TDLDA treatment of IB atoms in an earlier publication[16]. There we used a spherical basis and the emphasis was on the validity of the pseudopotential approximation for calculating the response and its sum rule. Here we use those results to test the implementation of the Kohn-Sham equations on a three-dimensional mesh, which of course is much more inefficient than the spherical representation for atomic systems. Comparison of the two methods is given in Table I. We find, with a mesh of 0.25 Å, that orbital energies are reproduced to an accuracy of about 0.1 eV. The ground state configuration of the Ag atom is with Kohn-Sham orbital energies of the -, -, and -orbitals having values -7.8, -4.6 and -0.7 eV, respectively. In the 3-d mesh, the lack of spherical symmetry also splits the -orbitals by about 0.1 eV. The intrinsic limitations of the TDLDA on physical quantities are certainly beyond the 0.1 eV accuracy level, so we judged the 0.25 Å mesh adequate for our purposes. We also show in the table some physical quantities of interest: the ionization potential, the energy of the lowest excited state, and its oscillator strength. Although it is tempting to interpret the Kohn-Sham eigenvalues as orbital energies, it is well known that the ionization potential is not well reproduced by the highest electron’s eigenvalue. In our case here, the negative of the -orbital energy, 4.6 eV, is quite far from the empirical 7.5 eV ionization potential. However, the LDA does much better when the total energies of the Ag atom and the Ag+ ion are compared. We quote this number as ‘I.P.’ in the table. The next quantity we examine is the excitation energy of the lowest excited state. The state has a predominant character; the difference in orbital energies is quoted as ’ in the table. The physical excitation energy including interaction effects is shown on the line . The theoretical values are obtained from the peak position in the Fourier transform of the TDLDA response. We see that three-dimensional mesh agrees to 0.1 eV with the spherical basis calculation on these energies. However, the experimental excitation energy is lower than theory by about 10%; this number sets the scale of the intrinsic limitations of the TDLDA. In the last line, we display the oscillator strength associated with the transition between the ground and excited state. Here there is some disagreement between the spherical results and the three-dimensional results. This might be due to the different treatment of the pseudopotential in the two cases. The three-dimensional treatment used the Kleinman-Bylander method to treat the nonlocality of the pseudopotential, while in the spherical basis, the -dependent nonlocality is treated exactly. In any case, the three-dimensional result is within 10% of the empirical value. We also include in the table the energies associated with the excitation of a -electron to the -orbital.
IV Silver dimer and trimer
We next examine the Ag2 dimer. We take the nuclear separation distance at 2.612 Å from the calculations of ref. [19]. The response averaged over directions is shown in Fig. 2. The transition is split into two modes, a longitudinal mode at 3.2 eV and a transverse mode at 4.9 eV. Experimentally, the dimer has only been studied in matrices which are subject to environmental shifts of the order of tenths of an electron volt. Absorption peaks have been identified at 3.0 eV and 4.7 eV which very likely correspond to the two modes found theoretically. In emission, these states are shifted somewhat lower, to 2.8 and 4.5 eV. These numbers are probably a better measure of the free cluster energies, judging by the behavior of silver atoms in a matrix. The lower state is strongly coupled to vibrations in the data of ref. [20], supporting the interpretation of the mode as a longitudinal excitation. In summary, the TDLDA reproduces the splitting of the longitudinal and transverse modes quite accurately, but the average frequency of the mode is probably too high by the same amount that we found for the atom. We conclude that the interaction physics between the two atoms is reasonably described by the TDLDA.
The picture of two nearly independent states on the two atoms is qualitatively valid also in considering the oscillator strengths of the transitions. The theoretical ratio of strengths for the two states is very close to 2:1, which is expected for the two transverse modes compared to the single longitudinal mode. However, the total strength of the sharp states, 1.05 electrons, is only 80% of the theoretical strength for separated atoms. Thus a significant fraction of strength goes to a higher spectral region. We shall see that much of the shift is to the region 5 eV to 6 eV, where experimental data is still available.
The silver trimer is predicted to have a shape of an isosceles triangle with nearly equal sides. There are two nearly degenerate geometries (corresponding to the E symmetry of the equilateral triangle) with the 2B state in an obtuse triangle predicted to be lowest in most calculations. Our calculation uses the obtuse geometry (geometry I) of ref. [19]. The absorption spectrum of Ag3 is shown in Fig. 3. We see that the absorption in the 3-5 eV region is spread out among several states. The more complex spectrum may be due to the low ionization potential of Ag3. According to the Kohn-Sham eigenvalue, the binding of the highest occupied orbital is 3.5 eV, permitting Rydberg states in this region. There is a quantum chemistry calculation of the spectral properties of Ag3 excitations in the visible region of the spectrum[8]. This calculation predicted an integrated strength below 3.5 eV of , neglecting the screening of the -electrons. In comparison we find for the same integration limit , a factor of 6 smaller.
V Ag8 and Ag
We shall now see that collective features of the response become prominent going to 8-electron clusters. In the alkali metals, clusters with 8 valence electrons have a sharp collective resonance associated with a nearly spherical cluster shape and filled shells of the delocalized orbitals. These systems have been modeled with the spherical jellium approximation, and the gross features of the collective resonance are reproduced. The IB metals are quite different from the IA alkali metals, however, in that the occupied -orbitals are close to the Fermi surface and strongly screen the -electrons. On the experimental side, the studies of Ag8 [7] and Ag [2] seem to show that the oscillator strength of the -electrons is not seriously quenched by the -polarizability. An important motivation of our study then is to see whether the simple arguments made for a strong -screening are in fact borne out by the theory treating the -electrons on an equal footing.
There are two competing geometries in eight-atom clusters of -electron elements, having Td and D2d symmetry. We have calculated the response of both geometries, taking the bond lengths from ref.[19]. The optical absorption strength function is shown in Fig. 4. Also shown with arrows are the two experimental absorption peaks seen in ref. [7]. The peak locations agree very well with the theoretical spectrum based on the Td geometry. But one should remember that the matrix spectrum is likely to be shifted by a few tenths of an eV with respect to the free cluster spectrum. The experimental absorption strength is considerably higher for the upper of the two peaks in the 3-4 eV region, which also agrees with theory. The D2d geometry has a smaller splitting between the two peaks and does not agree as well with the data. The theory thus favors the Td geometry for the ground state. This is not the predicted ground state in ref. [19], but since the calculated energy difference between geometries is only 0.08 eV, the theoretical ordering is uncertain. For the Ag cluster, we used the geometry (I) of ref. [19], the predicted ground state of the cluster in their most detailed calculation. The comparison between theory and experiment [2] is shown in Fig. 6. The peak at 4 eV is reproduced in position; its theoretical width is somewhat broadened due to the lower geometric symmetry of the 9-atom cluster.
We next turn to the integrated absorption strength. The strength function is shown in Fig. 5 for Ag8 in the Td and D2d geometries; the results for Ag are shown in Fig. 7. The sharp modes below 5 eV are predicted to have only 25% of the -electron sum rule. This is slightly higher than the Mie theory prediction, which perhaps can be attributed to the imperfect screening in a small cluster. The same physics is responsible for the blue shift of the excitation in small clusters. Although the sharp states are strongly screened, the integrated strength below 6 eV is 3.9 electrons, about 50% of the -electron sum. The integrated strength data is compared with theory in Fig. 8, showing all the trend with increasing cluster size. The integrated strength per -electron has moderate decrease with increasing cluster size; no trend is discernible in the experimental data. Beyond N=1, the experimentally measured strength is substantially larger than theory predicts. The data of ref. [2] is about a factor of two larger than theory, as may also be seen in Fig. 7. However, it is difficult to assess the errors in that measurement, and the data of ref. [7] is not seriously out of disagreement in view of their assigned error bars. From a theoretically point of view, it is difficult to avoid the -electron screening and the resulting strong reduction of the strength. We present in the next section a semianalytic argument on this point.
VI Interpretation
In this section we will analyze the -electron contribution to the TDLDA response from an atomic point of view. In the TDLDA, the bound electrons can be treated separately because they only interact through the common mean field. In particular, there are no Pauli exclusions corrections when combining and transition strength. To describe the response from an atomic point of view, it is convenient to express it in terms of the dynamic polarizability . We remind the reader that it is related to the strength function by
| (2) |
The data in Table I may be used to estimate the polarizability function, but this would not include higher energy contributions and the continuum transitions. Instead, we recomputed the atomic silver response freezing the -electron. That procedure yielded a polarizability function with values Å3 and Å3. We then fit this to a convenient single-state resonance form,
| (3) |
with fit parameters and eV, from which we can analytically calculate the effects on the -electron response. Except for minor interaction terms the TDLDA response is equivalent to the RPA, which we apply using the response formalism as in App. A of ref. [22]. Note that the dipole response function is related to the polarizability by . Alternatively, the same physics can be derived using the dielectric functions, as was done in ref. [1, 3, 4]. The formulations are equivalent provided the dielectric function and the polarizability satisfy the Clausius-Mossotti relation. In the dipole response formalism, it is convenient to represent the uncoupled response function as a matrix, separating the free-electron and the polarizability contributions. The RPA response function is written as
| (4) |
where and are the following matrices:
| (5) |
| (6) |
Here is the number of atoms in the cluster, and is the radius of the cluster. The form for is obvious, with the free electron response given by . The is more subtle. The Coulomb interaction, represented by the long-range dipole-dipole coupling [23], acts among the free electrons and between the free electrons and the polarization charge, but not within the polarization charges— separated dipoles have zero interaction after averaging over angular orientations. The algebra in eq. (4) is easily carried out to give
| (7) |
where and is the free-electron resonance frequency defined in the introduction. The pole position of the response gives the frequency with the polarization,
| (8) |
Taking and from the atomic calculation, we find the resonance shifted from 5.18 to 3.6 eV, i.e. exactly the value for the empirical Mie theory. . The strength is calculated from the energy times the residue of the pole which yields
| (9) |
Numerically, eq. (9) gives a factor of 4 reduction in the strength, consistent with the full TDLDA calculation for Ag8 with the valence space. We thus conclude that the -polarization effects can be quite simply understood in atomic terms.
VII Acknowledgment
We acknowledge very helpful discussions with P.G. Reinhard, particularly in formulating Sect. 4. This work is supported in part by the Department of Energy under Grant DE-FG-06-90ER40561, and by the Grant-in-Aid for Scientific Research from the Ministry of Education, Science and Culture (Japan), No. 09740236. Numerical calculations were performed on the FACOM VPP-500 supercomputer in the institute for Solid State Physics, University of Tokyo, and on the NEC sx4 supercomputer in the research center for nuclear physics (RCNP), Osaka University.
REFERENCES
- [1] A. Liebsch, Phys. Rev. Lett. 71 145 (1993).
- [2] J. Tiggesbaeumker, et al., Phys. Rev. A48 R1749 (1993).
- [3] V. Kresin, Phys. Rev. B51 1844 (1995).
- [4] L. Serra and A. Rubio, Phys. Rev. Lett. 78 1428 (1997).
- [5] W. Harbich, et al., Chem. Phys. Lett. 195 613 (1992).
- [6] J. Tiggesbaeumker, et al., Chem. Phys. Lett. 190 42 (1992).
- [7] S. Fedrigo, W. Harbich and J. Buttet, Phys. Rev. B47 10706 (1993).
- [8] S. Walch, J. Chem. Phys. 87 6776 (1987).
- [9] S. Fedrigo, et al., J. Chem. Phys. 99 5712 (1993).
- [10] C. Bohren and D. Huffman, Absorption and scattering of light by small particles, (Wiley 1983).
- [11] Handbook of Chemistry and Physics, 77th Ed., (CRC Press, Boca Raton, 1996), p. 12-143.
- [12] K. Yabana and G.F. Bertsch, Phys. Rev. B54 4484 (1996).
- [13] K. Yabana and G.F. Bertsch, Z. Phys. D42 219 (1997).
- [14] J. Perdew and A. Zunger, Phys. Rev. B23 5048 (1981).
- [15] N. Troullier, J.L. Martins, Phys. Rev. B43 1993 (1991).
- [16] K. Yabana and G.F. Bertsch, Phys. Rev. A58 2604 (1998).
- [17] L. Kleinman and D. Bylander, Phys. Rev. Lett. 1425 (1982).
- [18] X. Gonze, P. Kackell, and M. Schettler, Phys. Rev. B41 12264 (1990).
- [19] V. Bonacic-Koutecky, et al., J. Chem. Phys. 98 7981 (1993)
- [20] W. Schrittenlacher, et al., Surface Science 156 777 (1985).
- [21] N.P. Penkin and I. Yu. Slavenas, Opt. Spektrosk. 15 9 (1963).
- [22] K. Yabana and G.F. Bertsch, Z. Phys. D32 329 (1995).
- [23] G.F. Bertsch and R.A. Broglia, Oscillations in Finite Quantum Systems, (Cambridge Univ. Press, 1994).
| spherical basis | lattice | experimental | ||
| I.P. (eV) | 8.0 | 8.0 eV | 7.75 eV | |
| (eV) | 3.9 eV | 3.9 eV | ||
| (eV) | 4.07 eV | 4.13 eV | 3.74 eV | |
| 0.53 | 0.66 | 0.7 | ||
| (eV) | 7.2 eV | 7.1 eV | ||
| (eV) | 7.6 eV | 7.7 eV | 8.2 eV |