Energy calibration of the NaI(Tl) calorimeter of the SND detector using events
Abstract
Calibration of the three layer NaI(Tl) spherical calorimeter of the SND detector using electron – positron scattering events is described. Energy resolution of for 500 MeV photons was achieved.
1 Introduction
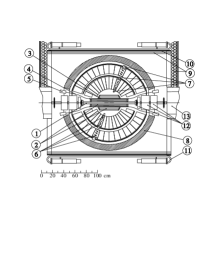
The SND is a general purpose nonmagnetic detector ( Fig. 1 ) operating at VEPP-2M collider in BINP ( Novosibirsk ) in the center of mass energy range of GeV. [1, 2]. Experimental studies include decays of mesons and nonresonance hadron production at low energies. Good energy resolution for photons in a wide energy range from to MeV is essential for suppression of background in reconstruction of intermediate and mesons and detection of photons emitted in radiative transitions between different quarkonium states. Fast preliminary calibration of the calorimeter is based on cosmic muons [3]. It provides reasonable energy resolution of for 500 MeV photons, but to increase resolution to its highest value it is necessary to use experimental events with precisely known energies of final particles. In addition, such a process should have clear event topology, be well separated from background, and have large cross section. Potentially suitable processes are , but given the VEPP-2M luminosity of at 1 GeV, only produces enough statistics for calibration of the calorimeter in a reasonably short time.
2 The SND calorimeter
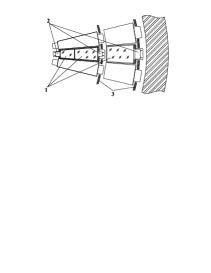
SND detector [1] ( Fig. 1) consists of a cylindrical drift chamber, calorimeter, and muon system. The three-layer NaI(Tl) spherical calorimeter, consisting of 1632 individual counters ( Fig. 2) is a main part of the detector. It was described in [3], so let us mention only some details necessary for description of the calibration procedure.
Calorimeter solid angle coverage in a spherical coordinate system with axis directed along the electron beam is and . Calorimeter is logically divided into two parts: “small” angles and , and “large” angles: . The angular dimensions of crystals at “large” angles are and at “small” angles. The calorimeter layers are enumerated starting from the interaction point – the first one is the nearest to the beam.
The calorimeter energy resolutions for 500 MeV electrons, photons, and muons after primary calibration using cosmic muons are shown in the Table 1. While peak positions in Monte Carlo simulation and experiment agree at a level, experimental resolutions are significantly worse than simulated ones. The possible explanations of the differences in simulated and experimental spectra could be attributed to instability of the detector electronics, systematic errors in the cosmic calibration procedure, and inadequate treatment of nonuniformity of light collection efficiency over the crystal volume in Monte Carlo simulation.
Relative stability of calibration constants in time [3], shows that electronics and photodetectors instabilities do not contribute much into experimental resolutions. To eliminate systematic biases of cosmic calibration procedure, the OFF-LINE calibration based on events was performed.
3 The calibration method.
The calibration constants based on scattering events could be obtained by minimization of the expression:
| (1) |
where – event number, – crystal number, is an energy deposition in th crystal and th event, – beam energy, – calibration constant for th crystal. Similar calibration procedure was implemented in CLEO II detector [4], but layered structure of the SND calorimeter complicates the task due to large fluctuations of energy depositions in the calorimeter layers and energy dependence of longitudinal development of electromagnetic shower. Although r.m.s. of the energy deposition spectra in an individual crystals are about , the statistical accuracy of must be high, due to strong correlations between energy depositions in different crystals in an event. The drawbacks of such a direct method are that the calibration constants are dependent on the energy of the electrons and produce biased values of average energy depositions in calorimeter layers.
To avoid such complications the SND calorimeter calibration is based on comparison of coefficients and , obtained using simulated and experimental electrons of the same energy.
After cosmic calibration the measured energy deposition in th crystal can be written as , where is an actual energy deposition and difference of from unity, characterizes the systematic shift of cosmic calibration for th crystal. To compensate for this shift it is necessary to find corresponding correction coefficient . These calibration constants are obtained in the following way. First, the functions:
| (2) |
are minimized over and . Here is a crystal number, – event number – energy depositions in crystals in Monte Carlo simulation, – measured energy depositions in experimental events, – beam energy ( the same in experimental and simulated events ). The minimums of the functions are determined by the following conditions:
| (3) |
Coefficients and are the solutions of the set of simultaneous linear equations of the form , where is an matrix and its elements are or , and are vectors of a dimension with elements or and or . Here is a total number of crystals in calorimeter, indices and - crystals numbers, - the event number. The solutions of the two linear systems satisfy the following condition , hence .
The calibration constants obtained this way have high statistical accuracy, are independent of the energy of electrons, and do not produce biases in energy depositions in calorimeter layers.
For calorimeter calibration events were simulated. In order to save simulation time, angular distribution was set to uniform over the solid angle. The passage of electrons through the detector was simulated by means of the UNIMOD2 code [5].
Both experimental and simulated events are selected according to the same criteria: only two particles must be detected, the total energy deposition in the calorimeter is greater than and acollinearity angle is less than 10 degrees. All crystals with energy depositions less than 5 MeV are discarded. Remaining crystals are put into calculation of the elements of matrix and vector . When events processing is finished, the linear system is solved using SLAP2 [6] package, i.e. and are obtained for all crystals and then are calculated.
4 Events processing results.
This calibration procedure was used in the OFF-LINE processing of the data collected in in the center of mass energy range GeV [1].
To obtain , 50000 simulated events with 500 MeV electrons were processed, corresponding to about 150 electrons per crystal. The mean and their r.m.s. values are listed in the Table 2. In principle, the coefficients may depend on the electron energy, layer number, and crystal size. But at this level of statistics no significant difference in values for different crystal sizes in the “large” angle part is seen. The statistical accuracy of can be estimated as ( Table 2 ).
To obtain constants, events corresponding to integrated luminosity about are needed. Such sample contains about 240000 electrons in the “large” angles part, corresponding to at least 150 electrons per crystal. On average, the SND acquires such an integrated luminosity in three days of VEPP-2M operation. The mean , their r.m.s. values and statistical accuracy of () are listed in the Table 2 together with the mean , their r.m.s. values and statistical errors .
The statistical accuracy of calibration constants for the first two layers is satisfactory, but for the third layer it is larger than that for cosmic calibration [3]. This is due to relatively small energy deposition of electromagnetic showers in the third layer, combined with large number of hit crystals. Thus the influence of the accuracy of calibration constants in the third layer on an overall calorimeter resolution for electrons and photons is small. The situation is different for muons and charged pions, where relative energy deposition in crystals of the third layer is large. In this case high statistical error in calibration coefficients significantly increases the widths of energy deposition spectra. So, instead of , the coefficients obtained during cosmic calibration were used for the third layer.
The r.m.s. difference in calibration coefficients obtained using cosmic and calibration procedures can be estimated as . This value is about for the first two layers and is less than for the third layer.
5 Energy resolution of the calorimeter. Implementation of the calibration procedure
As a result of calibration the calorimeter energy resolutions for 500 MeV electrons and photons ( Table 1, Fig.3 ) were improved by , but still remain worse than those expected from Monte Carlo simulation.
A Monte Carlo simulation of energy deposition was first carried out with a uniform description of the nonuniformity of the light collection efficiency over the crystal volume. Then, calculations taking into account nonuniform “direct” light from a scintillation and diffuse reflection from the crystal boundaries and wrapping were performed. The energy deposition in crystal measured in experiment is
| (4) |
where is an energy deposition in the scintillation counter, – ratio between the collected electric charge from photodetector, measured in pC, and energy deposition in the units of MeV, - quantum efficiency of the photodetector multiplied by its gain, - light yield of the scintillator, - light collection efficiency, e - electron charge. In general, is a function of coordinates within the crystal and depends on reflection coefficient on the crystal boundaries and photocathode diameter.
To take into account the nonuniformity of light collection efficiency, the crystal response was simulated taking into account a uniform light collection due to diffuse reflection and nonuniform “direct” light collection, depending on a solid angle of a photocathode, visible from a scintillation point. The results of such simulation the energy distribution width for 500 MeV photons is ( Fig. 4 ). The experimental spectrum is shown in the same figure. Calorimeter resolutions for other types of particles are also shown in Table 1. The agreement between experiment and simulation became much better and the residual disagreement could be attributed to difference in diffuse reflection coefficients values in different crystals.
To study the calorimeter response for photons as a function of photon energy, the events and were used. The kinematic fit of the events was performed taking into account energy–momentum conservation and the reconstructed photon energies were obtained. These values were compared with direct calorimeter measurements. One could expect strong correlation between these values, but study of the simulated events, where the energy of the photon is precisely known, showed, that even for photons in the energy range from 30 up to 150 MeV these correlation do not change significantly the calorimeter response. The energy range above 170 MeV was also studied using annihilation events and results agree well with those for reaction. The dependence of calorimeter energy resolution on photon energies ( Fig. 5 ) was fitted as
| (5) |
After calorimeter calibration with events, the photon energies turned out to be biased by about ( Table. 1, Fig. 4 ). In oder to compensate this bias, the calibration coefficients for photons were corrected accordingly. The distributions over two-photon invariant masses in and decays after such correction are shown at Fig. 6 and 7. Peaks at and mesons masses are clearly seen.
Relative drift of calibration coefficients is shown in Fig.8. It can be seen, that for a time period between consecutive calibrations, the mean shift of the coefficients is about and r.m.s. of their random spread is about for the first two layers and about for the third layer.
6 Conclusion
Using the described procedure for the SND calorimeter calibration the statistical accuracy of in calibration constants for the first two layers was achieved. The final resolution for photons varies from at 50 MeV to at 500 MeV.
References
- [1] M.N.Achasov, et al., First physical results of SND detector at VEPP-2M, Novosibirsk, Budker INP 96-47, 1996.
- [2] V.M.Aulchenko et al., The 6th International Conference on Hadron Spectroscopy, Manchester, UK, 10th-14th July 1995, p.295.
- [3] M.N.Achasov, et al., Nucl. Instr. and Meth. A401(1997), p.179
- [4] Y.Kubota et al., Nucl. Instr. and Meth. A320(1992), p.66.
- [5] A.D.Bukin, et al., in Proceedings of Workshop on Detector and Event Simulation in High Energy Physics, The Netherlands, Amsterdam, 8-12 April 1991, NIKHEF, p.79.
- [6] Mark K. Seager, A SLAP for Masses, Preprint UCRL-100195, Lawrence Livermore National Laboratory, 1988.
| EXP1 | EXP2 | MC1 | MC2 | |||||
| Peak | Peak | Peak | Peak | |||||
| 0.99 | 5.4 | 1 | 4.7 | 0.99 | 3.5 | 1 | 4.2 | |
| 1 | 5.4 | 1.01 | 5.0 | 1 | 3.7 | 0.99 | 4.2 | |
| 0.33 | 8 | 0.33 | 8 | 0.33 | 5 | 0.34 | 7 | |
| layer number | |||||||||
| I | 1.04 | 0.02 | 1.9 | 1.07 | 0.04 | 1.5 | 1.03 | 0.04 | 2.3 |
| II | 1.05 | 0.02 | 1.8 | 1.05 | 0.04 | 1.5 | 1 | 0.04 | 2.3 |
| III | 1.29 | 0.06 | 5 | 1.27 | 0.07 | 4 | 0.98 | 0.08 | 6.4 |